Abstract:A three-dimensional numerical model verified by previous experimental data is developed to simulate the fluidized bed gasification of refuse derived fuel (RDF). The CaO dechlorination model obtained by the thermal gravity analysis (TGA) is coupled to investigate the process of CaO dechlorination. An Eulerian-Eulerian method is adopted to simulate the gas-solid flow and self-developed chemical reaction modules are used to simulate chemical reactions. Flow patterns, gasification results and dechlorination efficiency are obtained by numerical simulation. Meanwhile, simulations are performed to evaluate the effects of Ca/Cl molar ratio and temperature on dechlorination efficiency. The simulation results show that the presence of bubbles in the gasifier lowers the CaO dechlorination efficiency. Increasing the Ca/Cl molar ratio can enhance the dechlorination efficiency. However, with the temperature increasing, the dechlorination efficiency increases initially and then decreases. The optimal Ca/Cl molar ratio is in the range of 3.0 to 3.5 and the optimal temperature is 923 K.
Key words:dechlorination; numerical simulation; bubbling fluidized bed; gasification; refuse derived fuel
Refuse derived fuel (RDF) utilization is an effective method to solve the problem caused by solid waste as it has the advantages of high calorific value, easy storage and transportation[1], and syngas can be obtained by RDF gasification technology. However, the high chlorine content is an important factor in secondary pollution during RDF gasification. Chlorine in RDF presents in two forms, including inorganic chlorides (HCl or Cl2) and organic chlorides (chlorinated organics), and most of them will transform into HCl when utilizing RDF[2]. HCl can cause equipment heating-surfaces to become corrosive and human respiratory systems to be affected. CaO sorbent is one of the most promising candidates for dechlorination due to its low cost and relatively high chlorine capture capacity[3].
Generally, the method of experimentation is used to research the characteristic of dechlorination, but it has limitations in funding, operability and external conditions. With the development of hardware and numerical methods, the application of numerical simulations has become more extensive. It can help to obtain the data, optimize the design and operation parameters. However, few simulations have focused on dechlorination. Zang et al.[4-5] simulated the flue gas dechlorination in the spray dryer of a waste incineration power plant. However, compared to the flue gas dechlorination, dechlorination in the gasifier can effectively solve the corrosion problem caused by chlorine. Hence, it is necessary to develop numerical models to study the dechlorination in the gasifier.
This paper focuses on the performances of CaO dechlorination in a RDF bubbling fluidized bed gasifier. For this, the CaO-HCl reaction model calculated by TGA was coupled after validating the RDF gasification model. An Eulerian two-fluid model using multiple phases was adopted to simulate the gas-solid flow in the reactor. The user-defined functions (UDFs) were developed for reactions along with the kinetics and diffusion based on reaction rates. Meanwhile, the effects of Ca/Cl molar ratio and temperature on dechlorination were analyzed.
Two phases are considered in the model. The gas phase includes H2, CO2, CO, CH4, C6H6, HCl, H2O, O2 and N2. The solid phase includes RDF, char, ash, CaO, CaCl2 and dolomite (bed material). Gas flow, particle motion, turbulent and chemical reactions are related to multiphase flow, heat transfer and mass transfer.
1.1 Governing equations of the gas-particle flow
The continuity equations for gas and solid phases are given by
![]()
![]() ·(αgρgνg)=Sgs
·(αgρgνg)=Sgs
(1)
![]()
![]() ·(αsρsνs)=Ssg
·(αsρsνs)=Ssg
(2)
where α is the volume fraction, %; ρ is the density, kg/m3; ν is the instantaneous velocity, m/s; S is the source term due to the mass transfer between the gas phase and solid phase, kg/(m3·s).
The momentum equations can be expressed as
![]()
![]() ·(αgρgνgνg)=
·(αgρgνgνg)=
-αg![]() Pg+αgρgg-β(νg-νs)+
Pg+αgρgg-β(νg-νs)+![]() ·τg+Sgsνs
·τg+Sgsνs
(3)
![]()
![]() ·(αsρsνsνs)=
·(αsρsνsνs)=
-αs![]() Ps+αsρsg-β(νs-νg)+
Ps+αsρsg-β(νs-νg)+![]() ·τs+Ssgνs
·τs+Ssgνs
(4)
where p is the average pressure of the mixed phase, Pa; τ is the stress-strain tensor, kg/(m2·s); g is the gravity, m/s2; β is the interphase momentum exchange coefficient between the gas and solid phase, kg/(m3·s).
The governing transport equations for k and ε only take the gas phase form:
![]()
![]() ·(αgρgνgk)=
·(αgρgνgk)=![]()
![]()
αgGk,g-αgρgεg+∏k
(5)
![]()
![]() ·(αgρgνgε)=
·(αgρgνgε)=![]()
![]()
![]() ∏ε
∏ε
(6)
where Πk and Πε represent the influence of the solid phase on the gas phase; Gk is the production of turbulent kinetic energy, kg/(m·s3).
The enthalpy equations of each phase take the form
![]()
![]() ·(αgρgνgHg)=
·(αgρgνgHg)=
![]() ·(λg,eff
·(λg,eff![]() Tg)+Qsg+SgsHs
Tg)+Qsg+SgsHs
(7)
![]()
![]() ·(αsρsνsHs)=
·(αsρsνsHs)=
![]() ·(λs,eff
·(λs,eff![]() Ts)+Qsg+SsgHs
Ts)+Qsg+SsgHs
(8)
where H is the specific enthalpy, kJ/kg; λg,eff and λs,eff
are the thermal conductivity, W/(m·K); Q is the heat transfer between two phases, W/m3.
1.2 Species transport equations
The species transport equations are considered as
![]()
![]() ·(αgρgνgYi,g)=
·(αgρgνgYi,g)=![]() ·αgJi,g+Ri,g
·αgJi,g+Ri,g
(9)
![]()
![]() ·(αsρsνsYi,s)=
·(αsρsνsYi,s)=![]() ·αsJi,s+Ri,s
·αsJi,s+Ri,s
(10)
where Yi is the local mass fraction of each species, %; Ji is the diffusion flux of species, mol/(m2·s); Ri is the net rate, mol/(m3·s).
1.3 Gasification reactions kinetics
The reactions in the process of gasification include RDF pyrolysis and devolatilization, and heterogeneous and homogeneous reactions. Assume that all chloride is converted to HCl[2] and reactions with sulfur and nitrogen are not taken into account. The major conversions are considered as follows:
RDF→α1C+α2H2+α3CH4+α4CO2+α5CO+
α6H2O+α7C6H6+α8ash
(11)
RDF→α9HCl
(12)
2C+1.5O2→CO2+CO
(13)
C+CO2→2CO
(14)
C+H2O→CO+H2
(15)
CO+0.5O2→CO2
(16)
H2+0.5O2→H2O
(17)
CH4+1.5O2→CO+2H2O
(18)
The gas compositions after pyrolysis are determined by elemental analysis as show in Tab.1[6]. The frequency factor and activation energy of Eqs.(11) to Eqs.(18) are obtained from Refs.[7-9].
Tab.1 Proximate and ultimate analysis of RDF

SampleUltimateanalysis/%w(C)w(H)w(O)w(N)w(S)w(Cl)Proximateanalysis/%w(M)w(A)w(V)w(FC)Qa,net/(MJ·kg-1)RDF44.585.4639.430.230.140.2928.411.7467.9721.8614.40
1.4 Dechlorination reactions kinetics
CaO dechlorination is considered as

(19)
The relationships between the CaO conversion rate X and reaction time obtained by TGA are shown in Fig.1. The CaO conversion rate is linear with reaction time and the maximum conversion rate is achieved at 923 K. It is concluded that the CaO-HCl reaction has been under chemical reaction control (CRC)[10].
The kinetics parameters shown in Tab.2 are calculated by the shrinking core model[10]
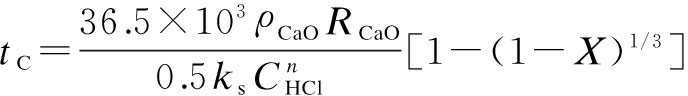
(20)
where tC is the reaction time in CRC stage,s;ρCaO is the molar density of CaO,mol/m3;RCaO is the particle radius of CaO,m;ks is the reaction rate constant, m/s; CHCl is the concentration of HCl, mg/m3; n is the order of reaction.
Tab.2 Kinetics parameters of the CaO-HCl reaction
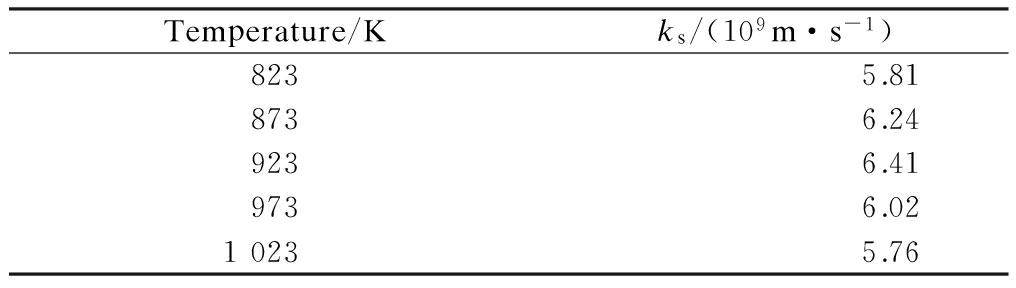
Temperature/Kks/(109m·s-1)8235.818736.249236.419736.0210235.76

Fig.1 Relationships of CaO conversion rate and time
1.5 Numerical considerations
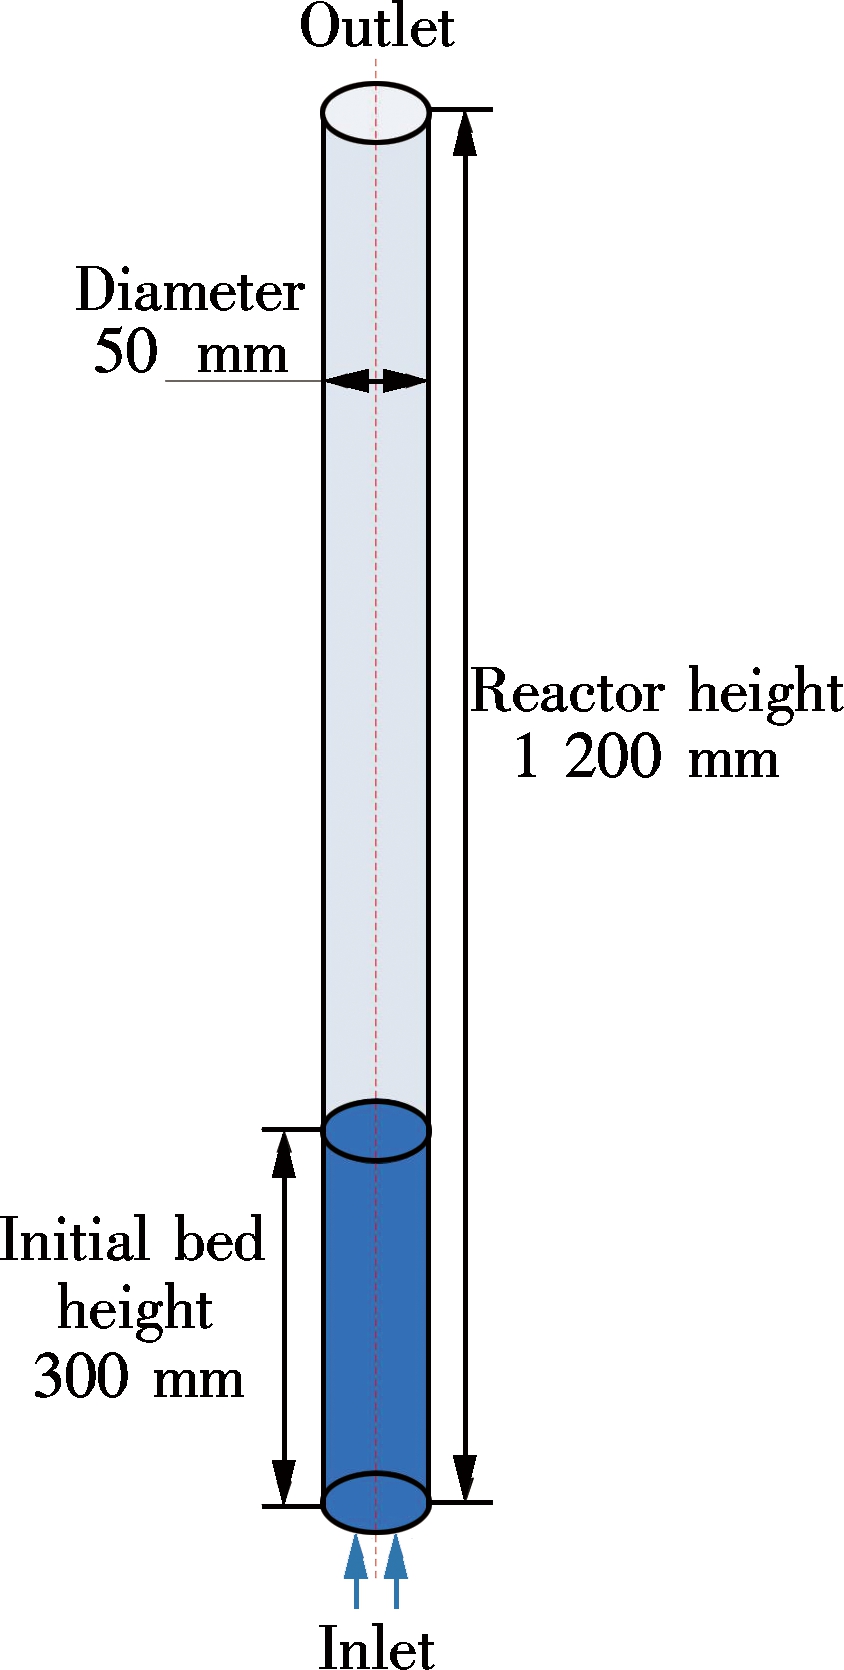
The simulations were carried out based on the experimental setup[7]. As shown in Fig.2, the width of the bubbling fluidized bed is 50 mm and the height is 1 200 mm. The meshes composed of 185 820 cells were adopted after the sensitivity analysis of the grid. The encryption was used in the lower part of the fluidized bed. A first-order upwind discretization was used for all solutions. The equations were solved by the finite volume method. The phase coupled SIMPLE was used to solve the pressure-velocity coupling. The time step was 1.0×10⁻⁴ s.
(a)
(b)
(Fig.2 Object of numerical simulation. (a) Schematic of the fluidized bed gasifier; (b) Grids division
For the boundary conditions, the velocity-inlet and pressure-outlet boundary were adopted. Initially, the bed height was 300 mm and the particles in bed were packed with the volume fraction of 0.55. The no-slip wall condition for both gas and solid phase was assumed.
Gas and particles flowed into the gasifier from the inlet, and the gas generated by gasification outflow from the outlet. The apparent density of bed material was 2 490 kg/m3 and its average particle size was 0.23 mm. In accordance with the experimental conditions, the gas made up of 45% O2 and 55% N2 was used as the fluidizing agent. The flow rate of RDF and gas was 4.5 kg/h and 0.36 m3/h, respectively.
2.1 Gasification model validation
The RDF gasification numerical model is validated before coupling the reaction of CaO-HCl. Fig.3 shows the comparison of the main gas component from the simulation and experiment. As can be seen, the variations of simulation and experiment are basically the same. The maximum relative error of all the data is less than 20%, suggesting that the model is appropriate for RDF fluidized bed gasification.
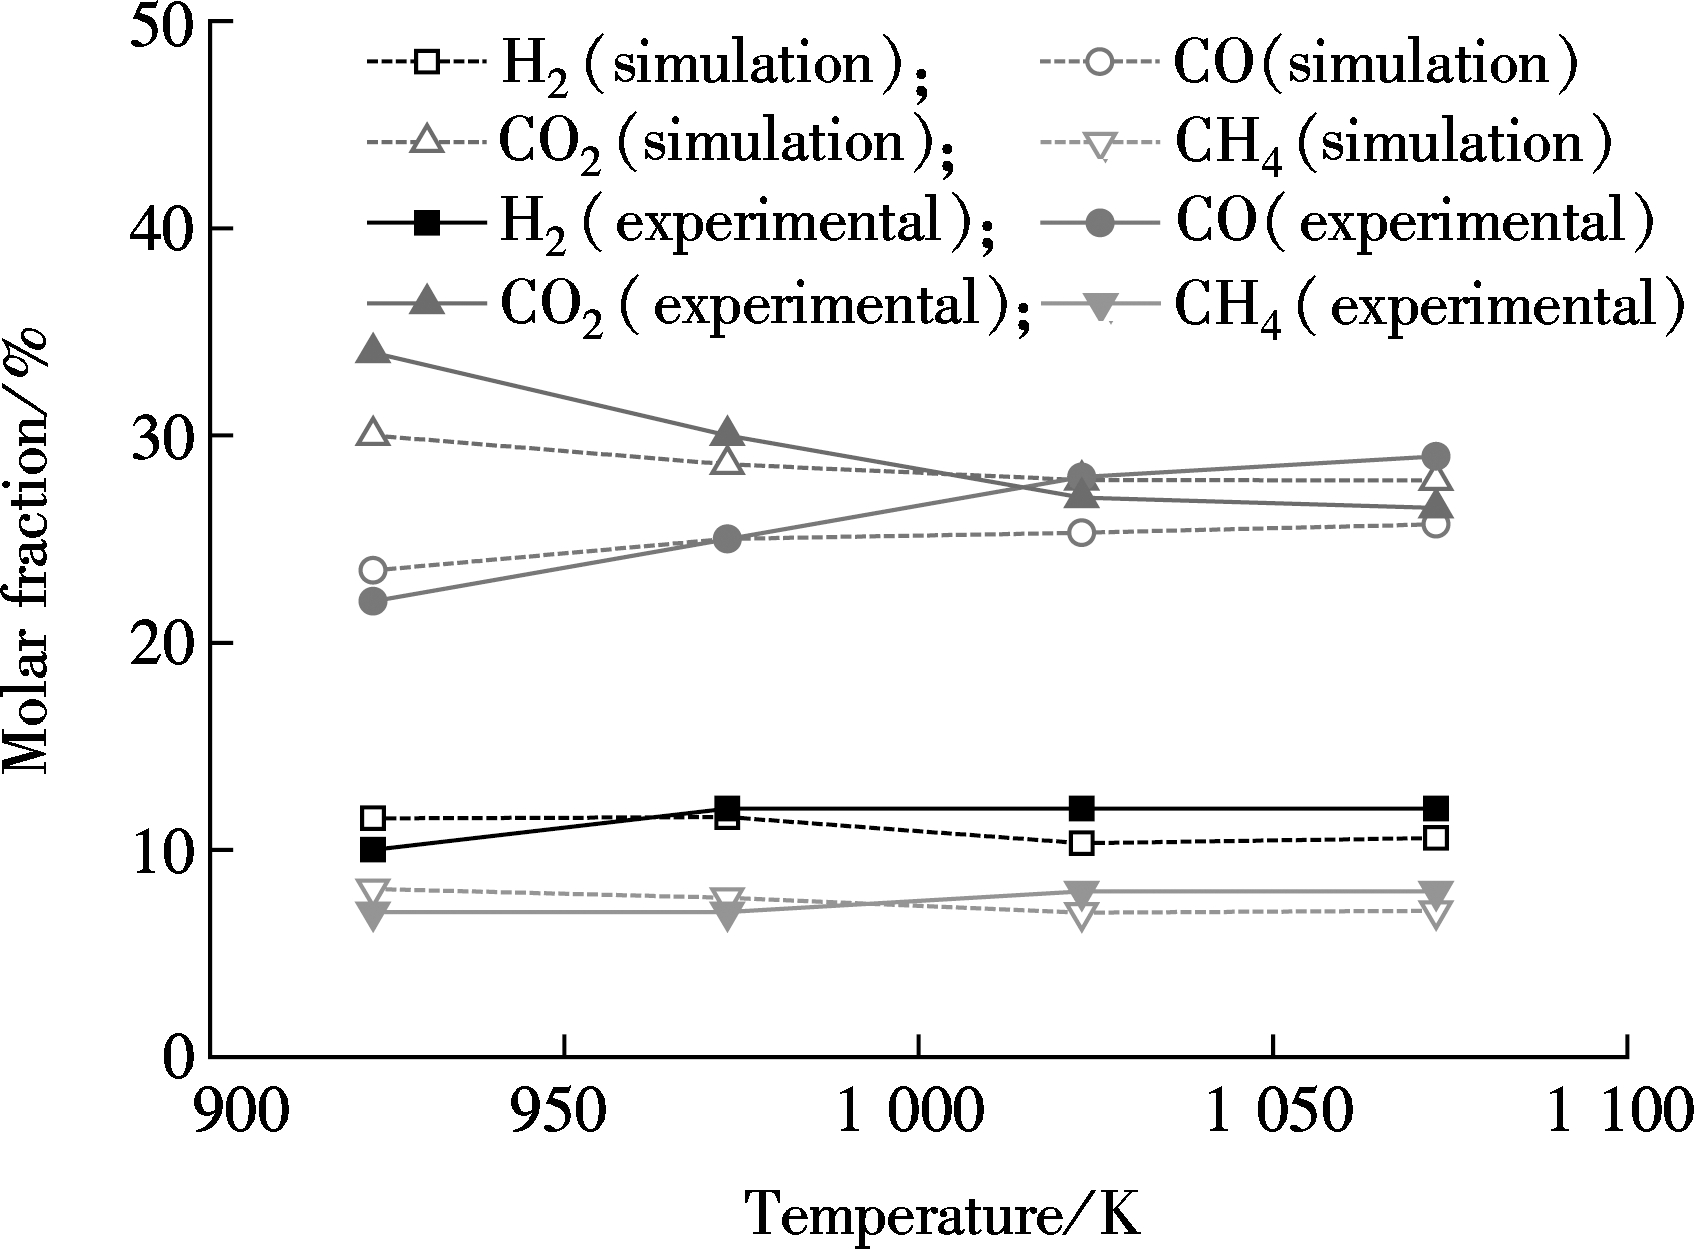
Fig.3 Comparison of simulation and experimental gasification results
2.2 Dechlorination characteristics
Fig.4 displays the variations of the HCl concentration at the outlet. CaO is added under the conditions of a Ca/Cl molar ratio of 3.0 at 8 s. The process of dechlorination can be divided into three sequential stages. In the first stage(8 s<t≤11 s), the HCl concentration has slight fluctuations. However, it has a rapid decrease in the second stage(11 s<t≤19 s). The decrease rate slows down, and the HCl concentration oscillates around a fixed value in the third stage(19 s<t≤22 s). The dechlorination efficiencies of CaO are about 87.88% at 873 K and 95.78% at 923 K.
The comparison of the HCl concentrations and HCl-CaO reaction rates inside a bubble and at the surfaces where the bubble stays is shown in Fig.5. As can be seen, the position of the tracer bubble rises from 60 to 340 mm during its lifetime, and the HCl concentration in the bubble is higher than that in the emulsion phase. On the contrary, the HCl-CaO reaction rate in the bubbles is lower than that at the sections where the bubble stays. The comparison result implies that bubbles lower the gas-solid contact efficiency, and further lower conversions of gas-solid reactions.
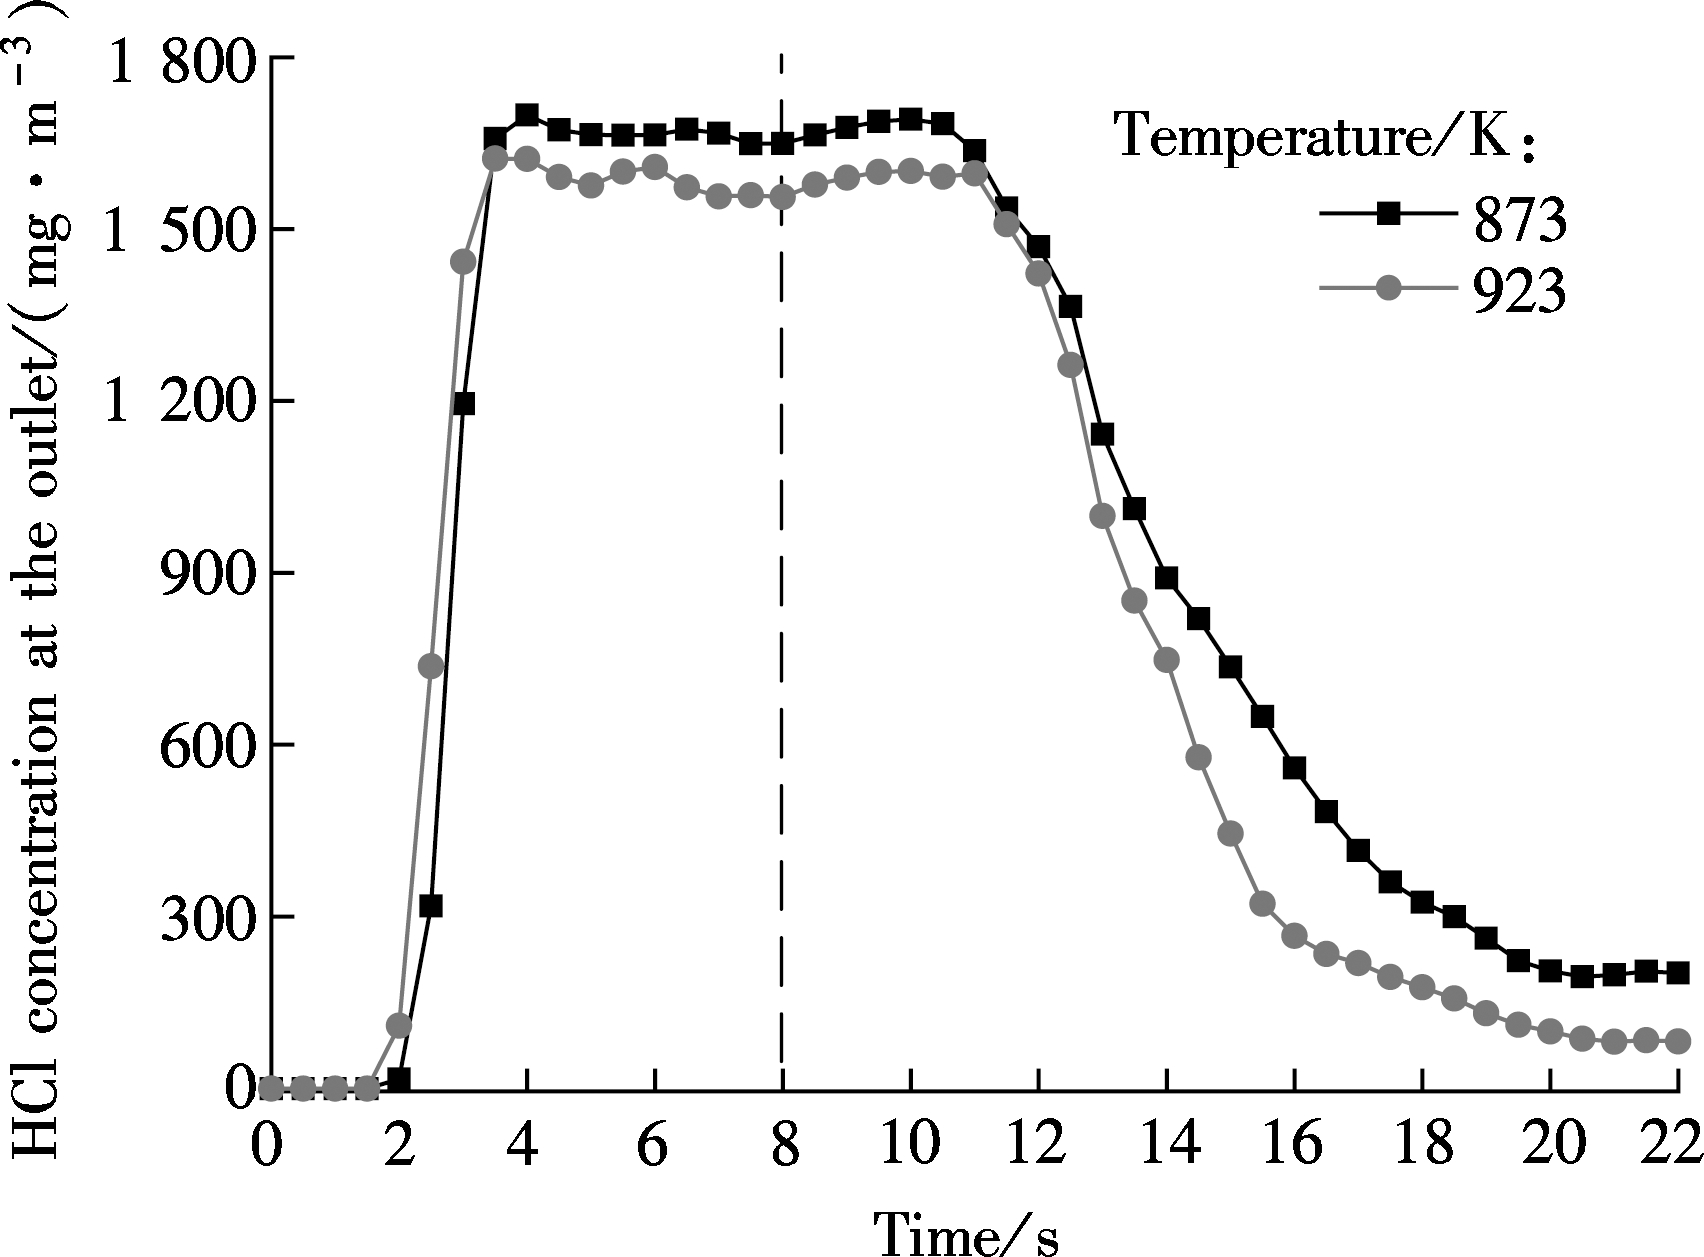
Fig.4 Variation of the gas molar fractions at the outlet

Fig.5 Comparison of characteristics inside a bubble and at the sections where the bubble stays
2.3 Influence of the Ca/Cl molar ratio
Fig.6 shows the effect of the Ca/Cl molar ratio on the HCl concentration at the outlet. It can be seen that the Ca/Cl molar ratio of 1.5 and 2.0 corresponds to the weaker dechlorination effect. The Ca/Cl molar ratios of 3.0, 3.5 and 4.0 correspond to a shorter time of being stable and lowering HCl concentration after dechlorination. As illustrated in Fig.7, the dechlorination efficiency is greatly enhanced with the increase in the Ca/Cl molar ratio, but this change retards after the Ca/Cl molar ratio is beyond 3.5. It is mainly because a smaller proportion of particles can participate in the reaction with the increase of CaO. These observations are in accordance with the experimental results of Li et al[11].
2.4 Influence of the temperature
The performances of CaO with the specified Ca/Cl molar ratio of 3.0 at different temperatures are illustrated in Fig.8. It shows that the HCl concentration is the lowest and the time of being stable is the shortest at 923 K. Fig.9 demonstrates the effect of temperature on dechlorination efficiency. It shows that the dechlorination efficiency increases as the temperature increases from 823 to 923 K, but it begins to decline dramatically when the temperature exceeds 923 K. The maximum dechlorination efficiency is obtained at 923 K. These observations agree with Ref.[12].

Fig.6 Effect of the Ca/Cl molar ratio on HCl concentration at the outlet (T=923 K)
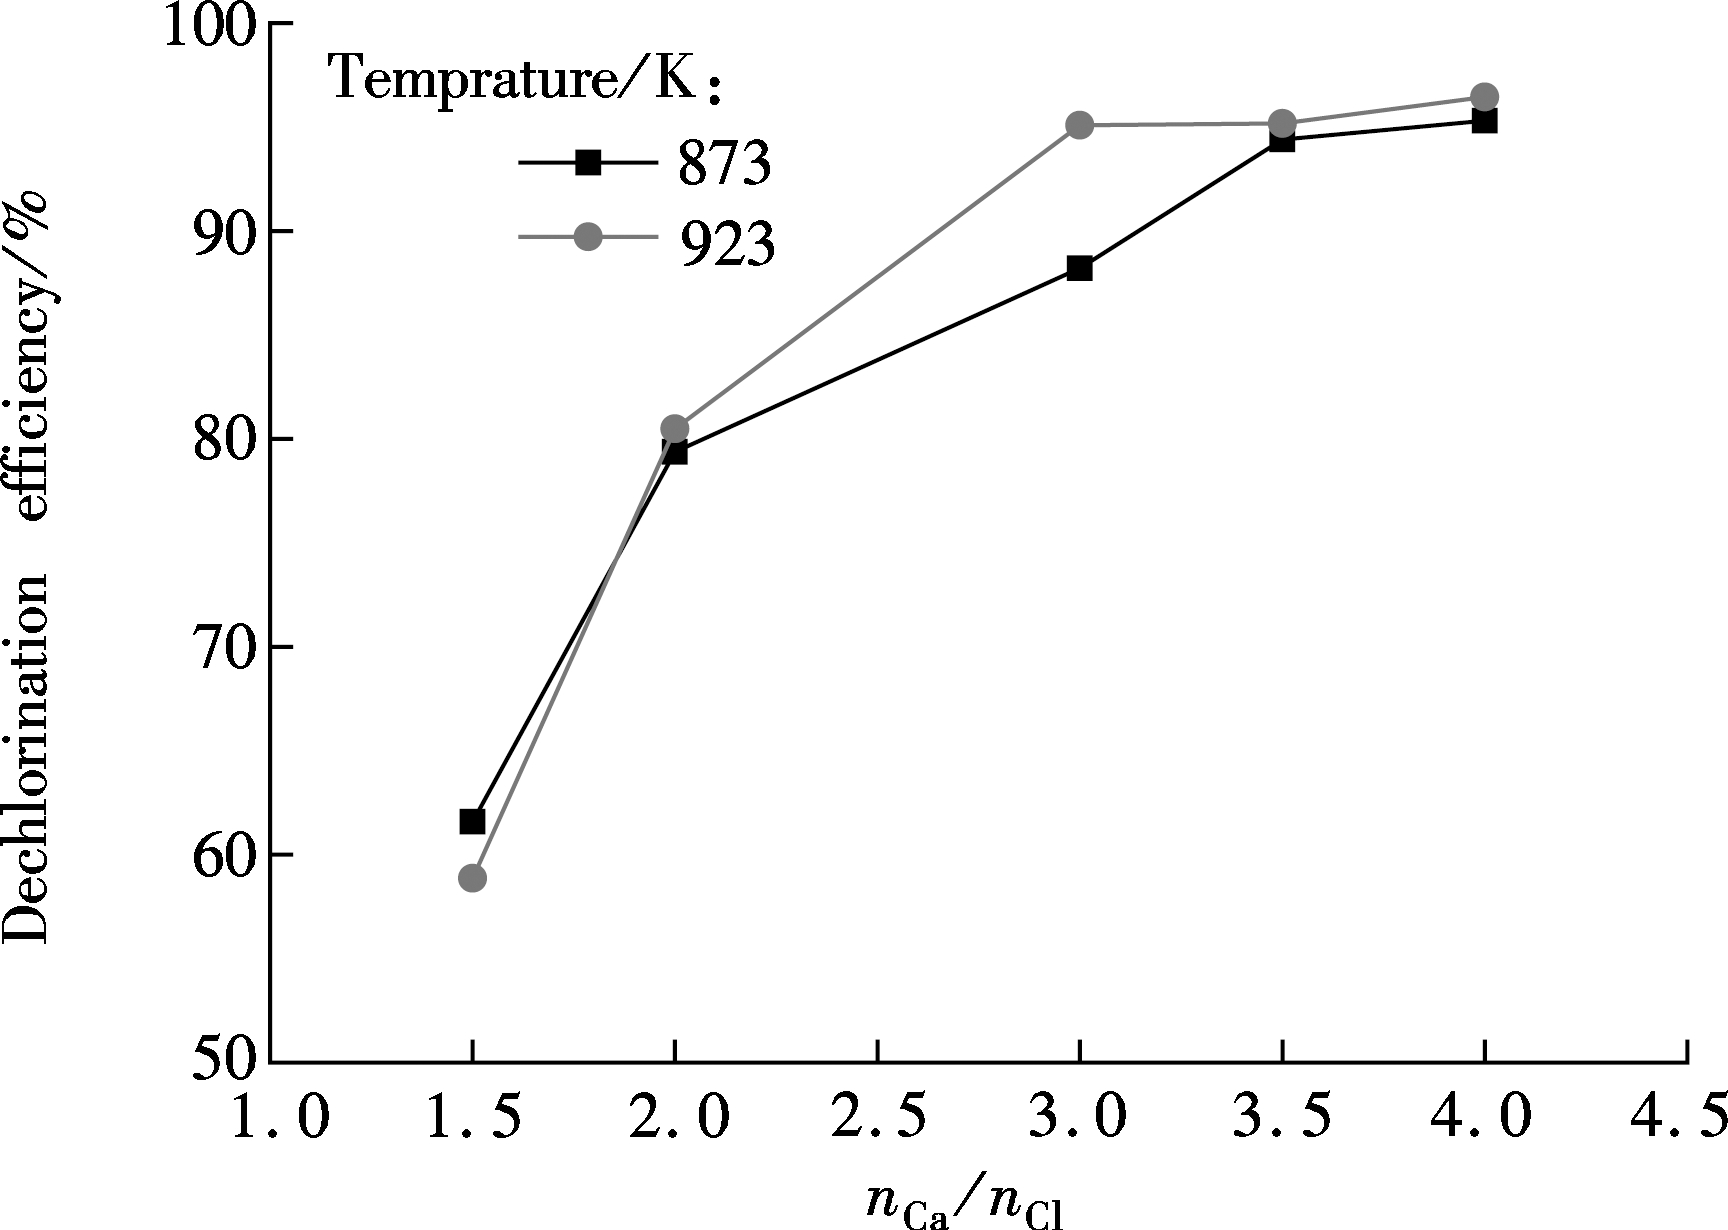
Fig.7 Effect of the Ca/Cl molar ratio on dechlorination efficiency
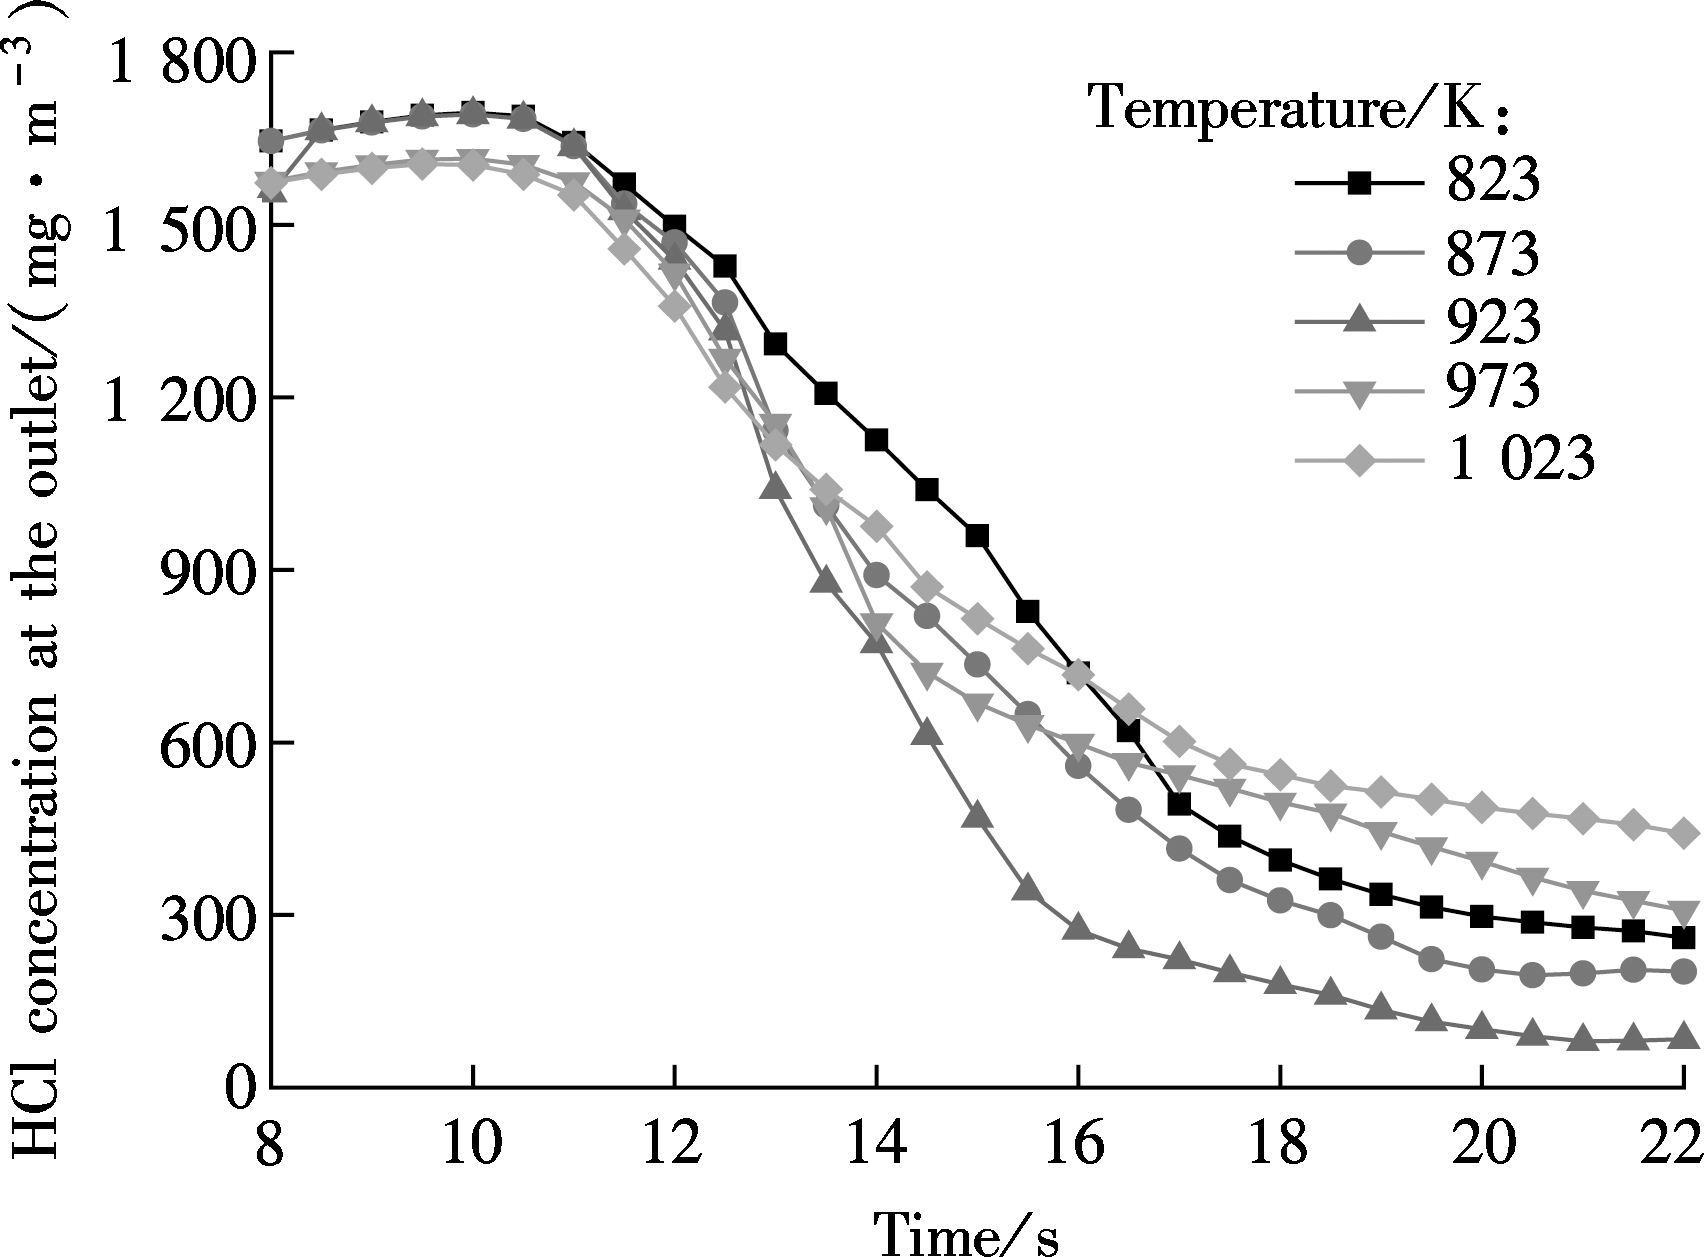
Fig.8 Effect of the temperature on HCl concentration at the outlet (nCa/nCl=3.0)
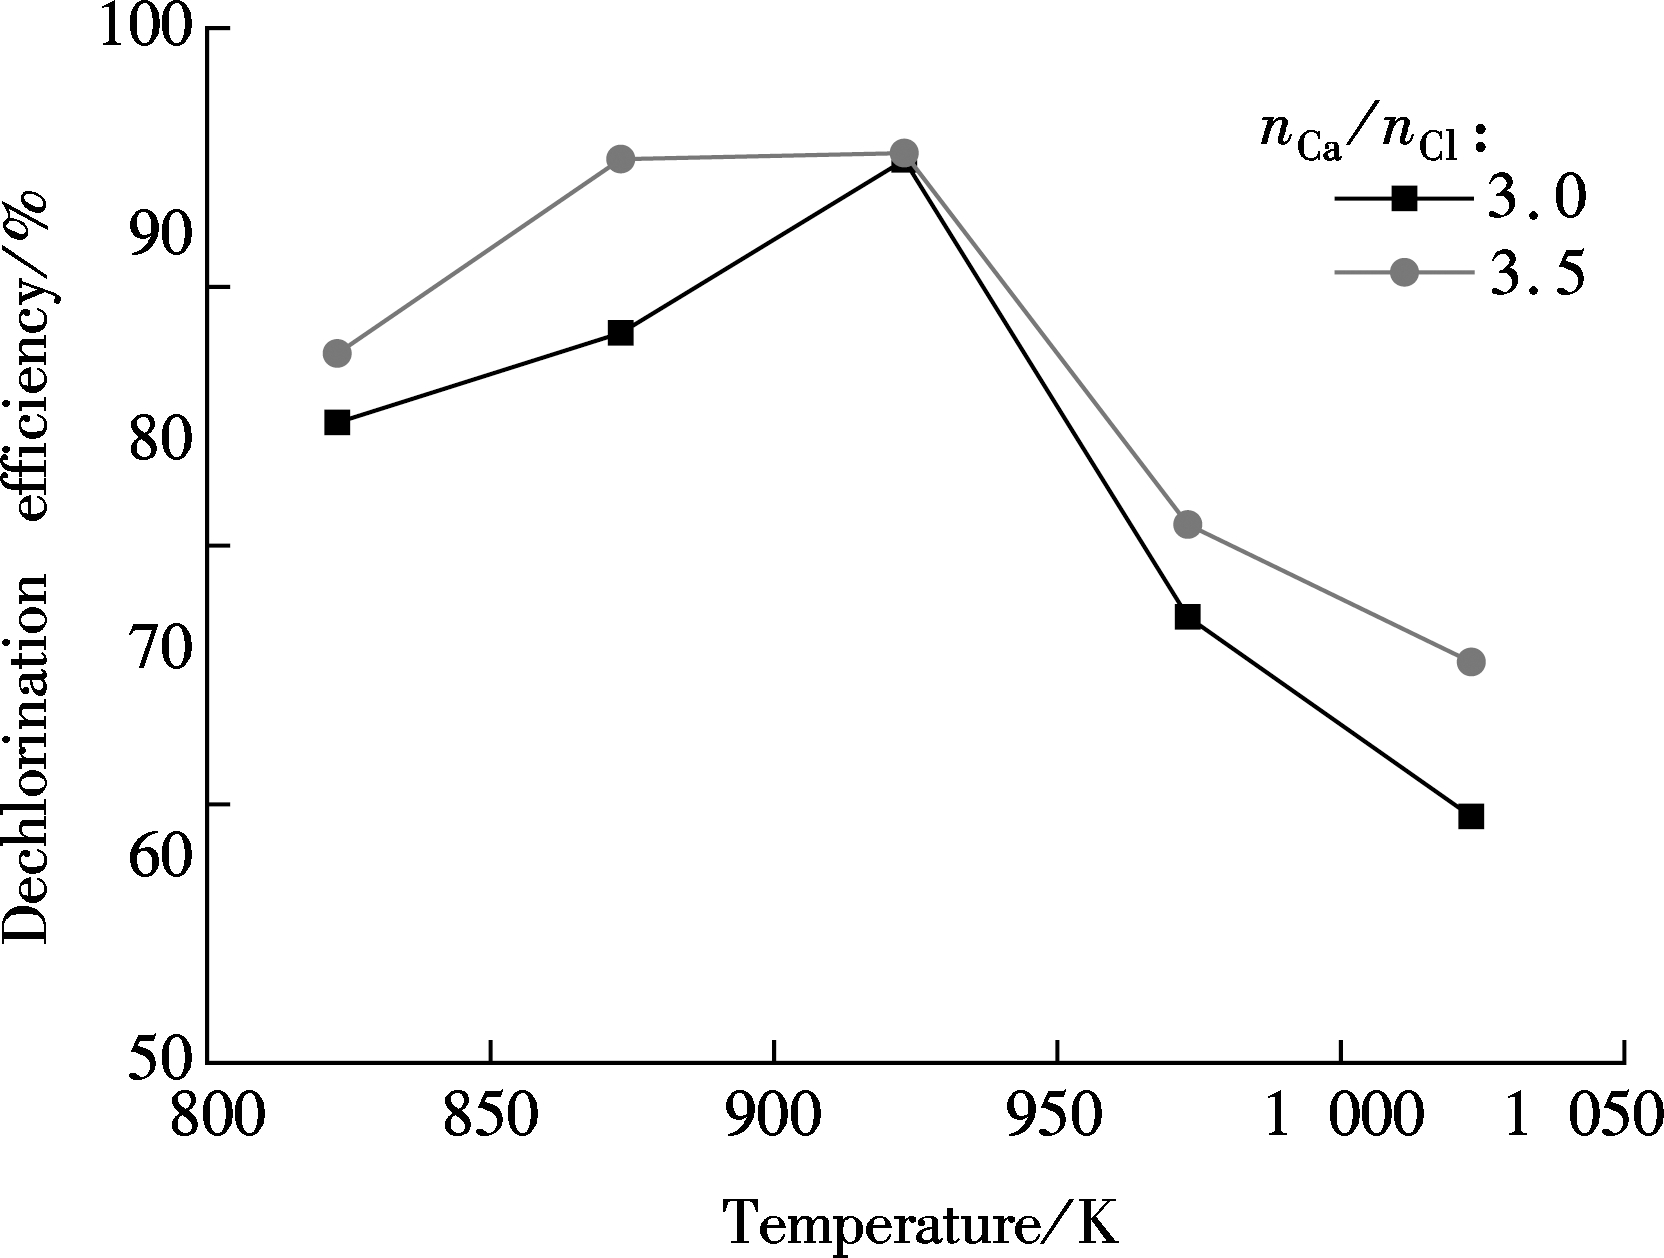
Fig.9 Effect of the temperature on dechlorination efficiency
1) The model is reliable in simulating RDF gasification in a bubbling fluidized bed. The CaO dechlorination model is successfully coupled into the RDF gasification.
2) The HCl concentration in the bubbles is higher than that at the sections where the bubble stays. However, the HCl-CaO reaction rate in the bubbles is lower than that in the emulsion phase, indicating that the existence of bubbles may lower the contact efficiency of HCl and CaO, and further decrease the efficiency of HCl-CaO reactions.
3) Increasing the Ca/Cl molar ratio can enhance the CaO dechlorination efficiency. With the increase in temperature, the efficiency first increases and then decreases. The optimum Ca/Cl molar ratio is in the range of 3.0 to 3.5, and the optimum dechlorination temperature is 923 K.
References:
[1]Reza B, Soltani A, Ruparathna R, et al. Environmental and economic aspects of production and utilization of RDF as alternative fuel in cement plants: A case study of metro vancouver waste management[J]. Resources, Conservation and Recycling, 2013, 81: 105-114. DOI:10.1016/j.resconrec.2013.10.009.
[2]Ma W, Hoffmann G, Schirmer M, et al. Chlorine characterization and thermal behavior in MSW and RDF[J]. Journal of Hazardous Materials, 2010, 178(1/2/3): 489-498. DOI:10.1016/j.jhazmat.2010.01.108.
[3]Corella J, Toledo J M, Molina G. Performance of CaO and MgO for the hot gas clean up in gasification of a chlorine-containing (RDF) feedstock[J]. Bioresource Technology, 2008, 99(16): 7539-7544. DOI:10.1016/j.biortech.2008.02.018.
[4]Zang R D, Zhang L. Numerical simulation and experimental on deacidification of flue gas by co-combustion of MSW with coal[J]. Journal of China Coal Society, 2011, 36(8): 1385-1390. (in Chinese)
[5]Xie H, Zhang Y, Zhang Y. Numerical simulation and experimental study of flue gas cleaning in waste incineration power plants[J]. Proceedings of the Chinese Society for Electrical Engineering, 2008, 28(5): 17-22.(in Chinese)
[6]Niu M M, Huang Y J, Jin B S, et al. Enriched-air gasification of refuse derived fuel in bubbling fluidized bed[J]. CIESC Journal, 2014, 65(12):4971-4977. (in Chinese)
[7]Chen J, Huang L W, Zhang X M. Pyrolysis analysis of RDF by TG-FTIR techniques[J]. Environmental Science & Technology, 2008, 31(1): 29-32. (in Chinese)
[8]Barman N S, Ghosh S, De S. Gasification of biomass in a fixed bed downdraft gasifier—A realistic model including tar[J]. Bioresource Technology, 2012, 107:505-511. DOI:10.1016/j.biortech.2011.12.124.
[9]Gao J, Zhao Y, Sun S, et al. Experiments and numerical simulation of sawdust gasification in an air cyclone gasifier[J]. Chemical Engineering Journal, 2012, 213: 97-103. DOI:10.1016/j.cej.2012.09.076.
[10]Duo W, Kirkby N F, Seville J P K, et al. Alteration with reaction progress of the rate limiting step for solid-gas reactions of Ca-compounds with HCl[J]. Chemical Engineering Science, 1995, 50(13): 2017-2027. DOI:10.1016/0009-2509(95)00064-c.
[11]Li Y, Wang H, Jiang L, et al. HCl and PCDD/Fs emission characteristics from incineration of source-classified combustible solid waste in fluidized bed[J]. RSC Advances, 2015, 5(83): 67866-67873. DOI:10.1039/c5ra08722h.
[12]Lee J, Feng B. A thermodynamic study of the removal of HCl and H2S from syngas[J]. Frontiers of Chemical Science and Engineering, 2012, 6(1): 67-83. DOI:10.1007/s11705-011-1162-4.
Citation:Wang Ting, Jin Baosheng, Niu Miaomiao, et al. Numerical simulation on the fluidized bed gasification and CaO dechlorination of refuse derived fuel[J].Journal of Southeast University (English Edition),2016,32(3):317-321.DOI:10.3969/j.issn.1003-7985.2016.03.010.
DOI:10.3969/j.issn.1003-7985.2016.03.010
摘要:首先建立了与试验台一致的鼓泡流化床垃圾衍生燃料气化的三维数值模型,并在此基础上导入热重试验得到的CaO脱氯模型,研究了CaO脱氯规律.其中,流场计算采用欧拉两相流模型,化学反应采用UDF导入,模拟得到了反应器内气固流动特性、气化结果及脱氯效率.此外,通过模拟不同工况,得出了不同Ca/Cl摩尔比和反应温度对脱氯效率的影响规律.模拟结果表明,在脱氯过程中,CaO脱氯效率会受到鼓泡床中气泡的影响;CaO脱氯效率随着Ca/Cl摩尔比的增加而增加,但随反应温度的升高呈先上升后下降的趋势,最佳Ca/Cl摩尔比在3.0~3.5之间,最佳脱氯温度为923 K.
关键词:脱氯;数值模拟;鼓泡流化床;气化;垃圾衍生燃料
中图分类号:X507
Received:2016-02-22.
Foundation item:The National Natural Science Foundation of China (No.51476032).
Biographies:Wang Ting (1990—), female, graduate; Jin Baosheng (corresponding author), male, professor, bsjin@seu.edu.cn.