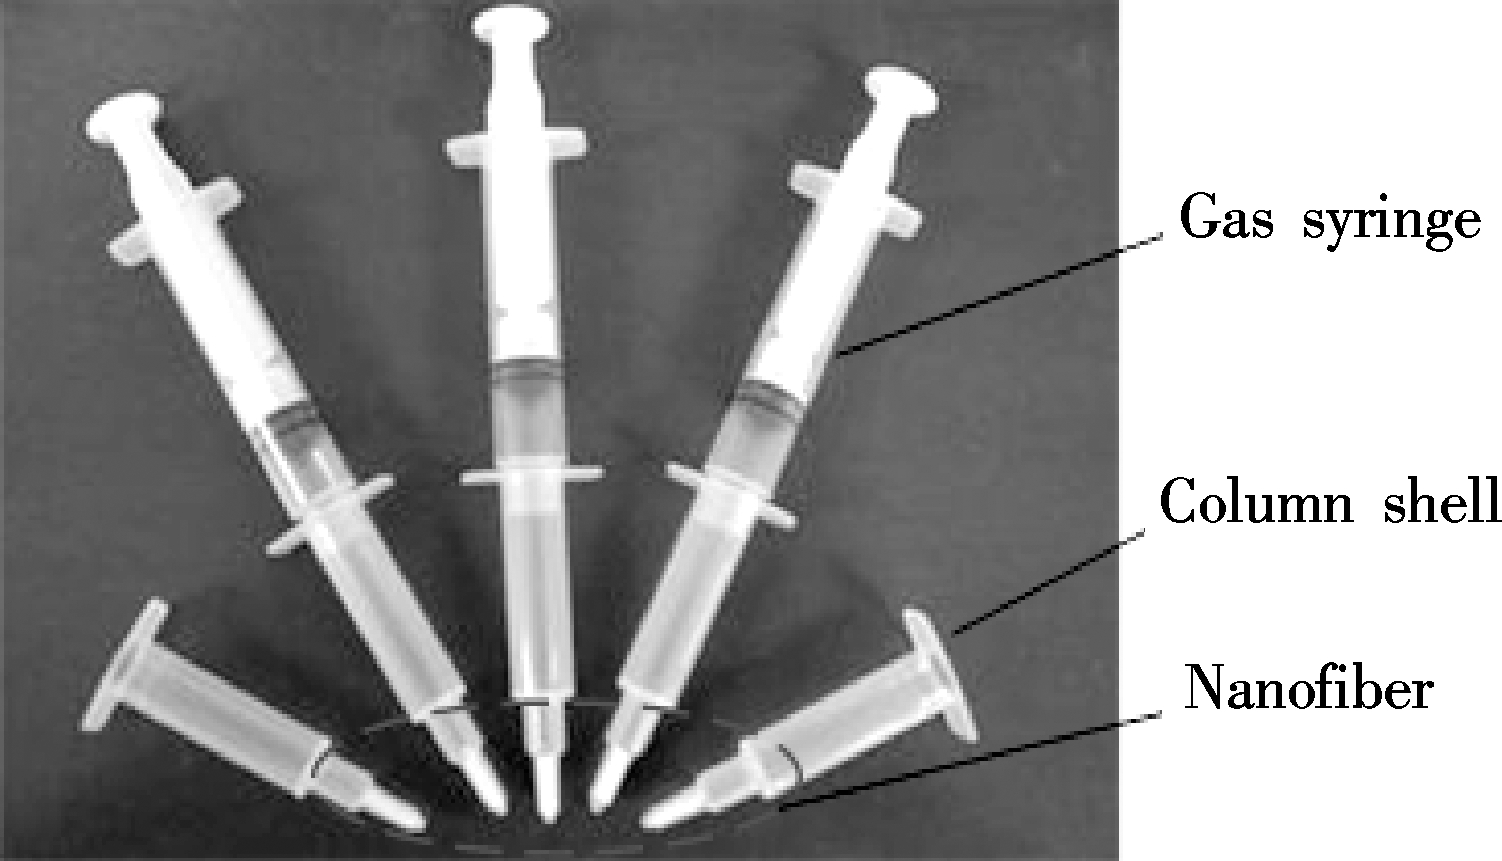
Fig.1 Schematic diagram for PFSPE column
Abstract:A new method for simultaneous determination of four phthalate esters (PAEs) in commercial fat-containing foods was developed by the combination of a packed nanofibers column based on solid-phase extraction with gas chromatography-flame ionization detector (GC-FID). Conditions for obtaining optimum extraction efficiency such as extraction solvents, morphologies of adsorbent, ion strength and pH were investigated and optimized in detail. Under the optimized conditions, the limits of detection (LODs) found for dibutyl phthalate (DBP), butyl benzyl phthalate (BBP), diethyl hexyl phthalate (DEHP) and di-n-octyl phthalate (DNOP) were 50, 25, 50 and 25 ng/g, respectively. Good linearity of four PAEs was achieved in the range of 50 to 4 000 ng/g. The proposed method was applied for analyzing different kinds of fat-containing samples. PAEs in commercial fat-containing samples can be highly extracted by a packed solid-phase extraction column of 5 mg polystyrene (PS) nanofibers. The satisfactory average recoveries were obtained in the range of 96.7% to 102.3%, and the relative standard deviations (RSDs) below 5% were achieved. The proposed method reduces the organic solvent consumption, the complex and tedious procedures for sample pretreatment, and achieves high sensitivity and reproducibility for the investigated PAEs.
Key words:phthalate esters (PAEs); nanofibers; solid-phase extraction; gas chromatography; fat-containing foods
Phthalate esters (PAEs), also known as phthalate, are a group of important organic compounds that are widely used as plasticisers and solvents in commercial, medical and personal care products[1]. They may migrate from plastic to the external environment during use, which causes contamination of food, water, air and soil. PAEs are generally believed to have no obvious acute and chronic toxicity. However, as a kind of endocrine disrupting hormone, it has been monitored closely by many countries in the world. Apart from these, PAEs can damage human’s reproductive systems via food, air and the skin[2].
Several methods of detecting PAEs in food have been developed, with the common analytical methods including thin-layer chromatography[3], GC-FID[4], and HPLC-PDA[5]. The primary sample pretreatment methods are included in liquid-liquid extraction[6], solid-phase extraction[7] and solid-phase micro-extraction[8-11]. The phthalates have high affinity with an oily environment, and analyzing these chemicals in fat-containing foods is difficult because of the trace amount of the analytes and interference from the matrix. For the complexity of sample-matrix and the similar physico-chemical characteristics between PAEs and greases, the purification of oily samples was difficult, and the national standard method was very time-consuming and complicated[12]. Thus, in this work, a packed nanofiber solid-phase extraction (PFSPE) column was prepared to be used in the pretreatment of fat-containing foods. Through electrospinning polyamide, six nanofiber mats have been successfully used for the extraction of PAEs in edible oil[13-15]. However, Possi-Pezzali et al.[16] confirmed that the micro-column packing system consistently allowed higher recoveries than the disk format, and the difference in the number of theoretical plates may be due to the different geometries of the devices. Therefore, a polystyrene nanofiber micro-column system was developed to separate and pre-concentrate the trace levels of four PAEs (DBP,BBP,DEHP,DNOP) in cookie, chocolate and edible oil samples.
1.1 Instruments and reagents
The Agilent 7890A gas chromatography with HP-5 capillary column (30 m×0.32 mm×0.25 um) and a flame ionization detector were used to analyze and separate different components. A high-voltage power supply (QW-P403-1AC, Tianjin, China) and a syringe pump were used for electrospinning. The ultrasonic cleaner (JL-180, Shanghai, China) and pressure blowing concentrator were obtained from Guohua Instrument Co., Ltd, China. Methanol and normal hexane (HPLC-grade) were purchased from Shandong Yuwang Chemical Co., Ltd, China. A standard mixture of four PAEs consisting of DBP, BBP, DEHP and DNOP were purchased from Xiyu Chemical Co., Ltd, China, and diluted to 1 mg/mL in normal hexane, stored at 4 ℃.
1.2 Preparation of packed nanofiber solid extraction columns
The polystyrene (PS) was added into a mixed solvent composed of N,N-dimethylformamide and tetrahydrofuran (volume ratio 4∶6) and then stirred slowly at room temperature for 10 h. Then, a 10% (mass concentration) solution of polystyrene was prepared. After completely dissolving, the solution was removed quickly and put in the syringe with the stainless steel needle connected with the positive pole of 15 kV high voltage power. The collection screen connected to the negative power was placed at a distance of about 20 cm from the stainless steel needle. The solid-phase extraction column used in this study was prepared by filling 5 mg PS nanofibers in the thin bottom of the column (see Fig.1).
Fig.1 Schematic diagram for PFSPE column
1.3 Sample extraction procedure
Samples without detectable PAEs were used as blank samples. The blank sample was prepared as follows:
1) Weighting 0.5 g of the homogeneous sample and adding it into a 10 mL volumetric flask.
2) Adding 8 mL methanol and sonicating the mixture for 10 min, then bringing it to volume by methanol.
3) Pipetting 2 mL of the solution from the volumetric flask into a 5 mL centrifuge tube and centrifuging it at 1 000 r/min for 5 min, then separating the supernatant into another tube.
4) Drying the supernatant under nitrogen at 40 ℃.
5) Adding 3 mL methanol and 3 mL ultrapure water, blending for 1 min.
6) Adding 150 μL NaCl with a concentration of 1 mol/L, and then mixing for 1 min.
The packed SPE column shown in Fig.1 was activated by 100 μL methanol and 200 μL water, respectively. The sample solution was loaded and eluted through the column by the pressure of air from a gas tight plastic syringe. Then, the target retained on the column was eluted with 100 μL methanol and the eluate (1 μL) was injected into the GC for determination.
1.4 GC conditions
GC equipment (Agilent 7890A) consists of a FID detector and a HP-5 capillary column (30 m×0.25 mm×0.25 μm). The temperature program was as follows: The initial temperature was held at 150 ℃ for 2 min, increased to 300 ℃ at a rate of 10 ℃/min, and then held for 5 min. Nitrogen (99.999% grade) was used as the carrier gas, and the column flow was 1.0 mL/min. The injection volume was 1 μL. The temperatures for injector and detector were 280 and 300 ℃, respectively.
2.1 Material characterization
The morphologies of polystyrene were examined using a scanning electronic microscope (SEM). The SEM images for nanofibers of different dosage ratios are shown in Fig.2. Two typical morphologies such as bead-on-string structure and fiber structure can be obtained by adjusting the solvent-to-polymer concentration. There were grooves on the nanofiber surface which could increase the specific surface area, thus, promoting the adsorption capacity for PAEs.
2.2 Chromatogram behavior of four PAEs
The established method was applied for the determination of four PAEs in spiked samples, as shown in Fig.3.
Our experiment shows that the extraction efficiency of methanol or normal hexane is better than that of other solvents. Due to high toxicity of normal hexane, methanol was chosen as the ideal extraction solvent.
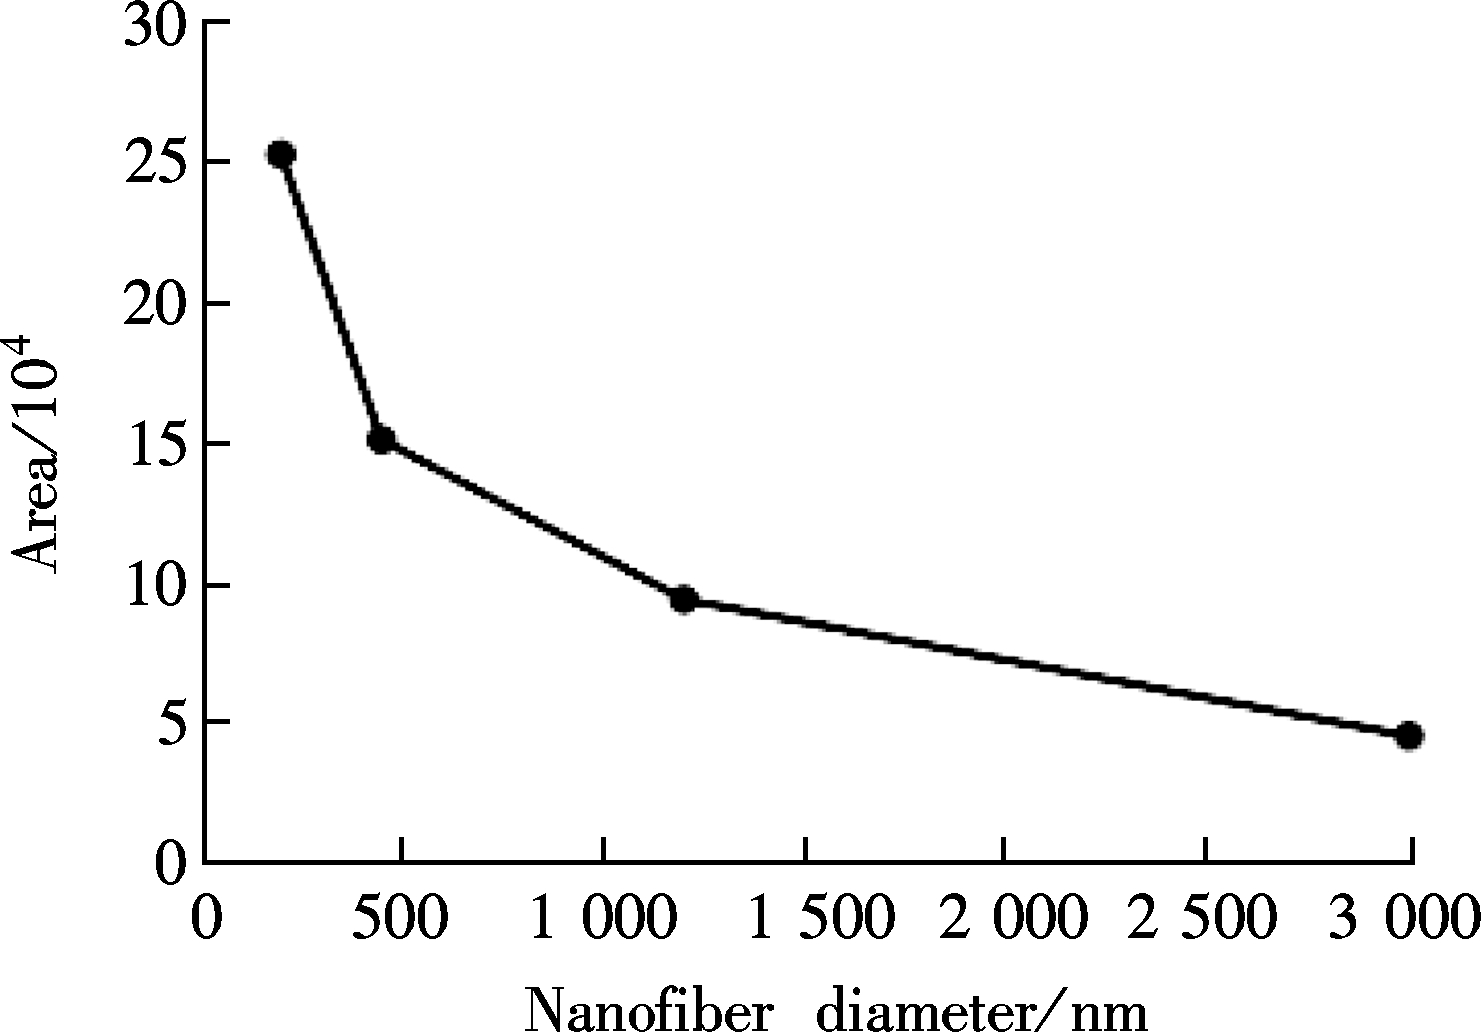
2.3 Influence of nanofiber diameter
Generally, the nanofiber diameter mainly depends on the polymer mass concentration. The nanofibers obtained with an average diameter of 190, 450, 1 200, and 3 000 nm were used as sorbents. As shown in Fig.4, the decrease of the fiber diameter can obviously facilitate the improvement of the extraction efficiency. However, decreasing the fiber diameter may cause a higher column pressure. Thus, the 10% solution was chosen for preparing the nanofibers.
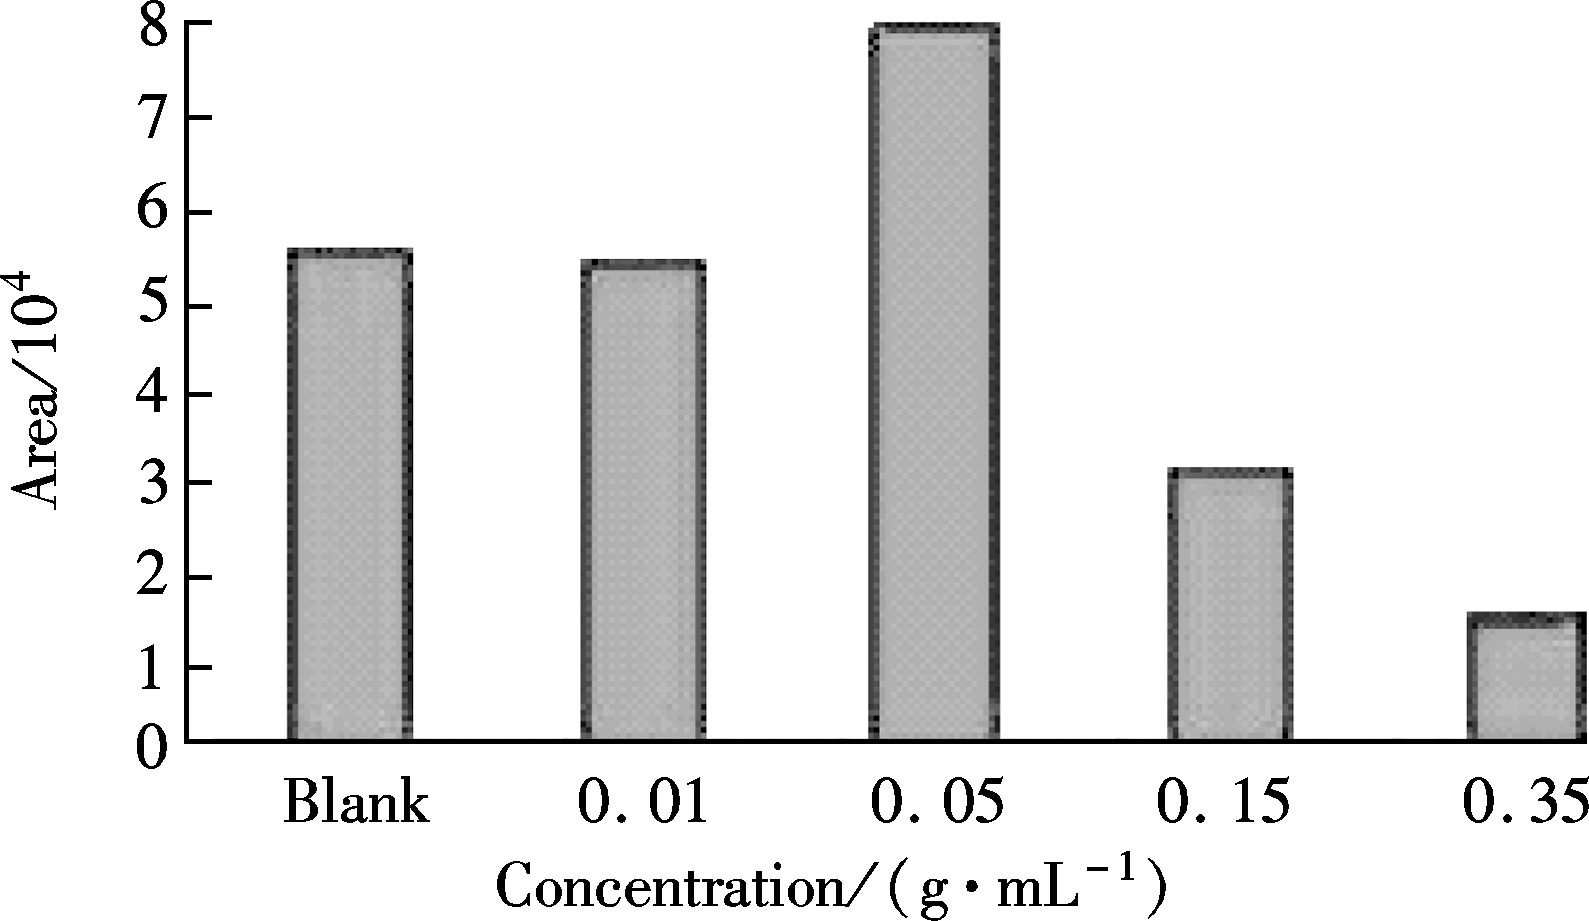
2.4 Effect of salt concentration on BBP
Usually, adding salt to the aqueous samples can decrease the solubility of organic compounds in the water phase, and heighten the partition coefficients of the targets. The salting-out effect has also been evidently observed in this work. As shown in Fig.5(a), adding 0.05 mol/L NaCl can achieve the maximum extraction efficiency.
 (a)
(a)  (b)
(b) 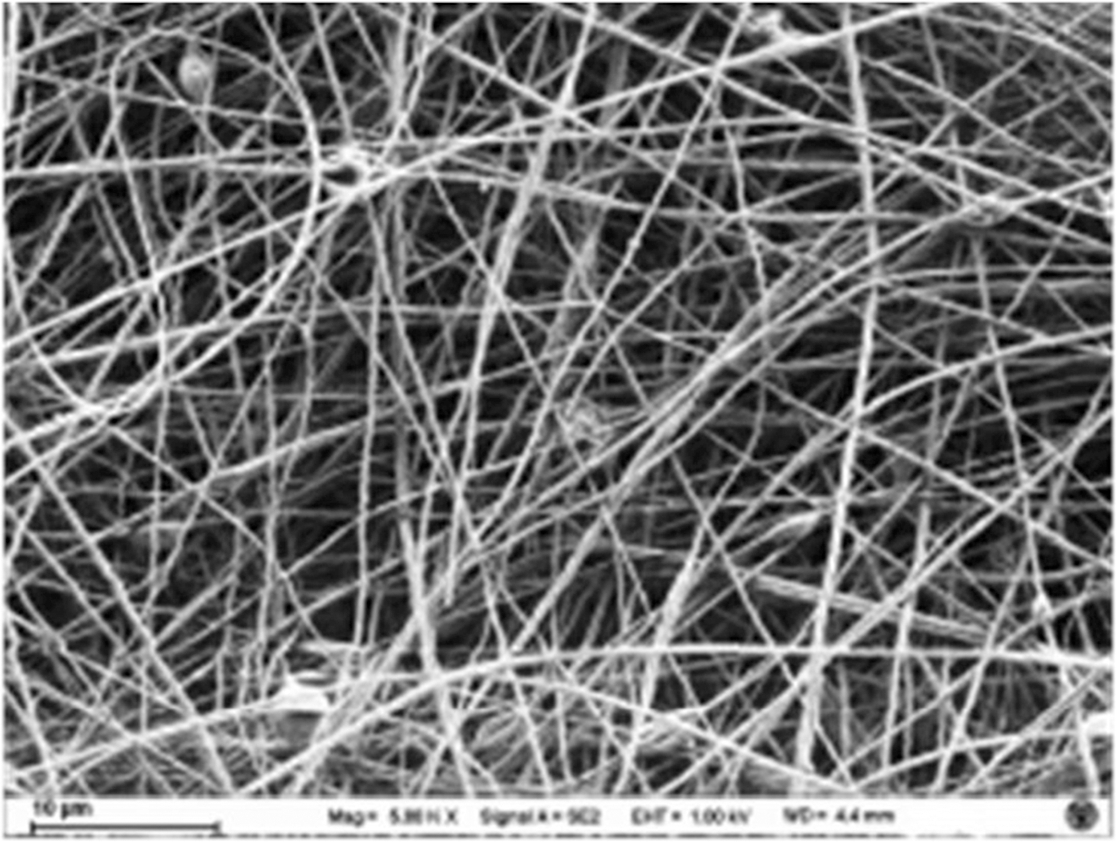 (c)
(c)

(d) 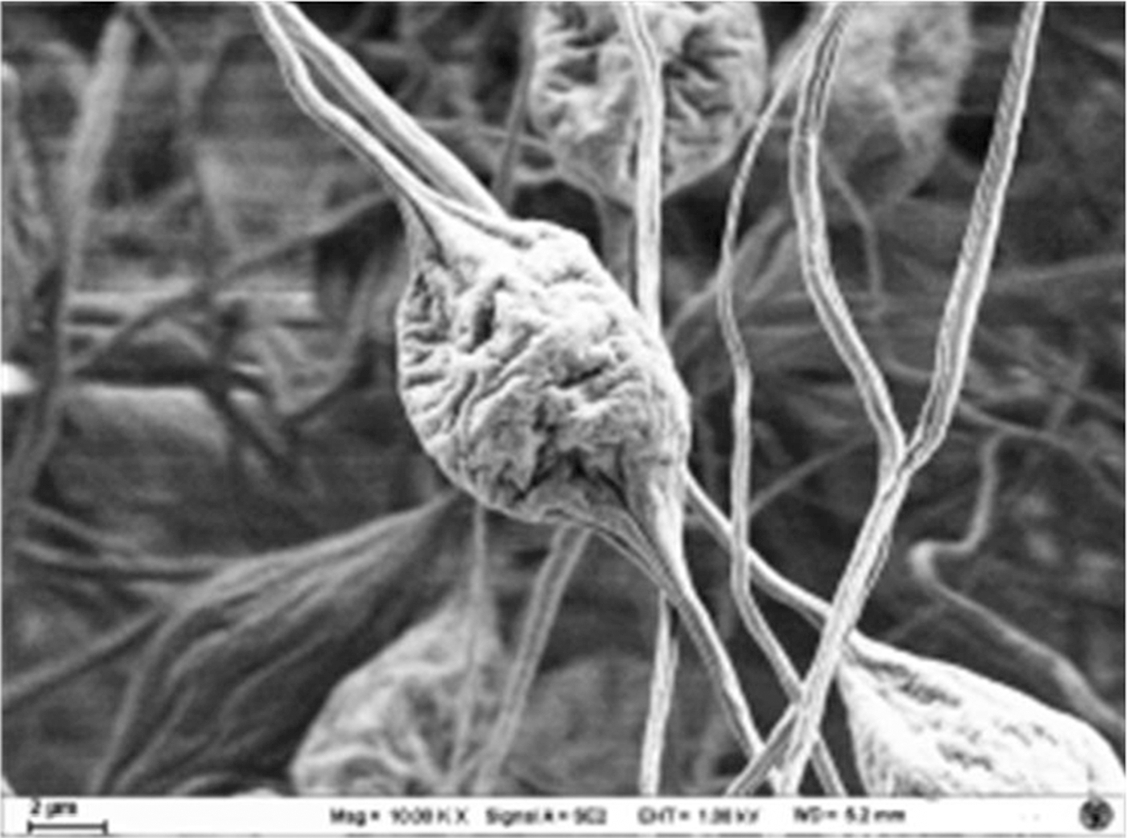 (e)
(e)  (f)
(f)
Fig.2 SEM images for PS nanofiber. (a) 8% PS; (b) 10% PS; (c) 15% PS; (d) 25% PS; (e) Grooves on beads of PS nanofiber; (f) Grooves on PS nanofiber
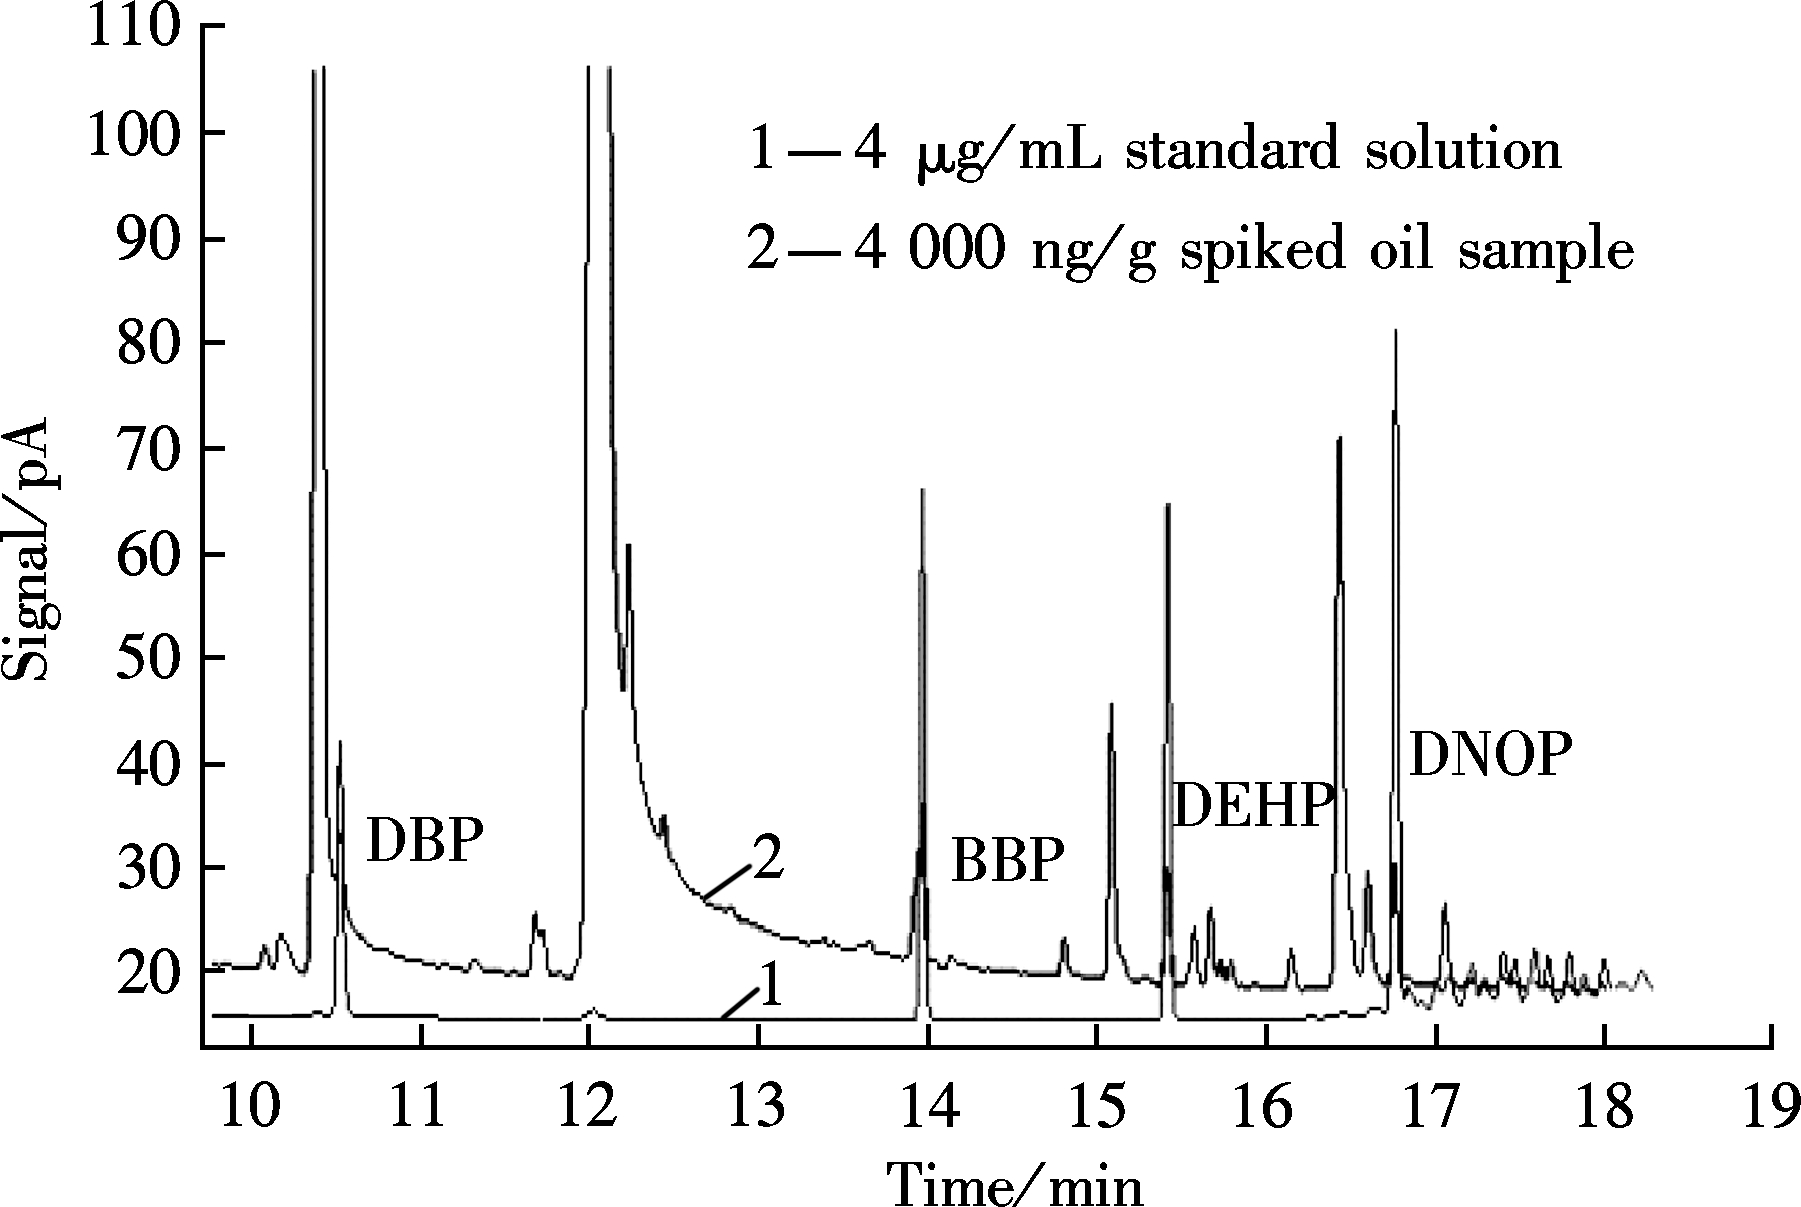
Fig.3 GC chromatogram spectrum of four PAEs
(a)
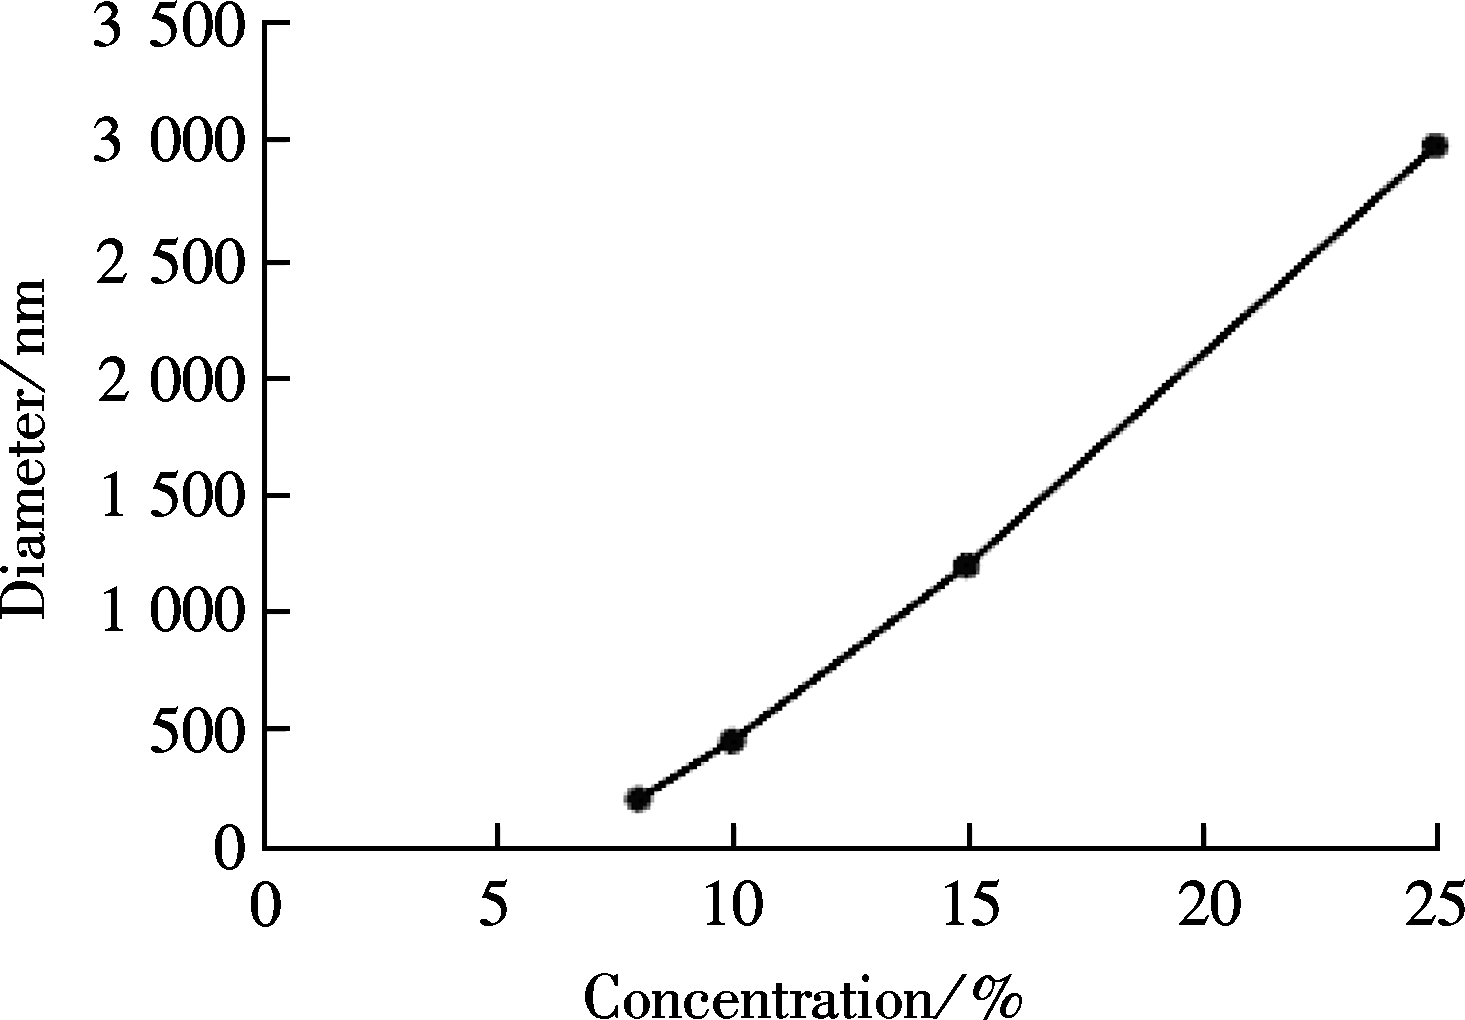
(b)Fig.4 The relationships among certain parameters. (a) Diameter vs. area; (b) Concentration vs. diameter
2.5 Effect of pH on BBP
The effect of pH in a range of 1 to 13 on the extraction of the analytes was examined. As shown in Fig.5(b), a value of 1 was assigned to the peak area at pH 7.0 for the target compound, and the rest of the areas were correlated to the values, respectively. The optimal pH was finally determined at pH 5.0, which was appropriate for ensuring the extraction of the target compounds.
(a)

(b)Fig.5 Influences of factors on the extraction efficiencies. (a) Salt concentration; (b) pH
2.6 Spiked recoveries
A spiked amount of 1 000 ng/g was added into cookie, chocolate and oil samples and the results are illustrated in Tab.1. As can be seen, each spiked sample can achieve acceptable extraction recoveries.
Tab.1 Extraction efficiencies (N=5) %

SamplesExtractionefficienciesDBPBBPDEHPDNOPCookie72.884.980.169.8Chocolate70.588.385.968.1Oil79.283.486.270.3
3.1 Linearity, limit of detection, recoveries and relative standard deviation
For the preparation of calibration curves, the standard mixture of four PAEs was diluted in series at 50 100, 500, 1 000, 4 000 ng/g for oil samples. Good linear correlation between the peak area and the concentration (50 to 4 000 ng/g) was described with a correlation coefficient greater than 0.999. The detection limits of the method were determined by successive analyses of sample extracts with decreasing amounts of PAEs until a 3∶1 signal-to-noise ratio was reached. The results are reported in Tab.2.
Tab.2 The results of method validation

TargetsSpikedamount/(ng·g-1)R2LOD/(ng·g-1)Recoveries(N=5)/%RSDs/%DBP100to40000.999050102.33.7BBP50to40000.99922599.74.1DEHP100to40000.99905096.72.9DNOP50to40000.99952598.43.4
3.2 Comparison with national standard method
From the flow charts in Fig.6, while tens of milliliter solvents were used in the national method, the method presented in this paper needed only several milliliters of solvent. Meanwhile, PAEs detected by the national standard method were complex and time-consuming with its tedious procedures.

As can be seen from Tab.3, the detection limit of the national standard method was thirty times higher than that of the method proposed in this paper. The broad linear range and lower values of RSD also indicate that the proposed method is a more convenient and environment friendly one for detecting the PAEs of oily samples.
Tab.3 Comparison with national standard method
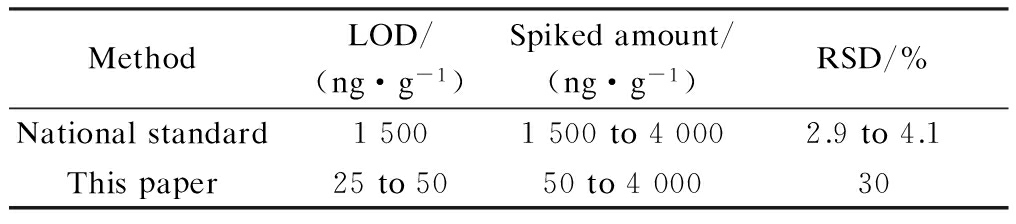
MethodLOD/(ng·g-1)Spikedamount/(ng·g-1)RSD/%Nationalstandard15001500to40002.9to4.1Thispaper25to5050to400030
In this paper, the method for pretreatment and determination of four PAEs(DBP,BBP,DEHP,DNOP)in cookie, chocolate and oil samples based on solid-phase extraction with GC-FID are presented. Under the optimized conditions, PAEs in commercial fat-containing samples can be efficiently extracted by a packed solid-phase extraction column of 5 mg polystyrene (PS) nanofibers. Compared with the national standard method, the proposed method has great superiority in aspects such as being easy and simple to handle, requiring little solvent, high recoveries, and better reproducibility. The present results indicate that the method is a convenient and environmental friendly technique for analyzing phthalate esters.
References:
[1]Du L P, Ma L J, Qiao Y, et al. Determination of phthalate esters in teas and tea infusions by gaschromatography mass spectrometry [J]. Food Chemistry, 2016, 197: 1200-1206. DOI:10.1016/j.foodchem.2015.11.082.
[2]Qureshi M S, Yusoff A R B, Wirzal M D H, et al. Methods for the determination of endocrine-disrupting phthalate esters [J]. Critical Reviews in Analytical Chemistry, 2016, 46(2): 146-159. DOI:10.1080/10408347.2015.1004157.
[3]Chen H, Wang H, Zhu R H. Analysis of phthalates in plastic food-packaging bags by thin layer chromatography [J]. Chromatography, 2006, 24(1): 69-72. (in Chinese)
[4]Lü Y K, Zhang W, Guo M M, et al. Centrifugal microextraction tube-cloud point extraction coupled with gas chromatography for simultaneous determination of six phthalate esters in mineral water [J]. Analytical Methods, 2015, 7(2): 560-565. DOI:10.1039/c4ay01705f.
[5]Li B, Wang Z W, Lin Q B, et al. Determination of polymer additives-antioxidants, ultraviolet stabilizers, plasticizers and photoinitiators in plastic food package by accelerated solvent extraction coupled with high-performance liquid chromatography [J]. Journal of Chromatographic Science, 2015, 53(6): 1026-1035. DOI:10.1093/chromsci/bmu159.
[6]Xie Q L, Sun D K, Han Y Y, et al. Determination of total phthalates in edible oils by high-performance liquidchromatography coupled with photodiode array detection[J]. J Sep Sci, 2016, 39(5): 857-863. DOI:10.1002/jssc.201501169.
[7]Xu M, Liu M H, Sun M R, et al. Magnetic solid-phase extraction of phthalate esters (PAEs) in apparel textile by core shell structured Fe3O4@silica@triblock-copolymer magnetic microspheres [J]. Talanta, 2016, 150: 125-134. DOI:10.1016/j.talanta.2015.12.027.
![]() pková G, Holadová K, Poustka J, et al. Development of a solid-phase microextraction method for the determination of phthalic acid esters in water[J]. Analytica Chimica Acta, 2002, 457(2): 211-223. DOI:10.1016/s0003-2670(02)00020-x.
pková G, Holadová K, Poustka J, et al. Development of a solid-phase microextraction method for the determination of phthalic acid esters in water[J]. Analytica Chimica Acta, 2002, 457(2): 211-223. DOI:10.1016/s0003-2670(02)00020-x.
[9]Silva M J, Malek N A, Hodge C C, et al. Improved quantitative detection of 11 urinary phthalate metabolites in humans using liquid chromatography atmospheric pressure chemical ionization tandem mass spectrometry [J]. Journal of Chromatography B, 2003, 789(2): 393-404. DOI:10.1016/s1570-0232(03)00164-8.
[10]Mitani K, Narimatsu S, Izushi F, et al. Simple and rapid analysis of endocrine disruptors in liquid medicines and intravenous injection solutions by automated in-tube solid-phase microextraction/high performance liquid chromatography [J]. Journal of Pharmaceutical Biomedical Analysis, 2003, 32(3): 469-478. DOI:10.1016/s0731-7085(03)00221-8.
[11]Russo M V, Avino P, Perugini L, et al. Fast analysis of nine PAHs in beer by ultrasound-vortex-assisted dispersive liquid-liquid micro-extraction coupled with gas chromatography-ion trap mass spectrometry [J]. RSC Advances, 2016, 6(17): 13920-13927. DOI:10.1039/C5RA24873F.
[12]General Administration of Quality Supervision, Inspection and Quarantine of the People’s Republic of China. GB/T 21911—2008 The determination of PAEs in food[S]. Beijing: China Standards Press, 2008.
[13]Yin X Y, Xu Q, Wu S Y, et al. Determination of phthalate esters in commercial milk samples using PA6 nanofibers mat-based solid-phase extraction coupled with liquid chromatography [J]. Chemical Journal of Chinese Universities, 2010, 31(3): 690-695. (in Chinese)
[14]Cao Y, Yin X Y, Zhou F Q, et al. Determination of phthalates esters in edible oil by high performance liquid chromatography with solid-membrane extraction based on electrospun nylon 6 nanofibrous membrane[J]. Chinese Journal of Analytical Chemistry, 2013, 41(12): 1837-1843. DOI:10.3724/sp.j.1096.2013.30446. (in Chinese)
[15]Wu Shuyan, Xu Qian, Chen Tianshu, et al. Determination of bisphenol A in plastic bottled drinking water by high performance liquid chromatography with solid-phase extraction based on electrospun nylon 6 nanfiberbrous membrane [J]. Chinese Journal of Analysis Chemistry, 2010, 38(4): 503-507. (in Chinese)
[16]Possi-Pezzali T, Chigome S, Rodríguez-Haralambides A, et al. Evaluation of electrospun fibers as solid-phase extraction sorbents for sample preparation in HPLC-MS/MS confirmatory doping control analysis of dexamethasone and betamethasone[J]. Analytical Methods, 2013, 5(16): 4230-4237. DOI:10.1039/c3ay40606g.
Citation:Qiu Jinli, Wang Yu, Zhou Xiaoling, et al. Determination of phthalate esters in fat-containing foods by packed nanofiber solid-phase extraction column and gas chromatography[J].Journal of Southeast University (English Edition),2016,32(3):322-326.DOI:10.3969/j.issn.1003-7985.2016.03.011.
DOI:10.3969/j.issn.1003-7985.2016.03.011
摘要:将纳米纤维固相萃取技术与气相色谱-火焰离子化检测器相结合,建立了同时检测油脂类食品中4种邻苯二甲酸酯(邻苯二甲酸二丁酯(DBP)、邻苯二甲酸丁基苄酯(BBP)、邻苯二甲酸-(2-乙基己)酯(DEHP)、邻苯二甲酸二正辛酯(DNOP))的新方法.为了获得最佳提取效率,对提取条件包括提取溶剂、吸附剂形貌、离子强度和pH进行了优化.在最佳提取条件下,DBP,BBP,DEHP和DNOP的检出限分别为50,25,50,25 ng/g,线性范围为50~4 000 ng/g.将该方法应用于多种食用油样品的检测,只需5 mg PS纳米纤维,即可实现油脂类食品中PAEs的高效萃取,回收率为96.7%~102.3%,相对标准偏差(RSD)小于5%.该方法减少了有机溶剂的使用量和样品前处理过程中复杂繁琐的程序,灵敏度高,重现性好.
关键词:邻苯二甲酸酯;纳米纤维;固相萃取;气相色谱;油脂类食品
中图分类号:O657.71
Received:2015-11-23.
Foundation item:s:The National Basic Research Program of China (973 Program) (No. 2012CB933302), the National Instrumental Research Program (No. 2014YQ06077303), the National Natural Science Foundation of China (No. 81172720, 21307086), Suzhou Science and Technology Department Foundation (No. ZXG201441).
Biographies:Qiu Jinli (1989—), female, graduate; Kang Xuejun (corresponding author), female, doctor, professor, xjkang64@163.com.