Abstract:The dynamic fracture behavior of the three-point bending beam with double deformity inclusions under impact loading is studied by using digital high-speed photography in combination with the transmission-type dynamic caustic method. The experimental results indicate that the fluctuation of crack propagation velocityv first increases and then decreases in the crack propagation process. During the process of crack propagating into the inclusion area, the fracture resistance effect of the circular inclusion is the most significant and the effects of triangular and square inclusions are less obvious. The stress intensity factor near the crack tip increases during the propagation process and reaches its maximum value when the crack tip is close to the inclusions. The crack tip’s dynamic stress intensity factor (DSIF) decreases when the crack exceeds the middle area of the double inclusions. These results provide an experimental basis and scientific foundation to strengthen the evaluation and fracture analysis of the structure containing deformity inclusions.
Key words:dynamic caustics; deformity inclusion; dynamic stress intensity factor; crack propagation velocity
With the widespread applications of particulate composite materials in engineering projects, the influence that different deformity inclusions pose on the mechanics of fracture in structures has become an important research subject[1-6]. It is crucial for structure damage analysis and lifespan prediction to determine the effects that different inclusions have on primary structure crack damage, initiation, development and some other mechanical behaviors.
A research approach that combines high-speed photography with the caustic method is effective for studying the dynamic fracture behaviors of both materials and structures[7]. Manogg[8] first introduced the caustic method to solve the stress singularity. Rosakis[9] established a complete theoretical system of dynamic caustics based on steady crack growth assumption and introduced the approach for the research of dynamic crack growth. Jajam et al.[10] performed experimental studies on the dynamic crack growth behavior of specimens containing rigid and flexible inclusions. Papadopoulos et al.[11] studies the fracture behavior of specimens containing single/double inclusions of rubber-PMMA materials. Yao et al.[12-15] systematically studied the interaction between multi cracks of three-point-bend beam specimens by using the multiple spark high-speed photography system and caustic method. Gong et al.[16] applied the dynamic caustic method to the dynamic fracture research of orthotropic composite materials. However, the dynamic fracture behaviors of epoxy resin material containing double inclusions in different shapes have rarely been studied by the caustic experiments until now.
This paper utilizes the dynamic caustic method to perform dynamic fracture experiments on epoxy resin three-point bending beam specimens with double PMMA inclusions in shapes of a circle, triangle and square. The images of the caustic spots at the crack tips, crack growth velocities and dynamic stress intensity factors (DSIF) ![]() are obtained during the process of crack development. The research results can provide an experimental basis for a strength analysis of structures with deformity inclusions.
are obtained during the process of crack development. The research results can provide an experimental basis for a strength analysis of structures with deformity inclusions.
1.1 Specimens and material parameters
The epoxy resin specimens with 150 mm×40 mm×5 mm in length×width×thickness containing double PMMA inclusions were adopted in the experiments. The models of each specimen are shown in Fig.1. The shapes of the double inclusions are an equilateral triangle with 10 mm in side length, circle with a radius of 5 mm and square with 10 mm in side length, respectively. The double inclusions, of which the distance is 30 mm, are symmetrical in the center of the specimen’s long side. A pre-existing crack with 5 mm in length and 0.5 mm in width was perpendicularly situated at the bottom edge of specimen. Five repetitive tests were conducted for each type of the specimens. The dynamic mechanical parameters of materials are given in Tab.1[17].

Fig.1 Models of specimens with different inclusions (unit: mm)
Tab.1 The dynamic mechanical parameters of materials
%
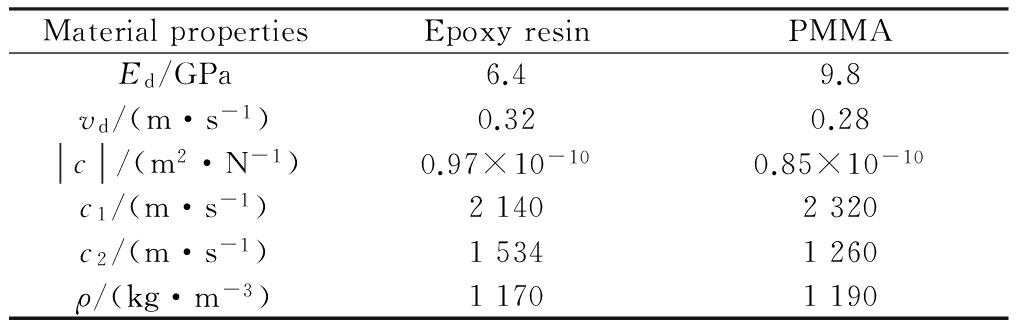
MaterialpropertiesEpoxyresinPMMAEd/GPa6.49.8vd/(m·s-1)0.320.28c/(m2·N-1)0.97×10-100.85×10-10c1/(m·s-1)21402320c2/(m·s-1)15341260ρ/(kg·m-3)11701190
1.2 Optical experimental facilities
The dynamic three-point bending experiments were performed by using the low-velocity impact as the loading mode and the digital laser dynamic caustics experimental system, which includes a laser transmitter, impact system, a digital high-speed camera (Fastcam-SA5-16G, Photron Company, Japan) and a computer. The schematics of the experimental setup is shown in Fig.2 and the impact system is shown in Fig.3. In this study, the photograph resolution is 128×64 pixels; the frame rate of the high-speed camera is set to be 3×10⁵ frame/s; the pixel-to-length ratio of the images is 1.8 and laser emission power is 50 mW. Specimens were placed in the impact system, and the hammer was 1 kg in weight and situated 500 mm away from the upper surface of specimen perpendicularly.

Fig.2 Experimental setup
2.1 Distortion parameter β of caustic spot
Caustic spots of specimens have deformed during the process of the dynamic fracture. Distortion parameter β is
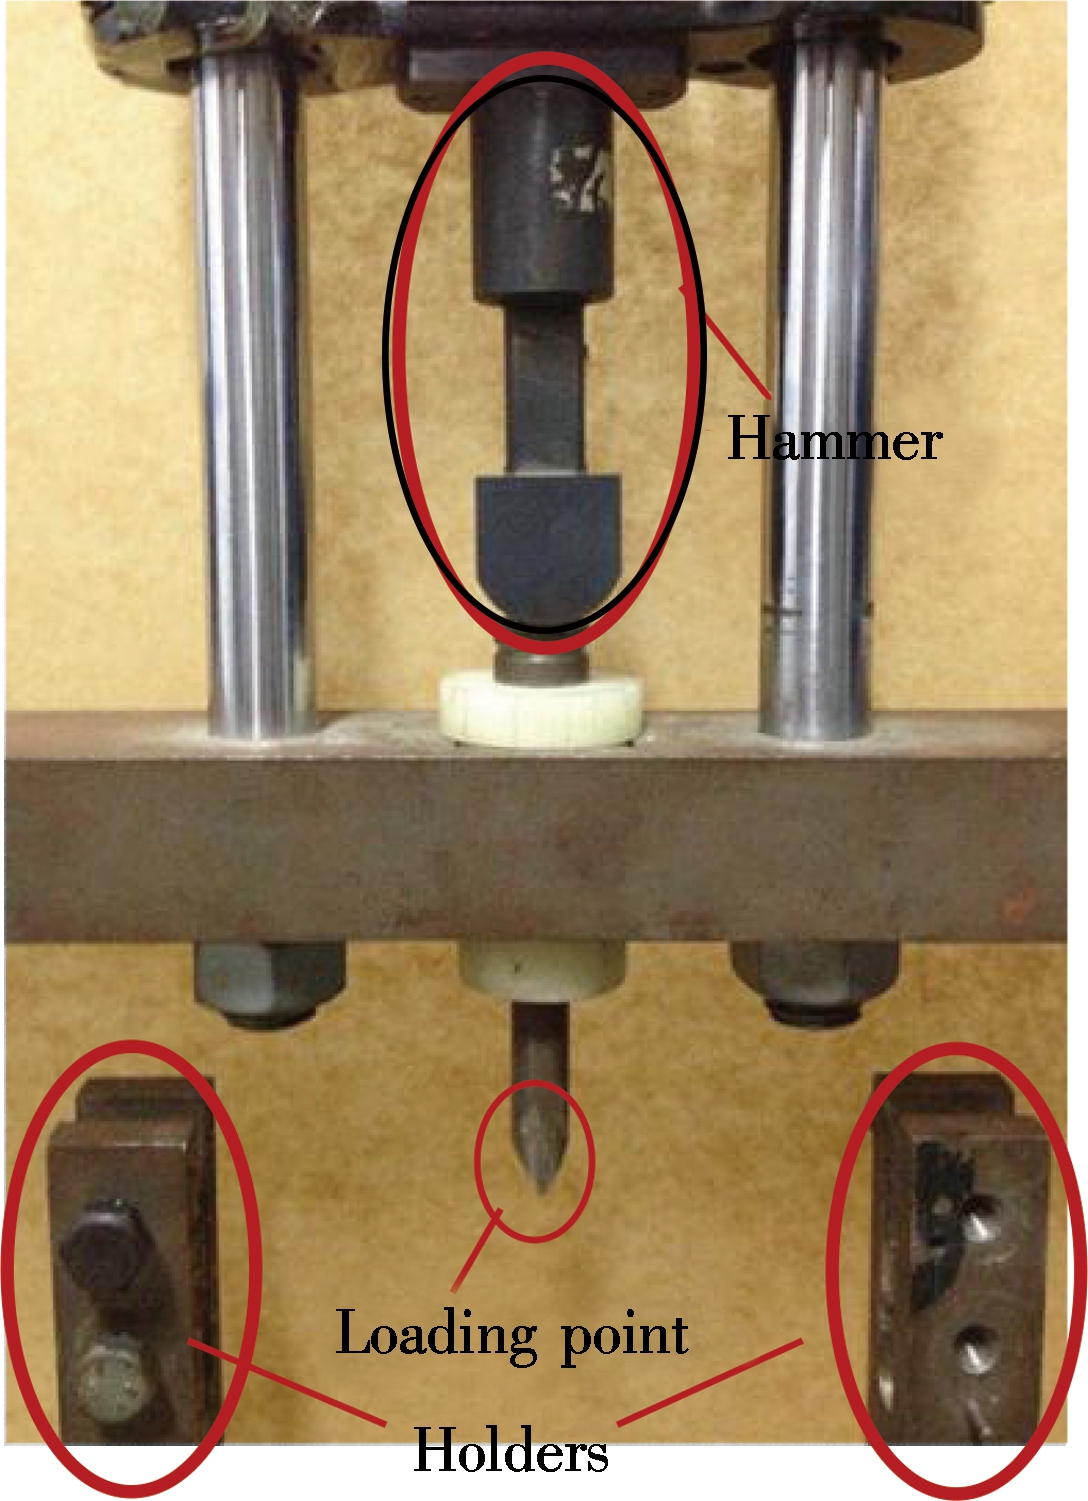
Fig.3 Impacting system
introduced for the purpose of revealing the evolution of the formation of the caustic spot with respect to time and it can be expressed as
β=d0/d
(1)
where d0 represents the vertical size of the caustic spot and d represents the horizontal size of caustic spot (see Fig.4). We define the deformity mode as A-mode when β<1 and B-mode when β>1.
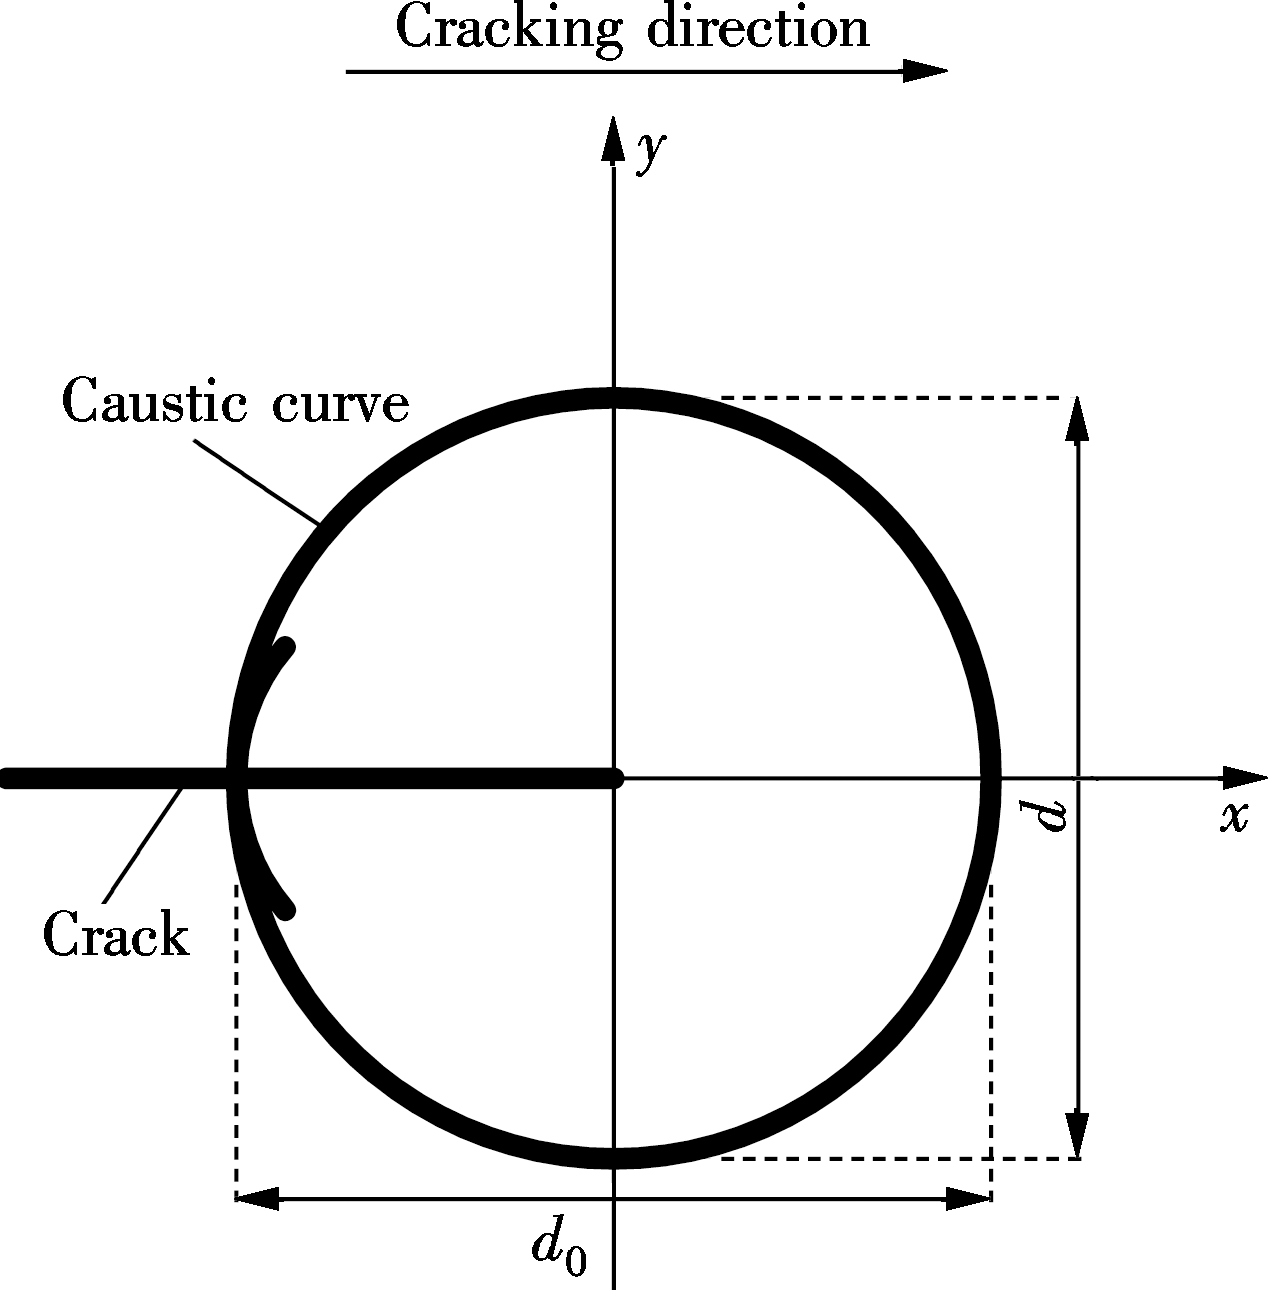
Fig.4 Illustration for d0 and d of caustic spots
2.2 Crack propagation velocity v
Crack propagation distance l can be obtained by the positions of caustic spots at different time. Based on the data analysis method introduced by Takahashi et al.[18], the nine-order fitting polynomial l is a function of time t and it can be written as
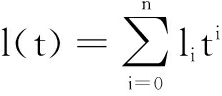
(2)
where li is the parameter acquired with the least square method. The crack propagation velocity is obtained by taking the derivative of l(t) with respect to t.
2.3 Dynamic stress intensity factor ![]()
This is based on the assumptions that the angular distribution functions of the stress field of the crack tip are free from the influence of fiber bundles when they are out of the crack tip’s K-dominant zone. For linear elasticity and isotropy materials under plane stress situations, the distribution functions of I-mode crack tip’s stress field σx, σy, σxy can be expressed as[19]

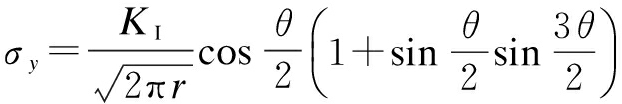
(3)

For I-mode crack propagation, the relationship between the dynamic stress intensity factor ![]() and the characteristic size of caustic spot D can be given as[12]
and the characteristic size of caustic spot D can be given as[12]
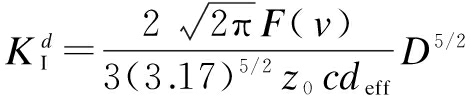
(4)
where z0 represents the distance between the specimen surface and the reference surface, z0=900 mm in this paper; c is the material stress-optical constant; deff is the effective thickness of the specimen, deff=5 mm in this paper; F(v) is the correction factor of the crack propagation velocity and it can be expressed as

(5)
where ![]() =1-(v/ci)2,i=1,2; c1and c2represent the longitudinal wave and the shear wave velocity, respectively. When the crack begins to propagate, F(v) is constantly less than 1; otherwise, v=0,F(v)=1. However, the value of F(v) is always 1 in data processing.
=1-(v/ci)2,i=1,2; c1and c2represent the longitudinal wave and the shear wave velocity, respectively. When the crack begins to propagate, F(v) is constantly less than 1; otherwise, v=0,F(v)=1. However, the value of F(v) is always 1 in data processing.
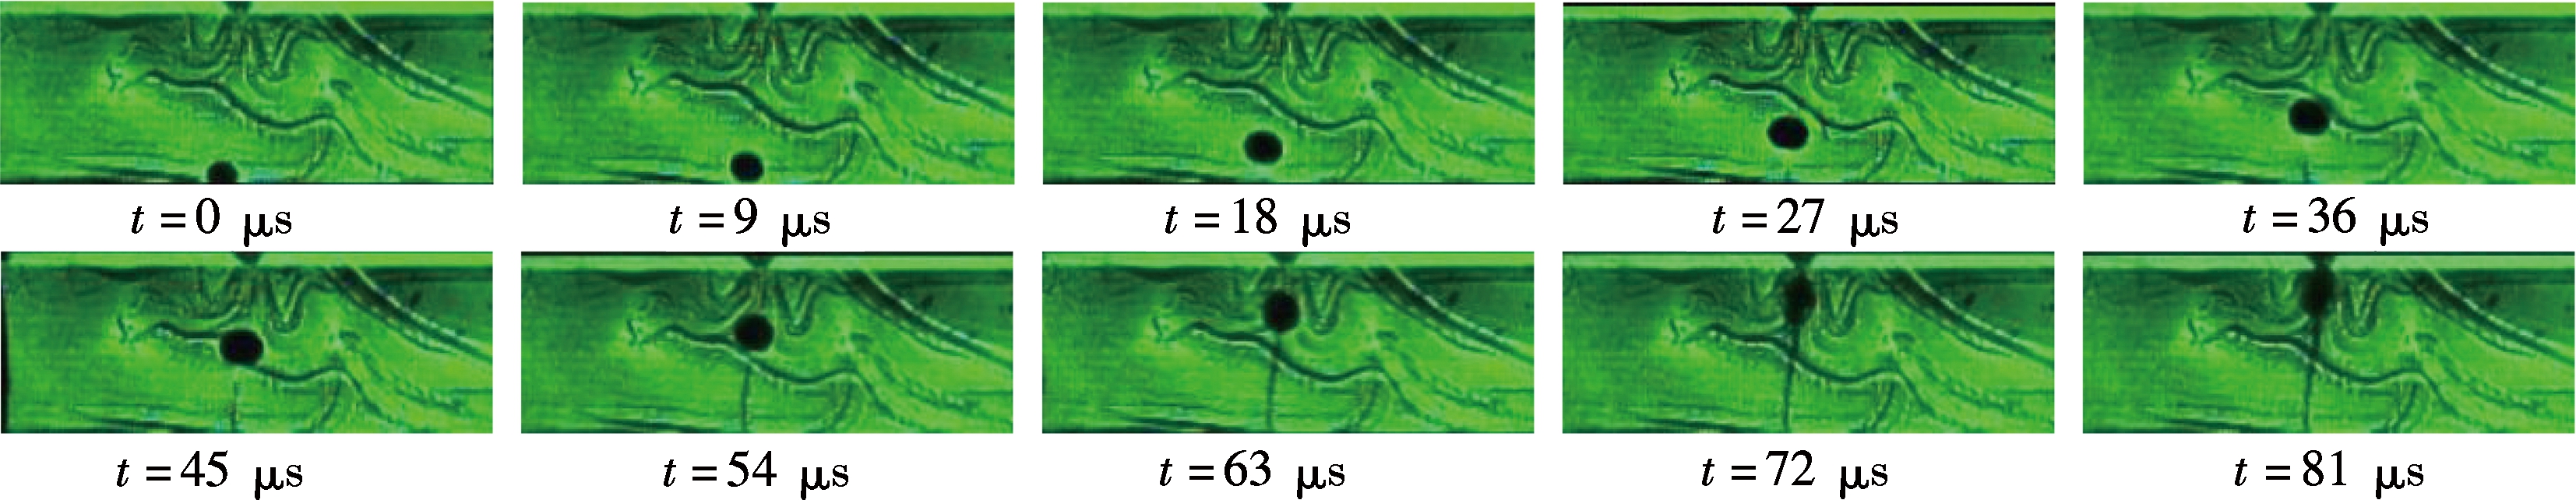
The caustic spots of double deformity inclusion specimens (triangle, circle and square) under a low-velocity impact loading are given in Fig.5.
As shown in Fig.5, the trends of variations of the caustic spots at the crack tips in specimens with three different deformity inclusions are somewhat similar. At the beginning of the crack initiation, the caustic spots were suborbicular, since the inclusions were at some distance from the crack tips and had little influence on the caustic spots. With the development of the cracks, the horizontal size of spot distinctly became greater than the vertical and this differential continuously grew, causing the caustic spots to show A-mode deformity. When the crack was passing through the central area of the two inclusions, the horizontal and vertical sizes steadily became equal and the caustic spot was changed into a circle from an elliptical shape. As the crack propagated away from the central area, B-mode deformity formed at the caustic spot because its vertical size was much greater and the shape of the spot became elliptical once again. This distortion became much more serious as the crack kept propagating from the inclusions until the specimen completely ruptured in the end. The whole procedure of variations developing at

(a)
(b)

(c)Fig.5 Dynamic caustics patterns of the specimens with different deformity inclusions. (a) With triangular inclusions; (b) With circular inclusions; (c) With square inclusions
caustic spots can be separated into four periods. They are circles, A-mode deformity, ellipticals, and B-mode deformity, respectively. Caustic spots are clearly influenced by the inclusions.
The variations of horizontal size d, vertical size d0 and distortion parameter β against time during the fracture process of specimens are shown in Fig.6. β is approximately equal to 1 at the start of crack initiation and sizes in horizontal and vertical directions are similar. β value begins to decrease with the development of the crack growth. Simultaneously, the value appears to have regular fluctuation, mainly because of the interactions between stress waves, which are formed around the crack tips and the reflected wave caused by the edge of specimen. The β value of the specimen with triangular inclusions and that with square ones reached the minimum 36 μs after crack initiation, while the β value of the specimen with circular inclusions took 45 μs, which was comparatively slower than the others, to reach the minimum after the initiation. Subsequently, the value of β gradually increased and went over 1 finally. When the crack was running through the specimen, all the β values witnessed a decrease, which illustrated that the influence that inclusions have on the caustic spots became weaker as the distance between them increased gradually.
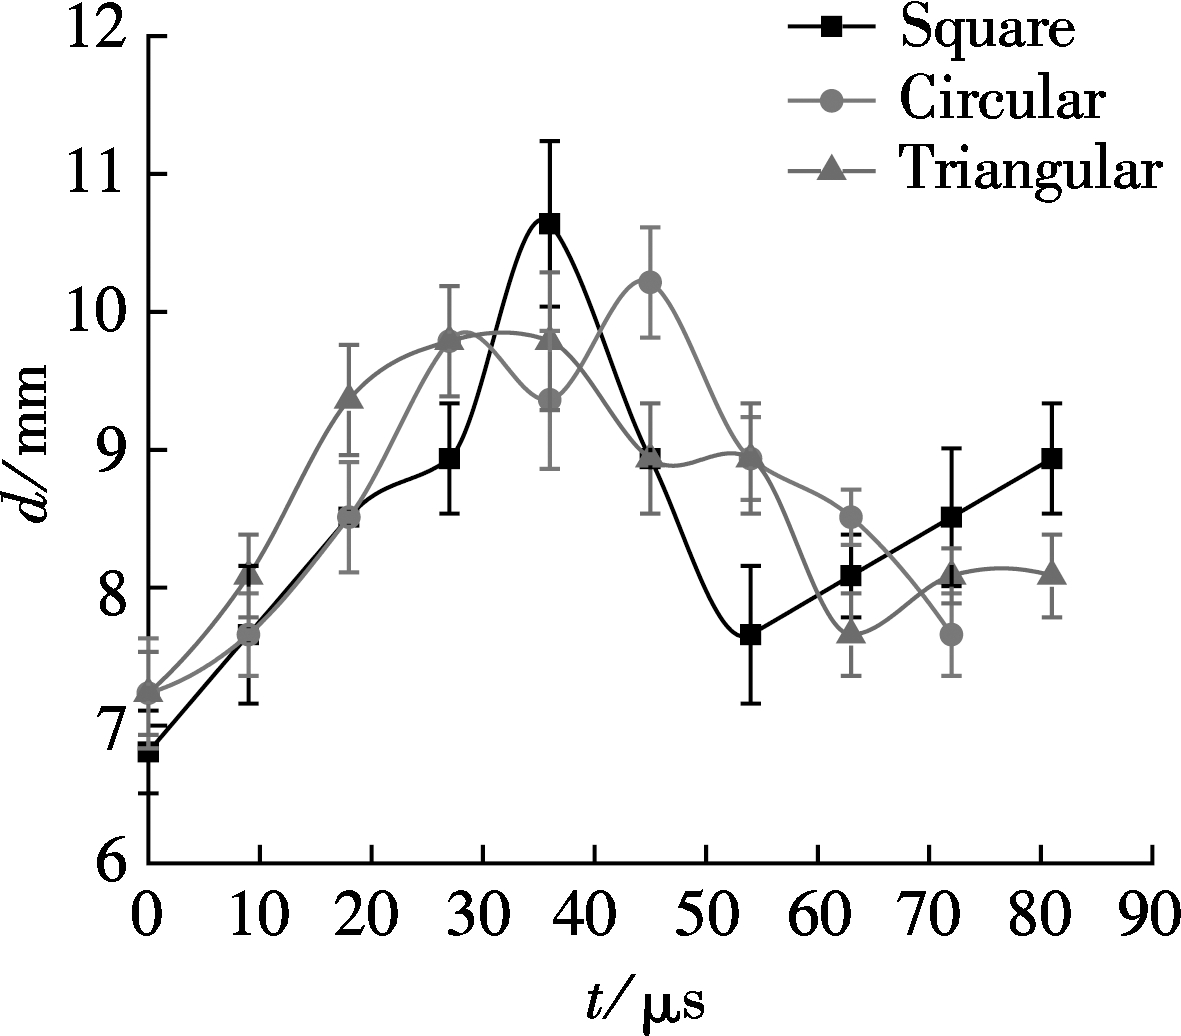
(a) d vs. t  (b) d0 vs. t
  (c) β vs. tFig.6 Curves for the specimens with deformity inclusions. (a) d vs. t; (b) d0 vs. t; (c) β vs. t
Fig.7 shows the variation curves of crack propagation velocities over time. Generally speaking, these three v-t curves have similar variation trend. Velocity increased with fluctuation to the maximum value when the crack arrived at the adjacent area of inclusions (dashed rectangle area in Fig.7). This phenomenon can be explained by the inclusions being situated beside the cracking path and the resistance effect being not strong enough to reduce the propagation velocity significantly. As a result, the velocity could still reach the maximum value because of the interaction of stress waves near the inclusion area. However, as the crack developed away from the inclusions positions, the velocity began to decline until the propagation went through the specimen. During this process, the velocity of the specimen with circular inclusions is slower than the others, which can demonstrate that the circular inclusions have more profound influence on the growing crack while the effect is weaker in the cases of triangular and square inclusions. Due to the disturbance from stress waves on the crack tip, the propagation velocity represents the feature of fluctuation.
Fig.7 Curves of crack propagation velocity vs. time
Fig.8 indicates that the curves of the dynamic stress intensity factor vary with time. Before the crack initiation, kinetic energy generated by the hammer’s impact loading was converted into strain energy and accumulated around the crack tip. The crack began to initiate at the moment when the stored energy reached the maximum threshold value. Then the DSIF decreased as a result of the steady
Fig.8 Evolution of dynamic stress intensity factors of propagation cracks vs. time
release of energy after initiation. 9 μs later, variation trends of three different specimens appeared to fluctuate, since the resistance of the double inclusions raised the threshold value of DSIF and ![]() had to attain a higher level for crack development. During this process, when t=36 μs, the DSIFs of specimens with square inclusions and circular inclusions reached the maximum values of 3.82 and 3.92 MPa·m1/2, respectively. However, the DSIF of the specimen with triangular inclusions reached the maximum value of 3.91 MPa·m1/2 at t=45 μs, which was slightly slower than other specimens. The characteristic sizes of the caustic spots kept declining until the specimen completely ruptured.
had to attain a higher level for crack development. During this process, when t=36 μs, the DSIFs of specimens with square inclusions and circular inclusions reached the maximum values of 3.82 and 3.92 MPa·m1/2, respectively. However, the DSIF of the specimen with triangular inclusions reached the maximum value of 3.91 MPa·m1/2 at t=45 μs, which was slightly slower than other specimens. The characteristic sizes of the caustic spots kept declining until the specimen completely ruptured.
1) During the process of the specimen’s crack propagation, the variations of the sizes of caustic spots can be expressed as follows. Before the crack initiation, the shape of caustic spots is approximately circle; at the earlier stage of initiation, caustic spots form A-mode deformity; with the crack propagating away from the inclusions, caustic spots form B-mode deformity.
2) Crack propagation velocity fluctuated increasingly at first and then decreased. The resistance of double circular inclusions to crack growth is greater than the others.
3) Dynamic stress intensity factor underwent the process of increasing fluctuation to reach the maximum values of 3.82, 3.92 and 3.91 MPa·m1/2 for square, circular and triangular inclusions respectively when the crack first formed at inclusions’ area, and finally decreased with fluctuation until specimen completely ruptured.
4) A fluctuation phenomenon appears along with the variations of sizes of caustic spots, crack propagation velocities and DSIFs due to the interaction of stress wave formed around the crack tip and reflection wave generated by the bottom surface of the specimen.
References:
[1]Atkinson C. The interaction between a crack and an inclusion[J]. International Journal of Engineering Science, 1972, 10(2): 127-136. DOI:10.1016/0020-7225(72)90011-0.
[2]Erdogan F, Gupta G D, Ratwani M. Interaction between a circular inclusion and an arbitrarily oriented crack[J]. Journal of Applied Mechanics, 1974, 41(4): 1007-1013. DOI:10.1115/1.3423424.
[3]Hu K X, Chandra A. Interactions among cracks and rigid lines near a free surface[J]. International Journal of Solids and Structures, 1993, 30(14): 1919-1937. DOI:10.1016/0020-7683(93)90225-v.
[4]Cheeseman B A, Santare M H. The interaction of a curved crack with a circular elastic inclusion[J]. International Journal of Fracture, 2000, 103(3): 259-277.
[5]Hwu C, Liang Y K, Yen W J. Interactions between inclusions and various types of cracks[J]. International Journal of Fracture, 1995, 73(4): 301-323. DOI:10.1007/bf00027272.
[6]Zhang M H, Tang R J. Interaction between crack and elastic inclusion[J]. Applied Mathematics and Mechanics,1995,16(4):307-318. DOI:10.1007/bf02456943.
[7]Yao X F, Xu W. Recent application of caustics on experimental dynamic fracture studies[J]. Fatigue & Fracture of Engineering Materials & Structures, 2011, 34(6): 448-459. DOI:10.1111/j.1460-2695.2010.01539.x.
[8]Manogg P. Schattenoptische messung der spezifischen bruchenergie wahrend des bruchvorgangs bei plexiglas[J]. Proc Int Con Physics Non-Cristalline Solids. Delft, The Netherlands, 1964: 481-490.
[9]Rosakis A J. On the uniqueness of representation of the stress field of plane polygonal dislocation loops[J]. Scripta Metallurgica, 1980, 14(11): 1261-1265. DOI:10.1016/0036-9748(80)90268-9.
[10]Jajam K C, Tippur H V. Role of inclusion stiffness and interfacial strength on dynamic matrix crack growth: An experimental study[J]. International Journal of Solids and Structures, 2012, 49(9): 1127-1146. DOI:10.1016/j.ijsolstr.2012.01.009.
[11]Papadopoulos G A, Papanicolaou G C. Dynamic crack propagation in rubber-modified composite models[J]. Journal of Materials Science, 1988, 23(10): 3421-3434. DOI:10.1007/bf00540474.
[12]Yao X F, Jin G C, Arakawa K, et al. Experimental studies on dynamic fracture behavior of thin plates with parallel single edge cracks[J]. Polymer Testing, 2002, 21(8): 933-940. DOI:10.1016/s0142-9418(02)00037-5.
[13]Yao X F, Xu W, Xu M Q, et al. Experimental study of dynamic fracture behavior of PMMA with overlapping offset-parallel cracks[J]. Polymer Testing, 2003, 22(6): 663-670. DOI:10.1016/s0142-9418(02)00173-3.
[14]Yao X F, Xu W, Bai S L, et al. Caustics analysis of the crack initiation and propagation of graded materials[J]. Composites Science and Technology, 2008,68(3/4):953-962. DOI:10.1016/j.compscitech.2007.08.007.
[15]Yao X F, Xu W, Arakawa K, et al. Dynamic optical visualization on the interaction between propagating crack and stationary crack[J]. Optics and Lasers in Engineering, 2005,43(2):195-207. DOI:10.1016/j.optlaseng.2004.06.003.
[16]Gong K, Li Z. Caustics method in dynamic fracture problem of orthotropic materials[J]. Optics and Lasers in Engineering, 2008, 46(8): 614-619. DOI:10.1016/j.optlaseng.2008.03.019.
[17]Yue Z W, Guo Y, Wang X, et al. Influence of empty hole shape on directional fracture controlled blasting of rock [J]. Rock and Soil Mechanics, 2016, 37(2): 376-382.
[18]Takahashi K, Arakawa K. Dependence of crack acceleration on the dynamic stress-intensity factor in polymers[J]. Experimental Mechanics, 1987, 27(2):195-199. DOI:10.1007/bf02319474.
[19]Ma Y J, Yao X F, Wang D. Experimental investigation on mechanical properties of CNT film using digital speckle correlation method [J]. Optics and Lasers in Engineering, 2012,50(11):1575-1581. DOI:10.1016/j.optlaseng.2012.05.023.
Citation:Yue Zhongwen, Song Yao, Han Ruijie,et al. Experimental study on dynamic fracture behavior of three-point bending beam with double deformity inclusions[J].Journal of Southeast University (English Edition),2016,32(3):333-338.DOI:10.3969/j.issn.1003-7985.2016.03.013.
DOI:10.3969/j.issn.1003-7985.2016.03.013
摘要:利用数字式高速摄影与透射式动态焦散线光学技术相结合的方法,对含异型双夹杂三点弯曲梁在冲击载荷作用下的动态断裂力学行为进行了研究.实验研究结果表明:裂纹扩展过程中,裂纹扩展速度v经历了波动性增大再减小的过程;在裂纹扩展至夹杂中间区域过程中,圆形双夹杂对裂纹的阻裂作用最强,三角形双夹杂和正方形双夹杂的阻裂作用较弱;裂纹在距离夹杂较远处向夹杂扩展过程中,裂尖应力强度因子波动性增加;当裂尖靠近夹杂时,其裂尖应力强度因子达到最大值.当裂纹扩展超出夹杂所对应中间区域,裂尖应力强度因子出现波动性降低趋势.研究成果为含异型夹杂结构的强度评估及断裂分析提供实验依据及科学基础.
关键词:动态焦散线;异型双夹杂;动态应力强度因子;裂纹扩展速度
中图分类号:O346.1
Received:2015-12-06.
Foundation item:s:The National Basic Research Program of China (973 Program) (No.2011CB606105), the National Natural Science Foundation of China (No.51374210, 51134025).
Biography:Yue Zhongwen (1975—), male, doctor, associate professor, zwyue75@163.com.