Analysis on fatigue cracking for asphalt surface layers based on field cores
Analysis on fatigue cracking for asphalt surface layers based on field cores
Li Qiang Yang Huanhuan Zhang Shuai Ma Xiang
(School of Civil Engineering, Nanjing Forestry University, Nanjing 210037, China)
Abstract:Field cores from typical cracking locations were tested by the semi-circular bending test and the digital image correlation method to evaluate the anti-fatigue performance of different asphalt pavements. Test results were analyzed by different fatigue models. Causes of fatigue cracking for different pavement sections were determined by extraction and sieving test results. It is found that the ranking (from high to low) in terms of the anti-fatigue performance for field cores is the crumb rubber modified asphalt mixture, dense-graded modified asphalt mixture, continuous graded asphalt treated base, gap-graded stone asphalt concrete, and half open-graded asphalt macadam. Compared with the half open-graded asphalt macadam, the fatigue life of the crumb rubber modified asphalt mixture improves by 2.0 to 3.8 times. Fatigue lives of different mixtures and distress ratios of actual pavements can be accurately predicted by the dissipated energy density ratio. Causes of fatigue cracking vary with mixture types.
The anti-fatigue performance of asphalt mixtures can be tested by different methods. The trapezoidal cantilever beam bending test is usually used in Europe while in the USA the three-point or four-point beam bending test is typically used. The direct tension test, indirect tension (IDT) test, semi-circular bending (SCB) test, and axial tension-compression test are also widely accepted[1-5]. The laboratory-made specimen is mainly used for testing. However, there are great differences between the laboratory-made specimen and actual pavement, such as air void content, quality homogeneity, mixing and compaction methods. It means that the laboratory-made specimen cannot accurately simulate material properties in the actual pavement. Field coring is simple and has low cost. It is an effective tool to solve the above problems. A series of existing studies[6-8] also confirmed that the laboratory-made and field-cored specimens showed different rutting resistance, cracking resistance, and moisture sensitivity. Therefore, in this study, the laboratory fatigue test was conducted on field cores from typical cracking locations to evaluate different pavement construction techniques. The anti-fatigue performance and cracking causes of various asphalt surface layers were also analyzed.
1 Field Core Information
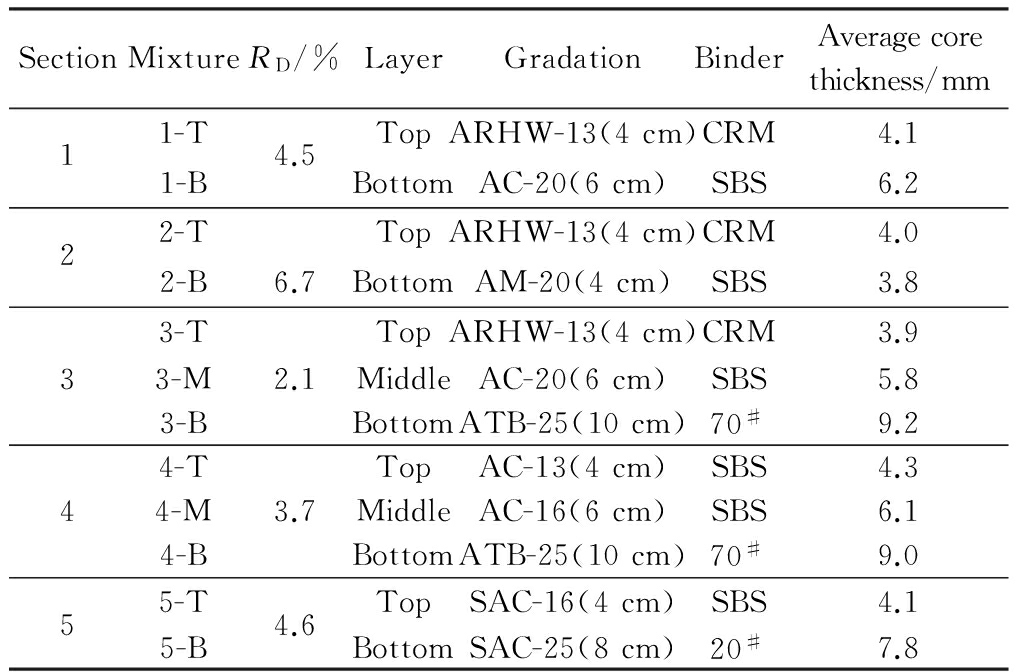
A highway constructed in the north of China was selected. A field survey was operated in pavement sections at and below the “medium” class (pavement distress ratio RD>2.0). Field cores were obtained from representative fatigue cracking locations of different sections under similar environment and traffic conditions. In each section, two entire cores with the diameter of 150 mm including the asphalt surface and base layers were taken cross the crack for determining cracking types by visual observation. Eight cores with the diameter of 150 mm only including the asphalt surface layer were taken in the vicinity of cracks for the fatigue test. The information of the sections and cores is provided in Tab.1. In the table, ARHW represents the crumb rubber modified (CRM) mixture. AC represents the dense-graded asphalt mixtures. AM represents the half open-graded asphalt macadam. ATB represents the asphalt treated base. SAC represents the stone asphalt concrete. The number behind the mix type repre-
Tab.1 Basic information of field sections and cores
sents the nominal maximum aggregate size (NMAS). SBS represents the Styrene-Butadiene-Styrene modified asphalt binder. 20# and 70#, respectively, represent asphalt binders with the penetration of 2 mm and 7 mm.
2 SCB Test
2.1 Test method
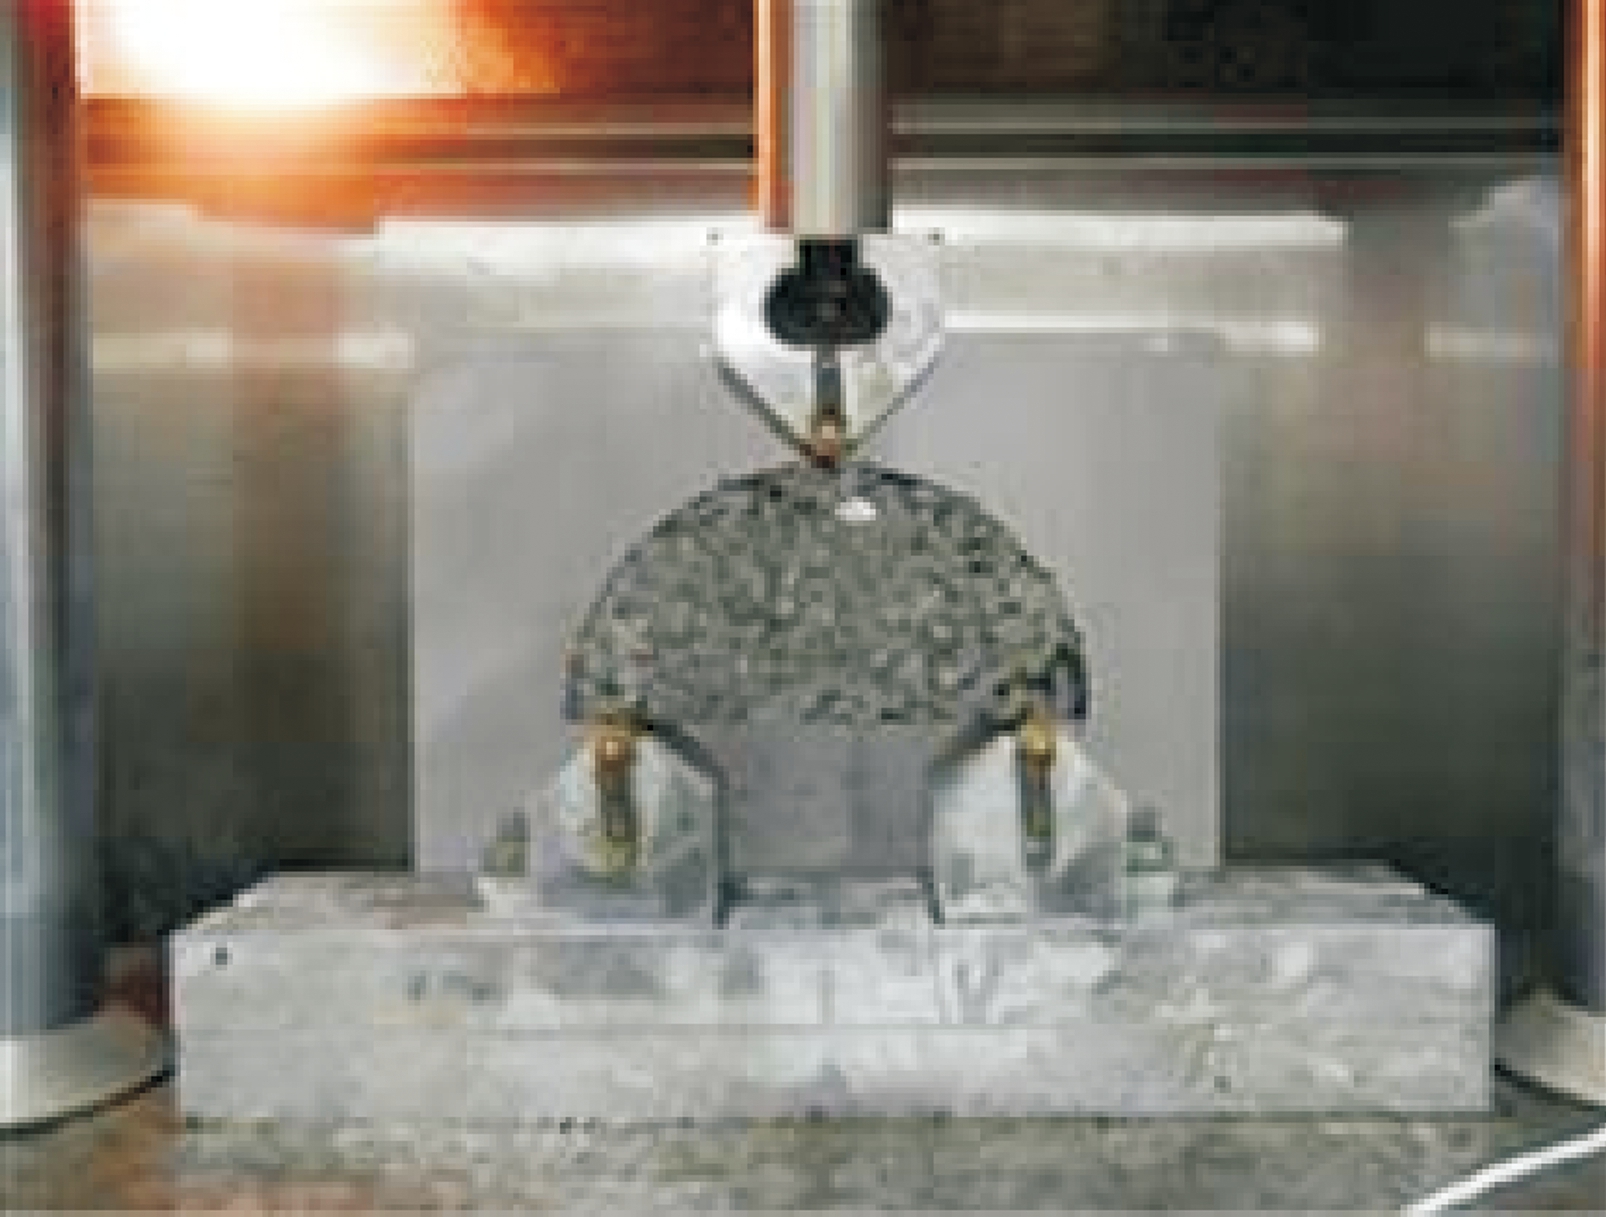
The SCB test was employed to evaluate the anti-fatigue performance of field cores. The entire cores of the asphalt surface layer with the diameter of 150 mm were first cut to obtain specimens with the thickness of 40 mm for each asphalt sublayer. Then, each cylindrical specimen was radially cut into two semi-circular specimens. The round bar with the diameter of 5 mm was loaded on the top of the specimen. The distance between two pivot points was 12 cm. The test setup is shown in Fig.1. The SCB strength and fatigue test were respectively performed at the temperature of 15 ℃. In the strength test, the loading rate was 50 mm/min. A haversine axial loading pulse at the frequency of 10 Hz was applied in the stress controlled fatigue test. Three levels of the stress ratio RS (0.2, 0.3, and 0.4) were tested for each mixture.
Fig.1 SCB test setup
2.2 Digital image correlation
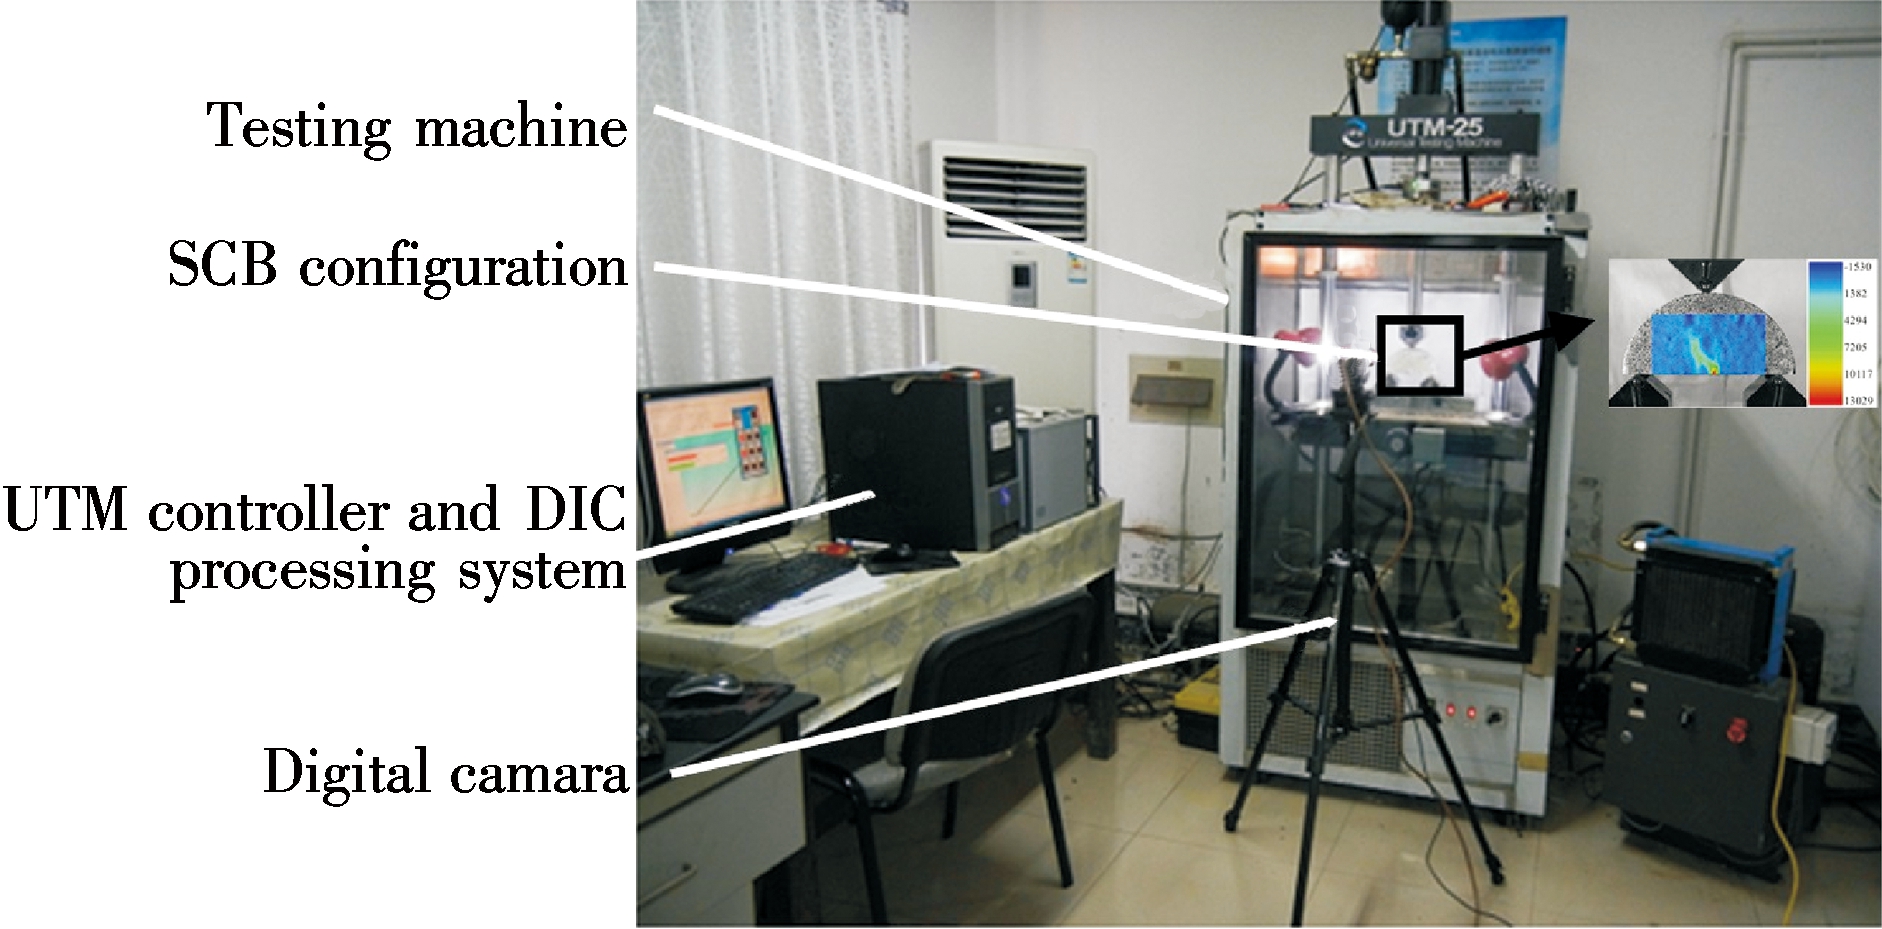
The digital image correlation (DIC) technique was employed to measure the strain field of the specimen surface during the SCB test. It is a non-contact and high precision measurement method using the photoelectric couple element imaging and automatic processing[9]. The testing system is composed of loading equipment, an environment chamber, a SCB test device, an image capturing system, and a DIC digital image acquisition and analysis system, as shown in Fig.2. The accuracy of this system has been validated elsewhere[10].
3 Test Results
3.1 SCB strength test
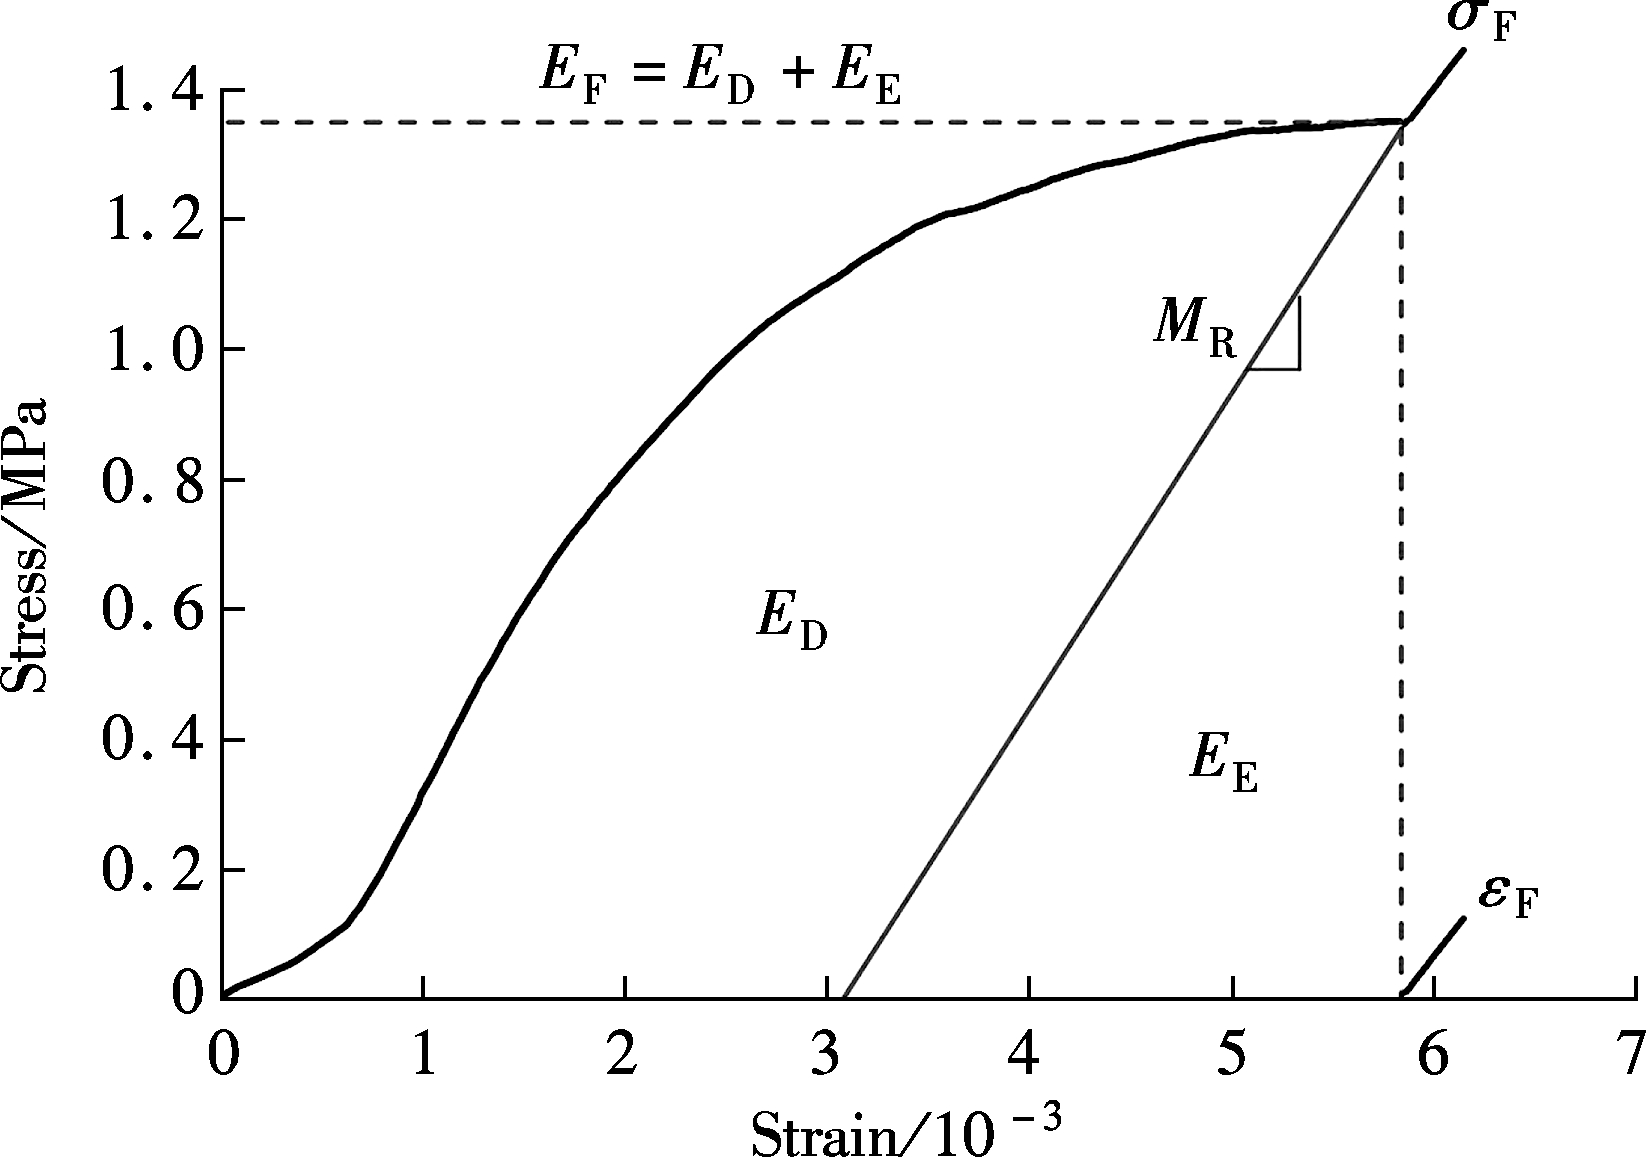
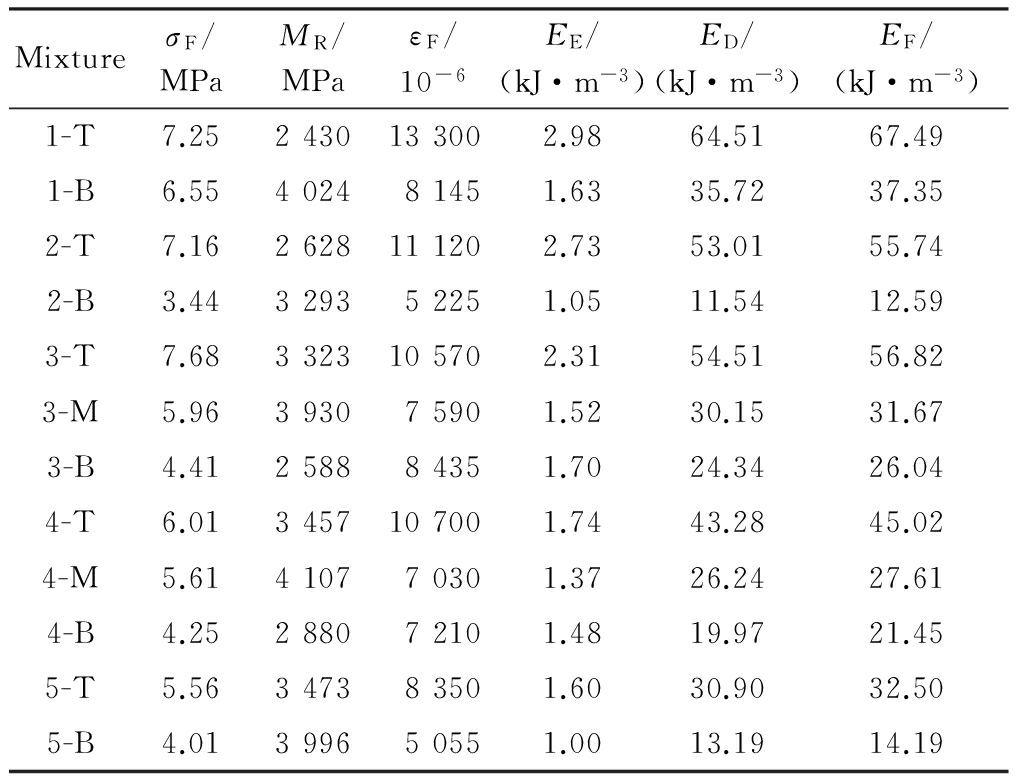
Besides the strength σF, failure strain εF, and resilient modulus MR, the fracture energy density EF(the area under
Fig.2 Testing system
the stress-strain curve up to the peak loading) representing the potential energy required to cause cracks can also be calculated from the SCB strength test. It is composed of the elastic strain energy density EE stored due to the elastic deformation and dissipated creep strain energy density ED absorbed at failure, as shown in Fig.3. ED is usually used as an indicator of the anti-fatigue performance of asphalt mixtures. The SCB strength test results are provided in Tab.2.
It is found from Tab.2 that ARHW-13 mixtures (1-T, 2-T, and 3-T) have the largest σF and ED values, followed by, in turn, AC-13, AC-16, AC-20 and SAC-16 mixtures (1-B, 3-M, 4-T, 4-M, and 5-T), ATB-25 and SAC-25 mixtures (3-B, 4-B, and 5-B), and the AM-20 mixture (2-B) has the smallest σF and ED values.
3.2 SCB fatigue test
The SCB fatigue test results are shown in Fig.4. The following phenomenological model is used for analysis:
lgNF=a-bRS
(1)
where NF is the fatigue life; a and b are the model parameters, as listed in Tab.3.
Fig.4 Fatigue curves from SCB test
Similar to the strength test, the ranking (from high to low) in terms of the anti-fatigue performance for various mixtures is ARHW-13 (1-T, 2-T, and 3-T)> AC-13,
AC-16, and AC-20 (1-B, 3-M, 4-T, and 4-M)> ATB-25 (3-B and 4-B)> SAC-16 and SAC-25 (5-T and 5-B)> AM-20 (2-B). Compared with the half open-graded asphalt macadam, the fatigue life of the crumb rubber modified asphalt mixture improves by 2.0 to 3.8 times at different RS levels. Although this phenomenological model can fit the fatigue curve well for a single mixture, model parameters are strongly dependent on mixture types due to the lack of material properties related to the anti-fatigue performance in the model.
Dissipated energy models have been paid much more attention to in fatigue research because they can overcome defects of phenomenological models. In the dissipated energy models, the fatigue life depends on the energy accumulated at each loading cycle. Asphalt mixtures show the hysteretic behavior under cyclic loading. The area of the hysteresis loop (stress-strain curve) is the dissipated energy density ES accumulated in each loading cycle. It can be calculated via the following equation:
ES=πσεsinφ
(2)
where σ is the stress amplitude at a given loading cycle; ε is the strain amplitude at a given loading cycle; and φ is the phase angle at a given loading cycle.
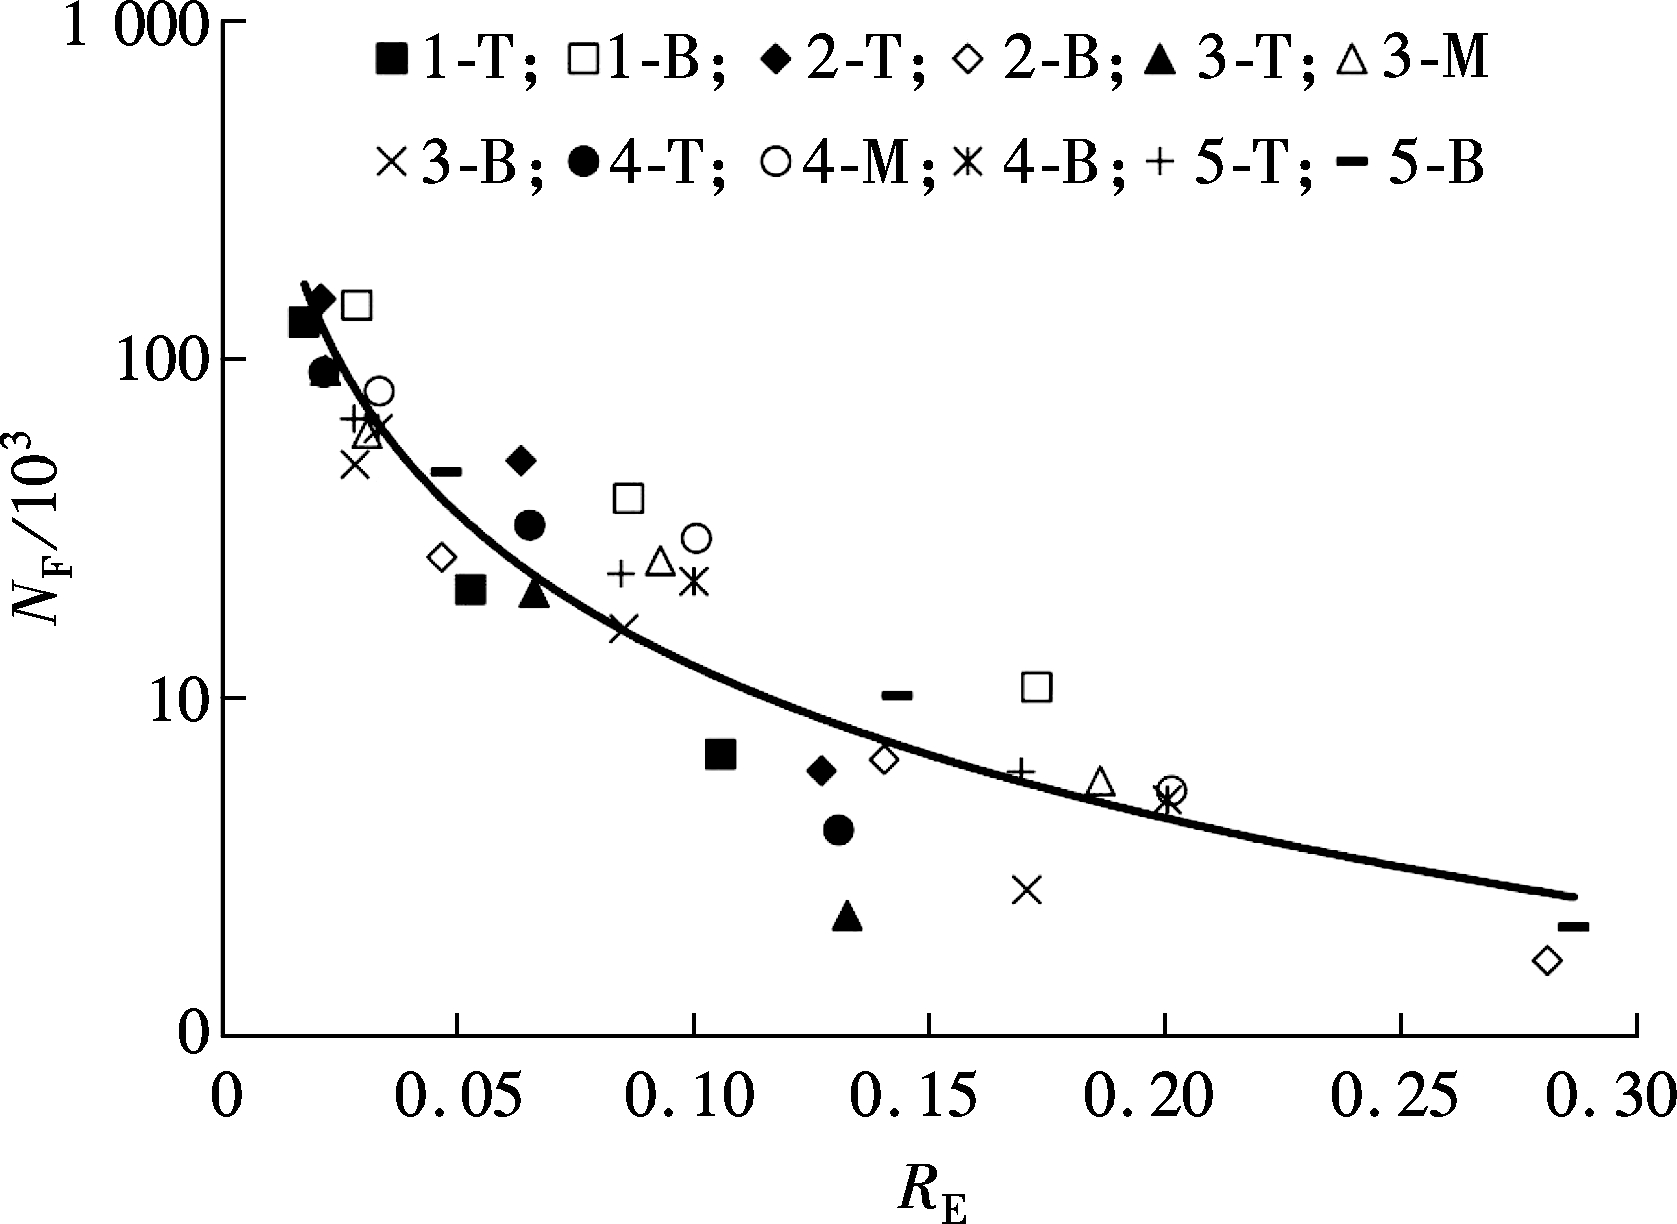
Since the cracking initiation is closely related to the dissipated energy accumulated under both monotonic and cyclic loading, the dissipated energy density ratio RE (the ratio of Es accumulated at the 50th loading cycle in the fatigue test to ED accumulated in the strength test) is proposed as an indicator of the anti-fatigue performance. It can take into account the driving force Es and resistance ED for fatigue cracking simultaneously[3]. The correlation of NF and RE for various mixtures is shown in Fig.5.
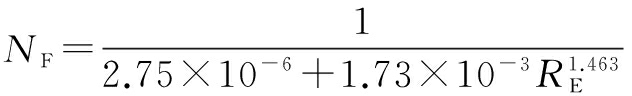
As shown in Fig.5, NF decreases with the increase of RE. The good correlation between them is independent of mixture types. The unified model parameters can be obtained for various mixtures. After the trial, the following fatigue model is developed by regression:
(3)
The coefficient of determination R2 for the regression equation is 0.833, indicating that the prediction accuracy can basically meet the requirements of engineering practice.
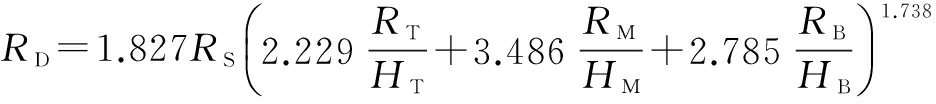
Based on laboratory and field test results, the following empirical relationship is also established to correlate the pavement distress ratio at different stress levels to the thickness and RE of each asphalt surface sublayer.
Fig.5 Relationship between fatigue life and dissipated energy density ratio
(4)
where RT, RM, and RB are the dissipated energy density ratios for the top, middle, and bottom asphalt surface layers, respectively; HT, HM, and HB are the thicknesses (mm) for the top, middle, and bottom asphalt surface layers, respectively.
The coefficient of determination R2 for this regression equation is 0.819, confirming that there is fairly good relevance between laboratory and field research findings. Therefore, RE can be used for evaluating the anti-fatigue performance of the whole asphalt surface. However, it is certain that the accuracy of Eqs.(3) and (4) is needed to validate in the further research due to the limited core samples and pavement structures used in this study.
4 Cracking Cause Analysis
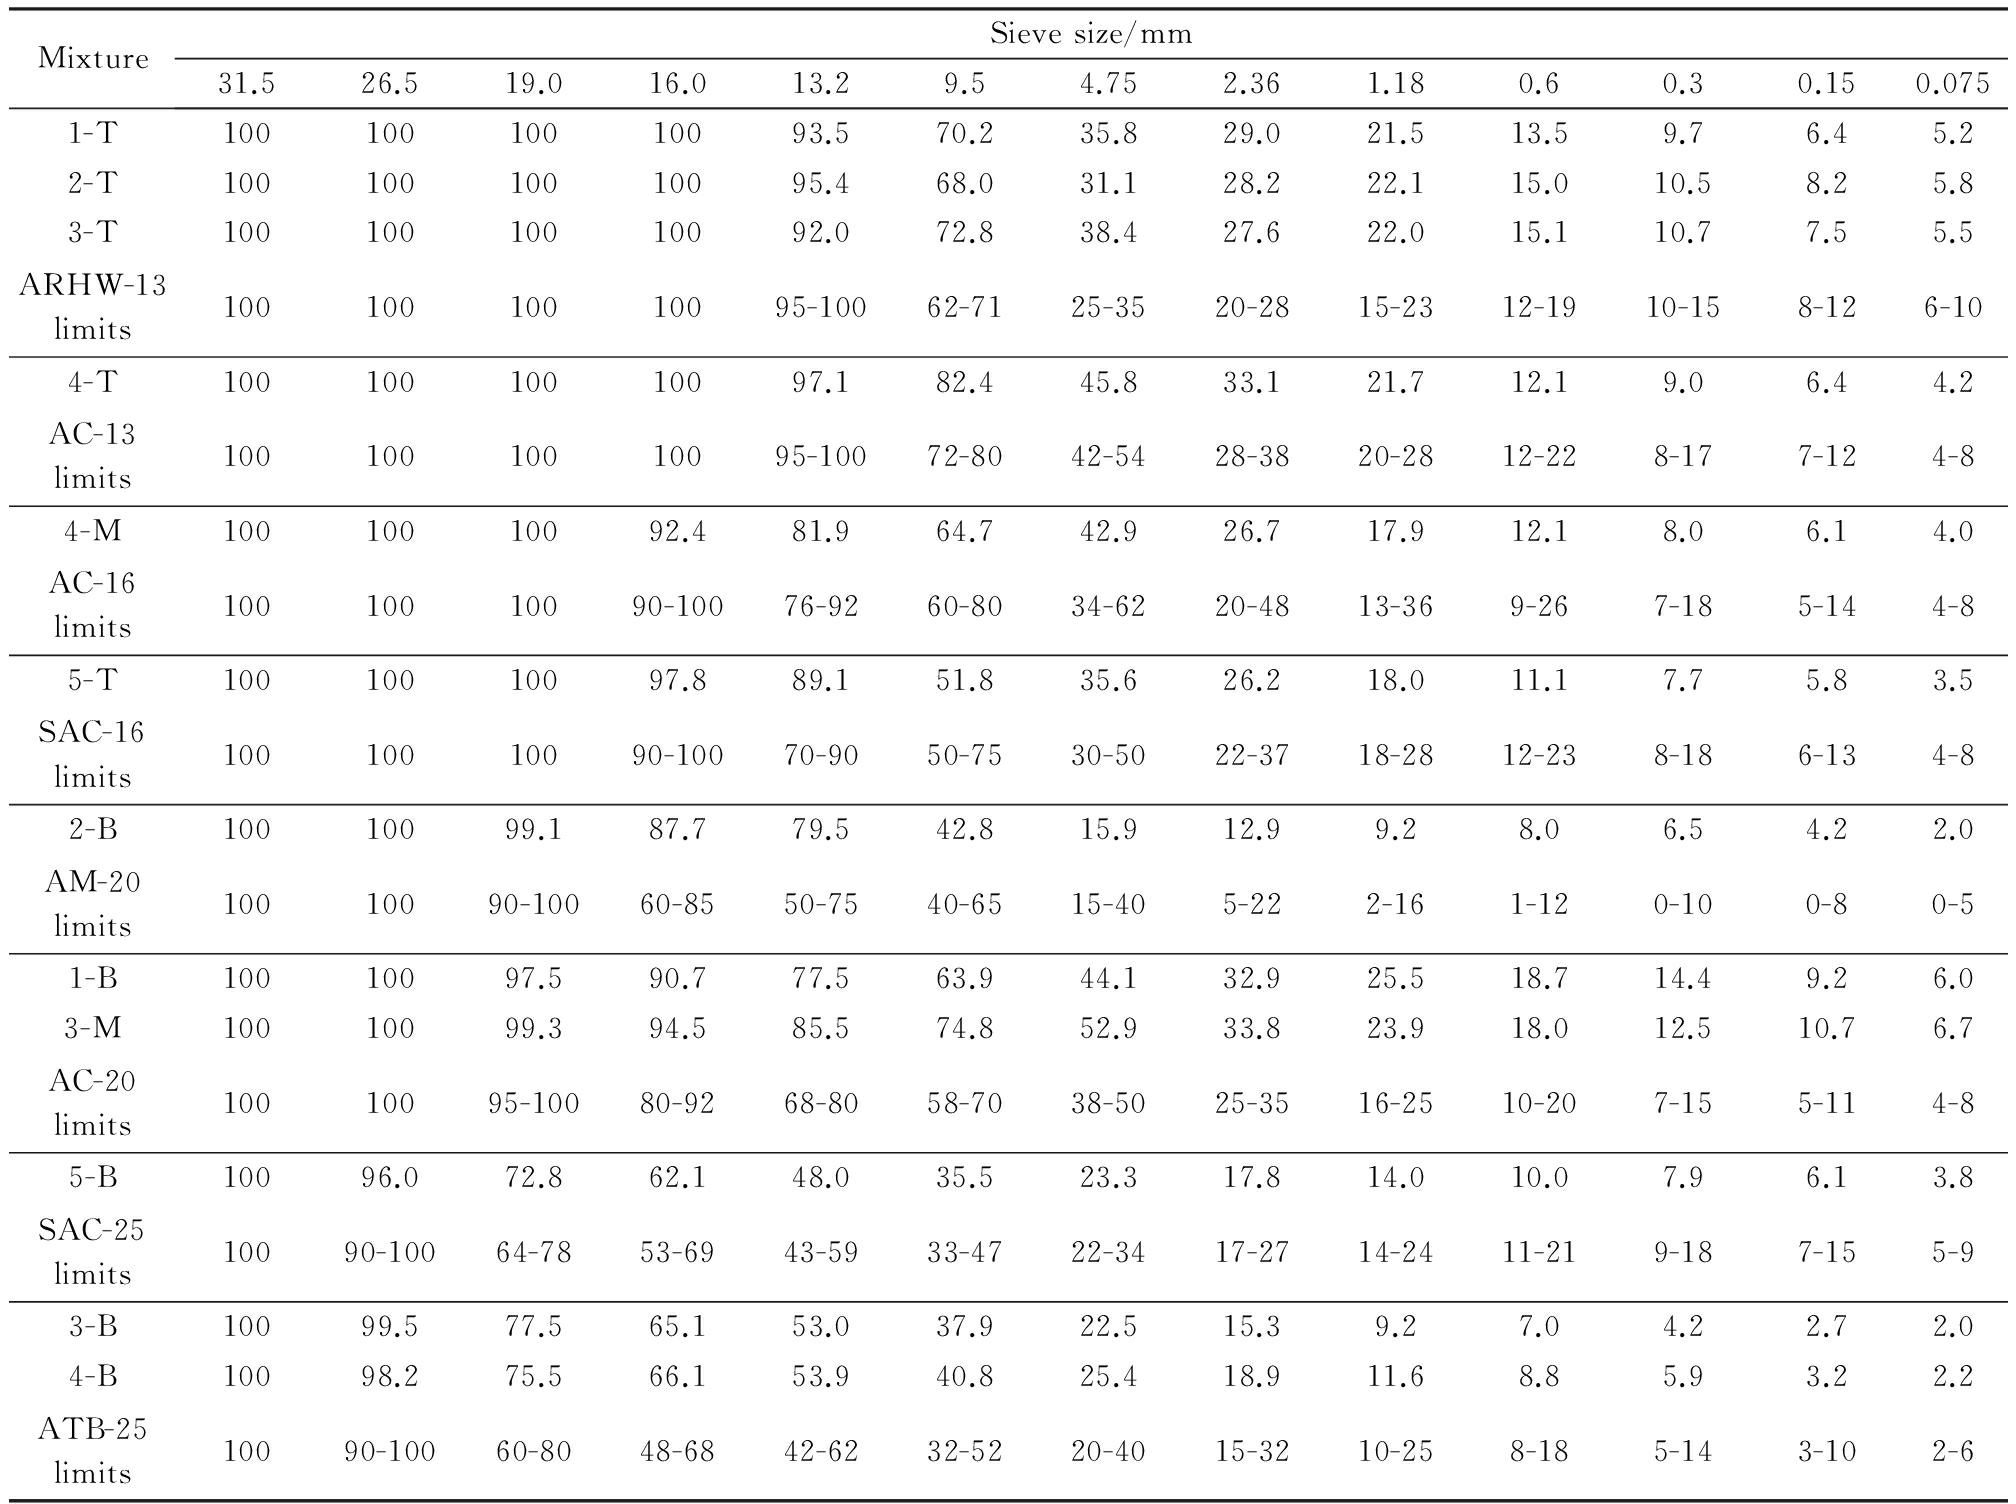
To determine cracking causes, the extraction and sieving tests were conducted on cores after mechanical tests to measure aggregate gradations and binder contents in the field. Detailed results are shown in Fig.6 and Tab.4.
Fig.6 Results of original mix design and extraction test on field cores
Tab.4 Passing percent of sieving test on field cores
The polymer composite rubber modified asphalt binder is used in the ARHW-13 mixture. It increases the adhesion of aggregate and binder. Specifically, elastic rubber particles can significantly improve the toughness and cracking resistance of asphalt mixtures. In some sections, the cracking is mainly attributed to the poor construction control of the gap aggregate gradation ARHW-13. Core samples from sections 1 to 3 show great gradation variability and the passing percent values of several sieve sizes have large deviations from the design medians, even beyond the range limit. Therefore, the ARHW-13 mixture cannot demonstrate the superiority in the anti-fatigue performance without the guarantee of construction quality.
The SAC mixtures usually have good rutting resistance since the gap gradations with the coarse aggregate content of 60% to 70% are used. However, they show poor anti-fatigue performance in this study. The main reason is that the fine aggregate and mastic filled in the coarse aggregate skeleton are insufficient. A stiffer 20# unmodified binder particularly selected for improving the high temperature performance is also a negative factor for the cracking resistance of the SAC-25 mixture.
Many factors contribute to the cracking of the ATB-25 mixtures, such as the use of the 70# unmodified binder, lower binder contents (3.2% to 3.3%), higher air contents (6.8% to 7.0%), and the gradation close to the lower limit of the range. For the AC-13, AC-16, and AC-20 mixtures, the SBS modified binder is used. It has a high elasticity and anti-fatigue performance after the sulfuration process. The construction quality fluctuation of the aggregate gradation and binder content also has a great effect on the anti-fatigue performance of these mixtures.
The SBS modified binder is also used for the AM-20 mixture. However, it shows a poor adhesion due to the lower content of the fine aggregate and mastic. The raveling and stripping distresses are found in some core samples by visual inspection. The field air void content is up to 9%. Moreover, the design thickness of the AM-20 mixture layer is only 4 cm. The ratio of the layer thickness to NMAS (only 2.0) is smaller than the general minimum requirement of 2.5 to 3.0. It may cause compaction difficulty and segregation during the construction process, which will bring cracking and durability problems. The extraction and sieving test results also prove that there are obvious deviations between the field and design aggregate gradations. All these cause the AM-20 mixture to show the poorest anti-fatigue performance.
5 Conclusions
1) Based on test results from field cores, it is found that the CRM mixture shows the best anti-fatigue performance, followed by, in turn, the dense-graded modified mixtures, the continuous graded asphalt treated base and gap graded stone asphalt concrete. The half open-graded asphalt macadam has the lowest resistance to the fatigue cracking.
2) There is a good correlation between the fatigue life and proposed RE. It is independent of mixture types. RE can be used as an indicator to differentiate the anti-fatigue performance for various asphalt mixtures and the distress ratio for various pavement structures.
3) Cracking causes for different pavement sections are different. For the ARHW-13 mixture, the construction control of the gap aggregate gradation is the key factor. The cracking of SAC mixtures is mainly contributed to the lack of the fine aggregate and mastic filled in the coarse aggregate skeleton. Many factors have negative effects on the anti-fatigue performance of the ATB-25 mixtures, such as using the unmodified binder, a lower binder content, higher air content, and insufficient fine aggregate. The higher construction quality variability in terms of the aggregate gradation and binder content is the main reason for the cracking in AC mixtures. The higher air content and thinner layer thickness are two main reasons for the cracking of the AM-20 mixture.
References:
[1]Birgisson B, Montepara A, Romeo E, et al. Determination of fundamental tensile failure limits of mixtures [J]. JournaloftheAssociationofAsphaltPavingTechnologists, 2007, 76: 303-344.
[2]Li X J, Gibson N. Using small scale specimens for AMPT dynamic modulus and fatigue tests [J]. JournaloftheAssociationofAsphaltPavingTechnologists, 2013, 82: 579-615.
[3]Li Q, Lee H J, Kim T W. A simple fatigue performance model of asphalt mixtures based on fracture energy [J]. ConstructionandBuildingMaterials, 2012, 27: 605-611. DOI:10.1016/j.conbuildmat.2011.07.001.
[4]Liu Y. Research on dynamic response and fracture performance of asphalt mixture based on semi-circular bending test [D]. Harbin: School of Transportation Science and Engineering, Harbin Institute of Technology, 2009. (in Chinese)
[5]Luo S, Qian Z D, Harvey J. Experiment on fatigue damage characteristics of epoxy asphalt mixture [J]. ChinaJournalofHighwayandTransport, 2013, 26(2): 20-25. (in Chinese)
[6]Zhang Z Q, Shang T Y, Ku H, et al. Anti-rutting performance evaluation of asphalt structure layers with samples cored at site [J]. ChinaJournalofHighwayandTransport, 2012, 25(5): 31-37. (in Chinese)
[7]Iskender E, Aksoy A. Field and laboratory performance comparison for asphalt mixtures with different moisture conditioning systems [J]. ConstructionandBuildingMaterials, 2012, 27: 45-53. DOI:10.1016/j.conbuildmat.2011.08.019.
[8]Xia H. The corresponding examination for asphalt pavement layer’s fatigue fracture performance based on core samples [D]. Guangzhou: School of Civil Engineering and Transportation, South China University of Technology, 2011. (in Chinese)
[9]Dai Y Q, Sun Z Y, Wu G, et al. Whole field deformation measurement of concrete structure based on digital image correlation [J]. JournalofSoutheastUniversity (NaturalScienceEdition), 2010, 40(4): 829-834. (in Chinese)
[10]Gao L, Ni F J, Braham A, et al. Mixed-mode cracking behavior of cold recycled mixes with emulsion using Arcan configuration [J]. ConstructionandBuildingMaterials, 2014, 55: 415-422. DOI:10.1016/j.conbuildmat.2013.12.079.
Citation:Li Qiang, Yang Huanhuan, Zhang Shuai, et al. Analysis on fatigue cracking for asphalt surface layers based on field cores[J].Journal of Southeast University (English Edition),2016,32(3):356-361.DOI:10.3969/j.issn.1003-7985.2016.03.016.
Foundation item:s:The National Natural Science Foundation of China (No.51308303), the Natural Science Foundation of Jiangsu Province (No.BK20130980), Qing Lan Project, the Practice Innovation Training Program Projects for the Jiangsu College Students (No.201410298024Z), the Scientific Innovation Research of College Graduates in Jiangsu Province (No. SJLX15_0418).
Biography:Li Qiang(1982—), male, doctor, associate professor, liqiang2526@njfu.edu.cn.