Abstract:In order to investigate the material properties of periodontal ligament(PDL) in different locations, the nanoindentation method is used to survey the elastic modulus of the PDL at different levels. Cadaveric specimens of human mandibular canine were obtained from 4 adult donors, 16 transverse specimens were made from the sections of cervical margin, midroot and apex using the slow cutting machine. The prepared specimens were tested in different sections (along the longitudinal direction) and different areas (in the circumferential direction). According to the Oliver-Pharr theory, the mean values of elastic modulus were calculated for each area and the differences among them were compared. In the midroot section, the average elastic modulus is ranging from 0.11 to 0.23 MPa, the changing range of the cervical margin and apex are from 0.21 to 0.53 MPa and 0.44 to 0.62 MPa, respectively. Experimental results indicate that the average elastic modulus in the midroot is lower than that in the cervical margin and apex, and relatively small changes occur among them. However, there is a large change to the elastic modulus value in the circumferential direction for the PDL.
Key words:periodontal ligament(PDL); elastic modulus; nanoindentation; material properties; canine
Periodontal ligament (PDL) is a deformable component connecting tooth root and alveolar bone, which transmits orthodontic forces and moments to alveolar bone and results in tooth mobility during orthodontic treatment[1-2]. However, according to the previous literature and dentist experience, clinical orthodontic treatment is a long-term and iterative process, and is even accompanied by possible side effects. Furthermore, the magnitude of forces and moments is considered to be indeterminate and the biologic response to orthodontic forces is unknown as well [3-4]. Studying the material properties of PDL is fundamental for elucidating the role of PDL in absorbing the treatment load and increasing the understanding of tooth movement under orthodontic loading.
The finite element method (FEM) is an important tool for analyzing the orthodontic movement or the distribution of stress and strain within teeth and periodontium. In order to make the FEM analysis more realistic, accurate material properties must be taken into consideration. Since 1960s, a large number of researchers studied elastic modulus through a series of experiments, such as the uniaxial tensional[5-6], intrusion and extrusive test[7]. Some other measuring methods were adopted to evaluate the distribution of stress and strain exerted within the tooth and periodontium, including laser holography[8], optoelectronical set-ups[9], photoelastic models[10] and electronic speckle pattern interferometry (ESPI)[11]. In spite of this, a number of different results were obtained. The minimum value of the elastic modulus was 0.01 MPa, while the maximum value was 1 750 MPa[12], which differed by a factor of 105. The difference can be attributed to complicated PDL structure, different modeling assumptions for mechanical behavior and the impact of experimental and environmental conditions. When a PDL model was established in the finite element analysis, one problem to consider is that the settings of material properties ascribe to this structure. The majority of researchers assume it to be a linear [13], bilinear[14] or nonlinear model[15] for finite element analysis.
The nanoindentation technique is widely applied to thin film material, new functional material and biological tissue material. Based on the load-displacement data of indentations on a nanometre scale, the selected material properties can be obtained by the test surface of the materials. Unlike other conventional experimental methods for material properties estimation, the local precision mechanical properties of biomaterial structures can be obtained by the nanoindentation technology, and its high resolution of force and accurate indent positioning are considered to be advantageous. As two important performance parameters of material properties, elastic modulus and hardness can be directly extracted from the unloading curve of indentations by utilizing Oliver and Pharr’s method[16]. The ability of the microstructure of PDL to resist the external force deformation can be investigated by the nanoindentation technique, in which, the elastic modulus of the material is calculated by the indentation load-displacement data. Besides, it is a bridge to combine microcosmic mechanical properties and the intrinsic parameters of the material. Huang et al.[17]verified the applicability of the V-W exponential hyperelastic model to describe the instantaneous elastic of the PDL in the nanoindentation method with a spherical indenter. Ashrafi et al.[18] developed a mathematical approach capable of determining the time-dependent Poisson’s ratios of the periodontal ligaments based on the nanoindentation experimental data of stress relaxation and creep tests.
Nanoindentation experiments were performed with various tip geometries. Currently, the measuring indenter involves pyramids, sphere punches, cones, and wedges. Since each indenter is provided with its own advantages and disadvantages, it is important to choose a suitable one for a given application. As a type of pyramid, the Berkovich indenter is extensively used for numerous applications. The reason is that the sharp geometry offers a high degree of spatial resolution and induces plasticity at a shallow depth. In the presence of transient behavior, the changing contact area prevents the conditions of steady-state harmonic motion, and a known contact area cannot be used for calculation. The contact area can be directly measured and it is not affected by transient behavior or thermal drift, therefore the geometry of the flat punch indenter alleviates these problems. Study concerning the elastic modulus of human periodontal ligaments was not reported in the nanoindentation method. The advantage of this study is to obtain more accurate elastic modulus values in different levels and locations.
The objective of this paper is to determine the elastic modulus of PDL at different levels and compare the elastic modulus in the circumferential regions in nanoindentation, as well as provide a basis for the finite element analysis to simulate tooth movement.
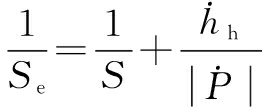
In the Oliver-Pharr scheme[16], reduced elastic modulus can be obtained from the initial slope of the unloading curve which can be fitted by a power function.
P=C(h-hR)m
(1)
where P is the indentation load; C and m are fitting parameters; h is the indenter displacement; hR is the residual indentation depth. Taking the derivative of h for Eq.(1), unloading stiffness S is obtained by
S=mC(hmax-hR)m-1
(2)
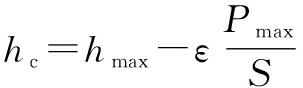
The contact depth between the indenter and the sample can be determined by
(3)
where Pmax denotes the peak load; ε is a constant depending on the indenter geometry. According to the geometry and the contact depth of the indenter, the contact area can be determined. Reduced elastic modulus is calculated by
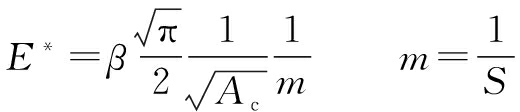
(4)
where β is a constant related to the indenter geometry (β=1.0 for a flat punch); E* denotes the reduced elastic modulus. When considering the elastic deformation of the indenter, the reduced elastic modulus can be denoted by
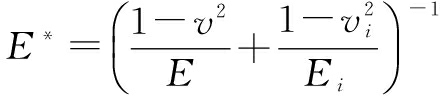
(5)
where E and v are the elastic moduli and Poisson’s rations of the measured material, respectively; Ei and vi are corresponding elastic moduli and Poisson’s rations (for the diamond flat punch indenter, Ei=1 141 GPa and vi=0.07), respectively. It is important to note that due to very high stiffness of the indenter, E* can be employed to represent our sample stiffness when compared with PDL, which can be computed from the unloading curve.
For a cylindrical flat punch indenter with a section radius of R and contact area constant for the cross-sectional area, the following formula is given:
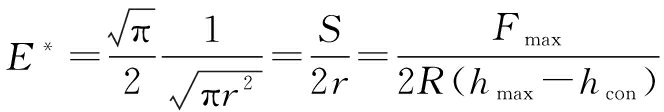
(6)
However, for viscoelastic material, the unloading part curve is more convex(dotted curve in Fig.1) than that of the elastic-plastic materials. As a consequence, it leads to contact stiffness overestimation. A “nose” may be evident and the contact stiffness is negative when the unloading rate is sufficiently low. Applying the measured contact stiffness S to determine the contact depth and elastic modulus may introduce considerable errors. Feng et al.[19] proposed that by adopting the following equation, the true contact stiffness Se can be calculated from the measured contact stiffness S.
(7)
where ![]() h is the creep rate (dh/dt) at the end of holding;
h is the creep rate (dh/dt) at the end of holding; ![]() is the unloading rate (dP/dt) at the beginning of unloading. Replacing S in Eqs.(2) to (4) and (6) with Se, the contact depth and reduced modulus can be accurately determined.
is the unloading rate (dP/dt) at the beginning of unloading. Replacing S in Eqs.(2) to (4) and (6) with Se, the contact depth and reduced modulus can be accurately determined.
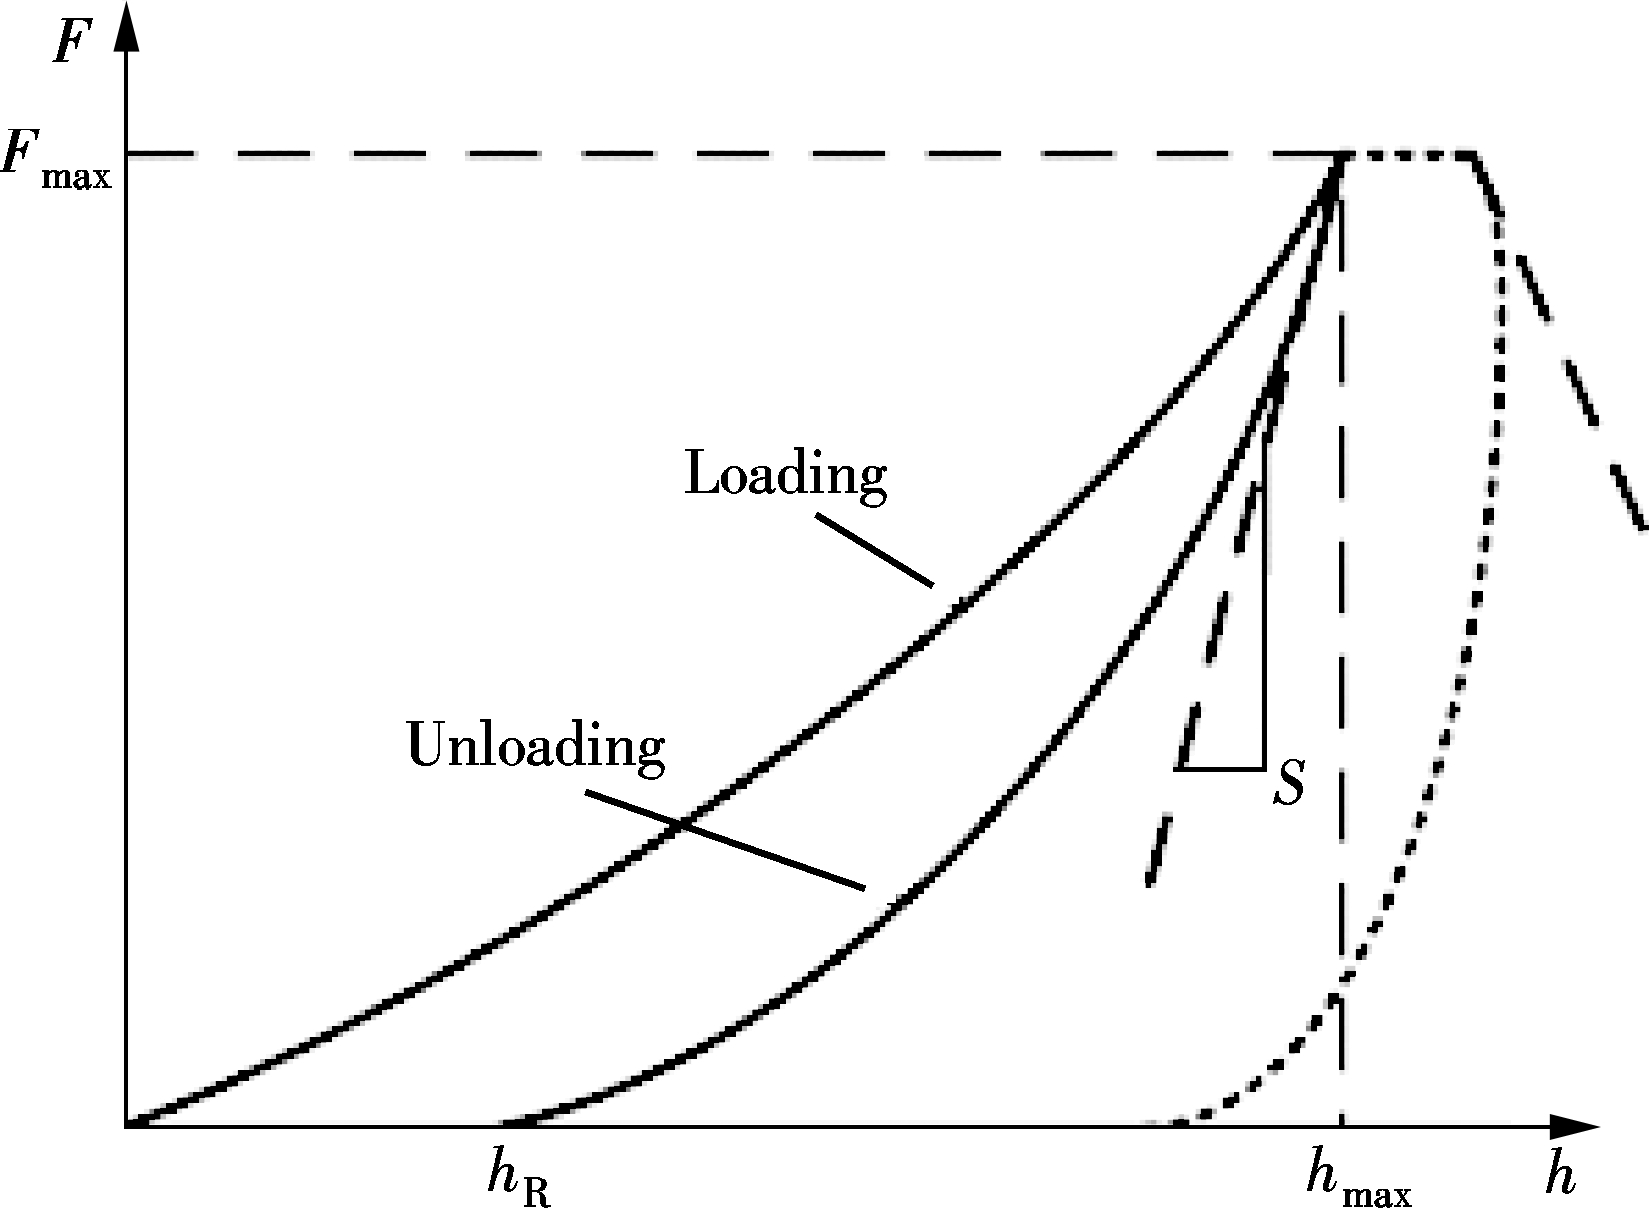
Fig.1 Load-displacement curve of the indentation tests
In the experiments, four cases of human cadaveric mandibula were provided by the Stomatological Hospital of Jiangsu Province. All procedures were approved from the Research Ethics Committee of Affiliated Hospital of Nanjing Medical University. Maxillary canine samples including tooth, PDL and alveolar bone were made. With the help of a slow cutting machine, samples were cut into 3 sections with a thickness of approximately 2 mm, which were perpendicular to the longitudinal axis of the tooth (see Fig.2). A total of 12 specimens were harvested, among which 4 were from the cervical margin, 4 were from the midroot and the other 4 were from the apex. All specimens were stored in saline solution at 10 ℃ until the start of the experiments (less than 2 d).

Fig.2 Slice sample production at different levels of the tooth
At a constant room temperature of 27 ℃, a nano test machine (Agilent Technologies Nano Indenter G200) was used to measure the elastic modulus of PDL. The sample was pasted on the petri dish and the petri dish was fixed onto the working table at the same time (see Fig.3). A total of 4 test areas were determined which included the buccal, lingual, mesial and distal of PDL (see Fig.4(a)), and a moving microscope can test the 4 areas. Using a low microscopic magnification to find a flat test area, subsequently changing to a high magnification to confirm the test position, 2×2 indentations were programmed and performed in each region (see Fig.4(b)). During experiments, the PDL region was coated with saline solution for half an hour to guarantee tissue activity.
A flat punch with a radius of 20 μm was used to test PDL specimens and the elastic modulus was calculated based on the obtained load-displacement curves. A indentation force of 1 mN was reached at the loading rate of 0.1 mN/s. The dwell time lasted for 20 s and finally the PDL was unloaded at the same rate. The load-displacement data in the whole testing process was recorded to investigate the material properties of the PDL.
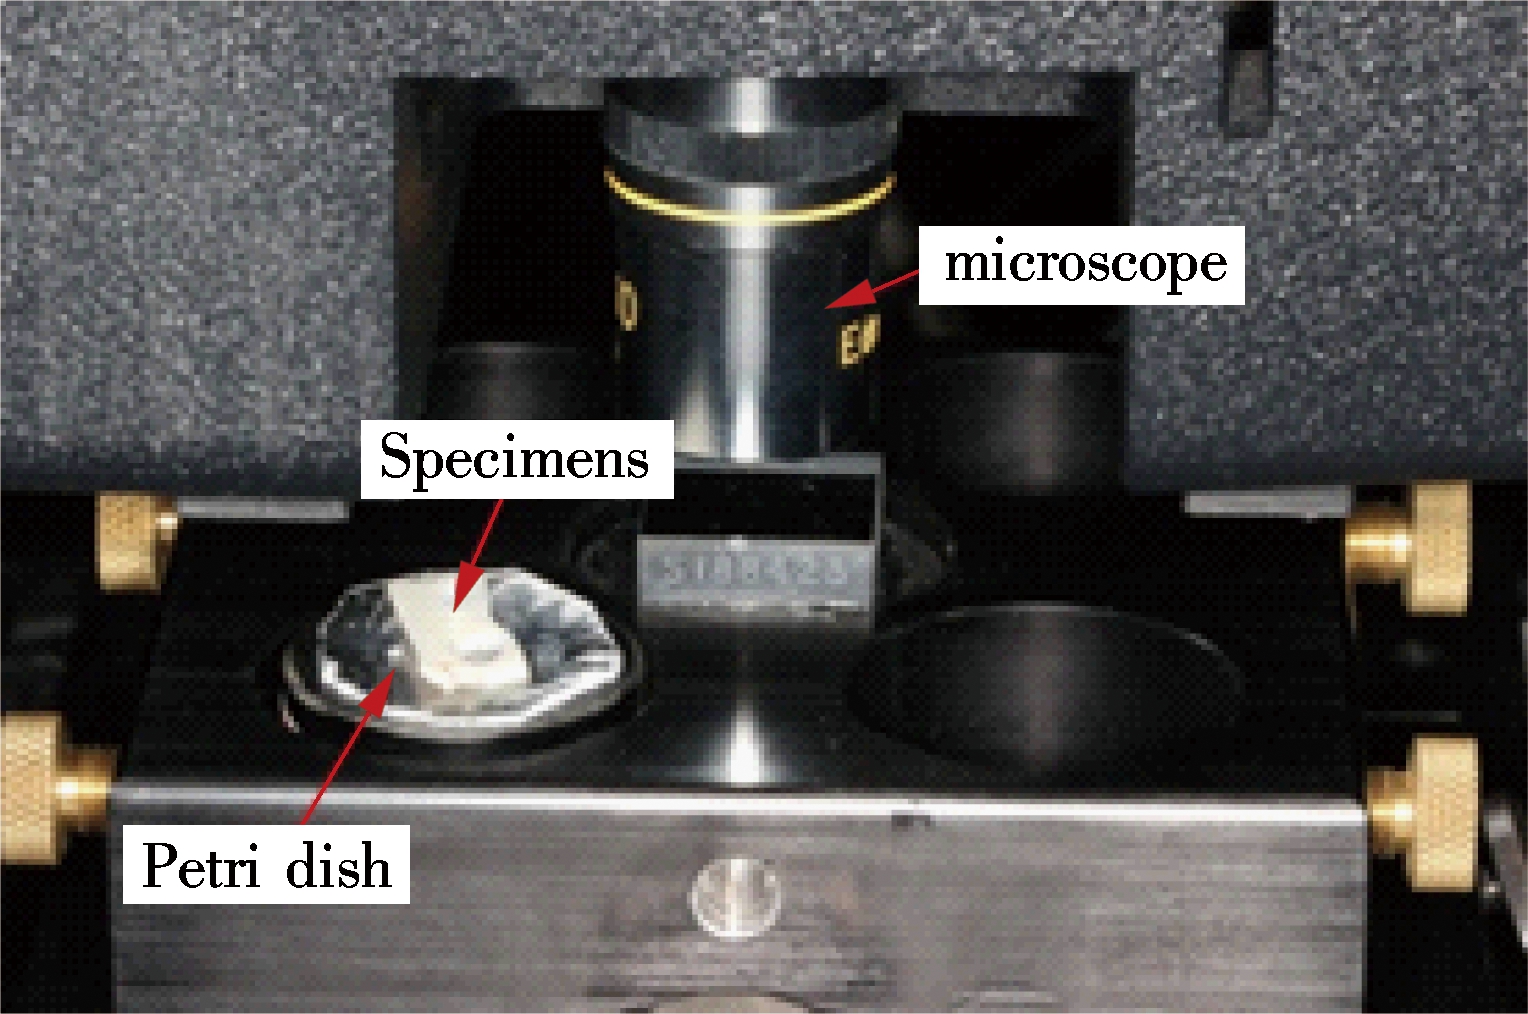
Fig.3 Photographs of the slice sample on the working table of nanoindentation
(a) 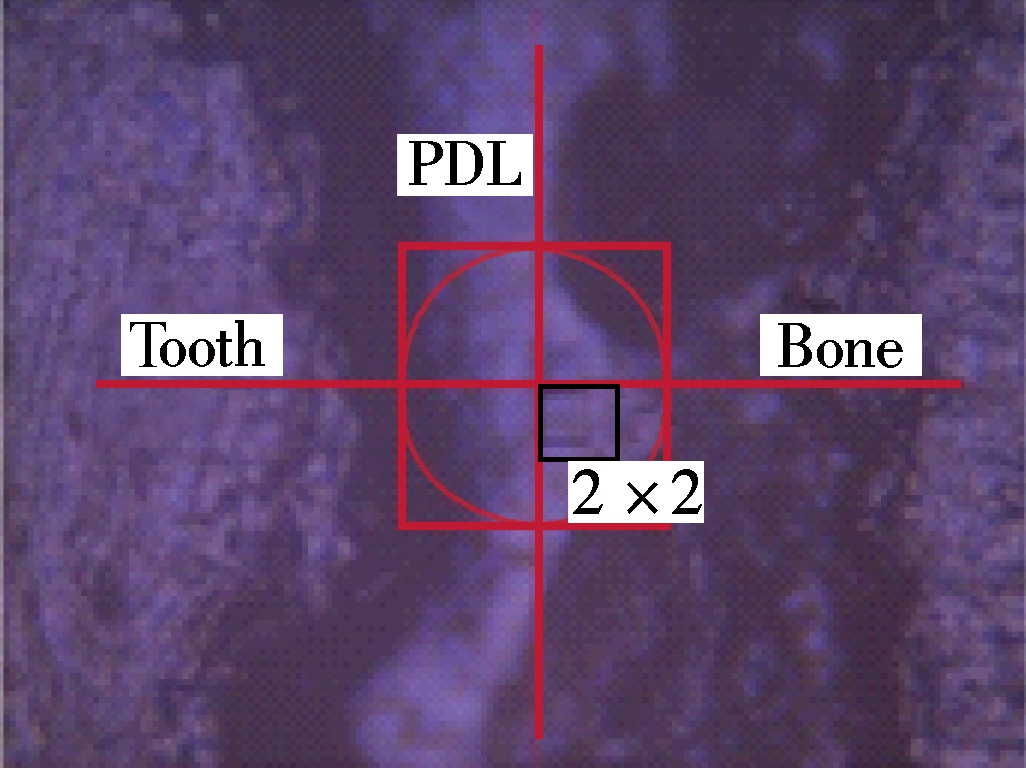 (b)
(b)
Fig.4 Diagrams of the PDL area. (a) The cross-section specimen of tooth;(b) Mesial side image of specimen with10-fold magnification
Among 12 specimen tests, in a total of 192 indentation curves, 175 can be calculated (excluding error and unable fitted curves). Due to the difference between specimens and the anisotropy of the PDL, testing the same section for different samples with a fixed loading velocity led to different load-depth curves during loading and unloading procedures (see Fig.5). In the same region of the same section specimen, the variations of load-depth curves are relatively small compared with the same section(see Fig.6).
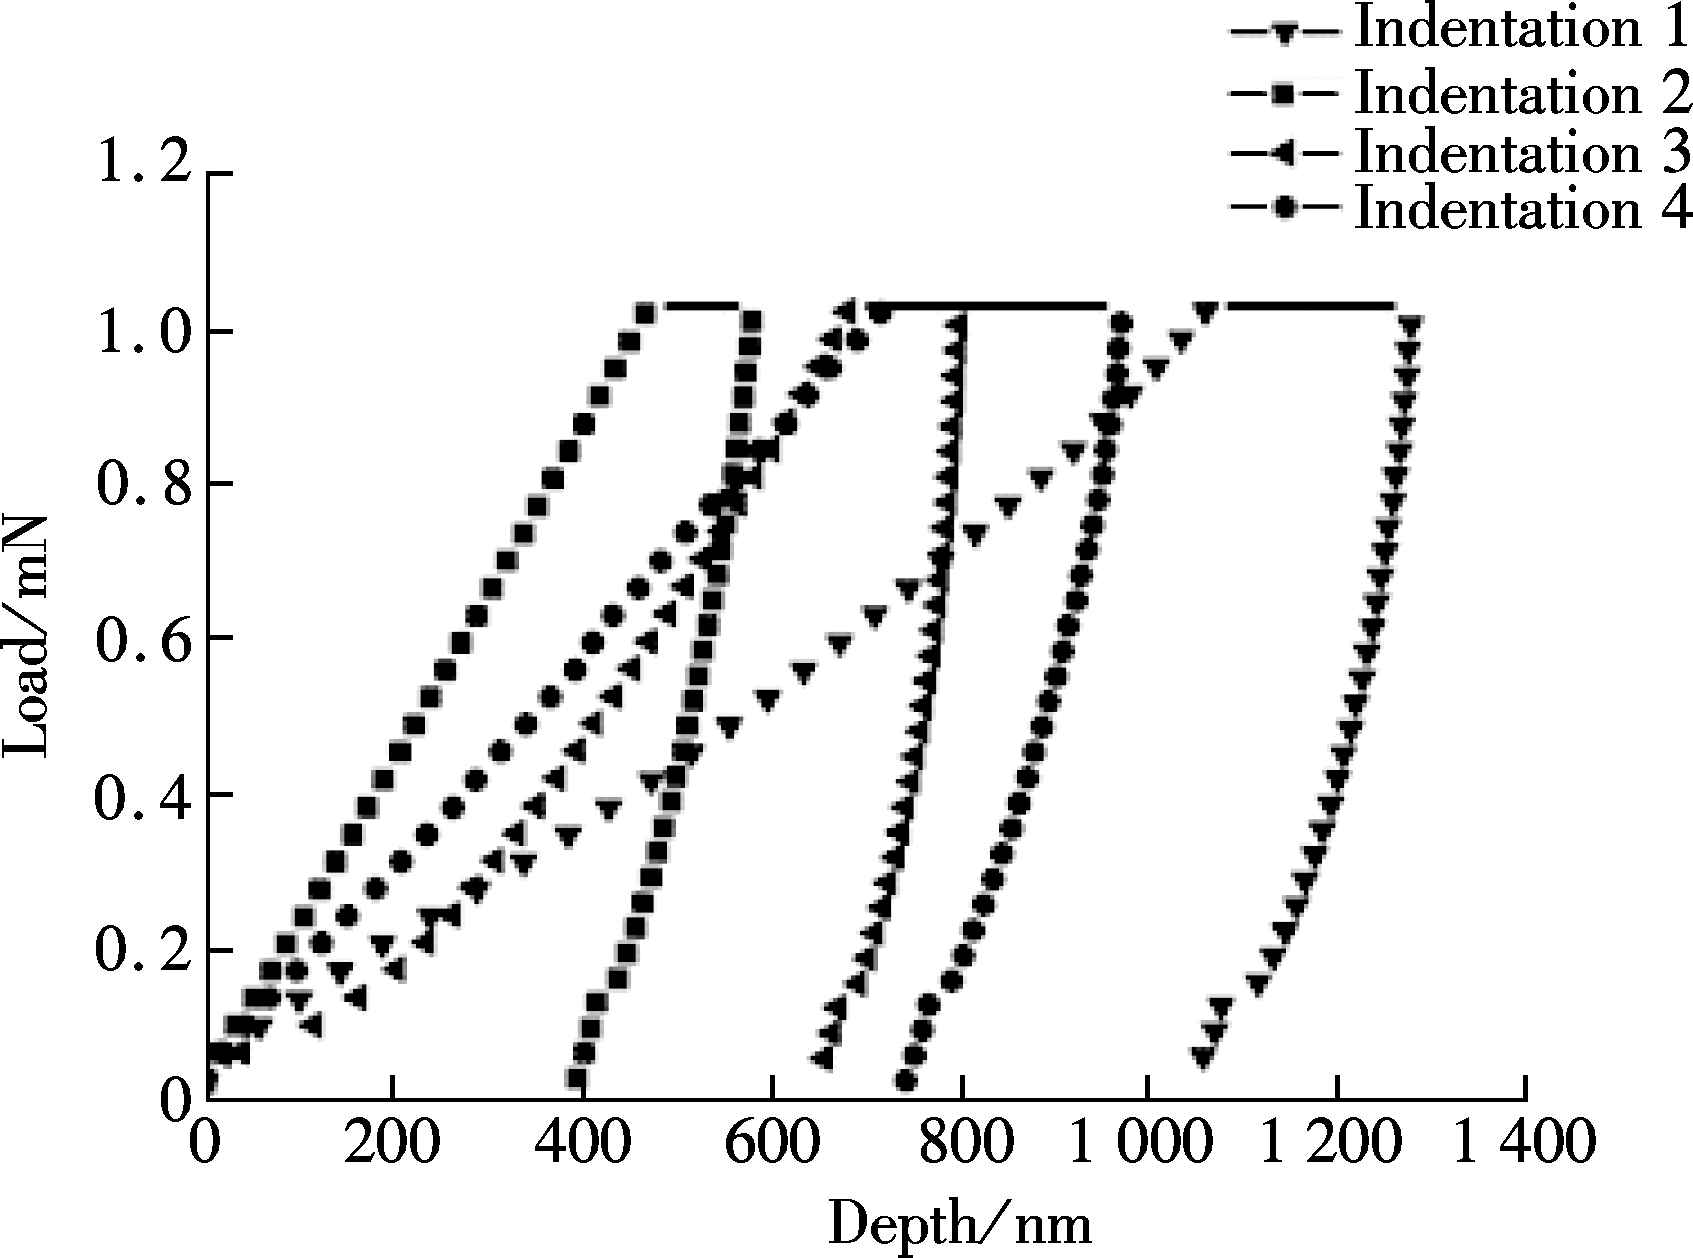
Fig.5 Comparison of different load-depth curves of the apex specimen
According to the experiment results, some curves that failed to fit the unloading curve are abandoned. The mean value of PDL and standard deviations of different sections along the longitudinal direction and in the circumferential direction for specimen 1 to specimen 4 are summarized in
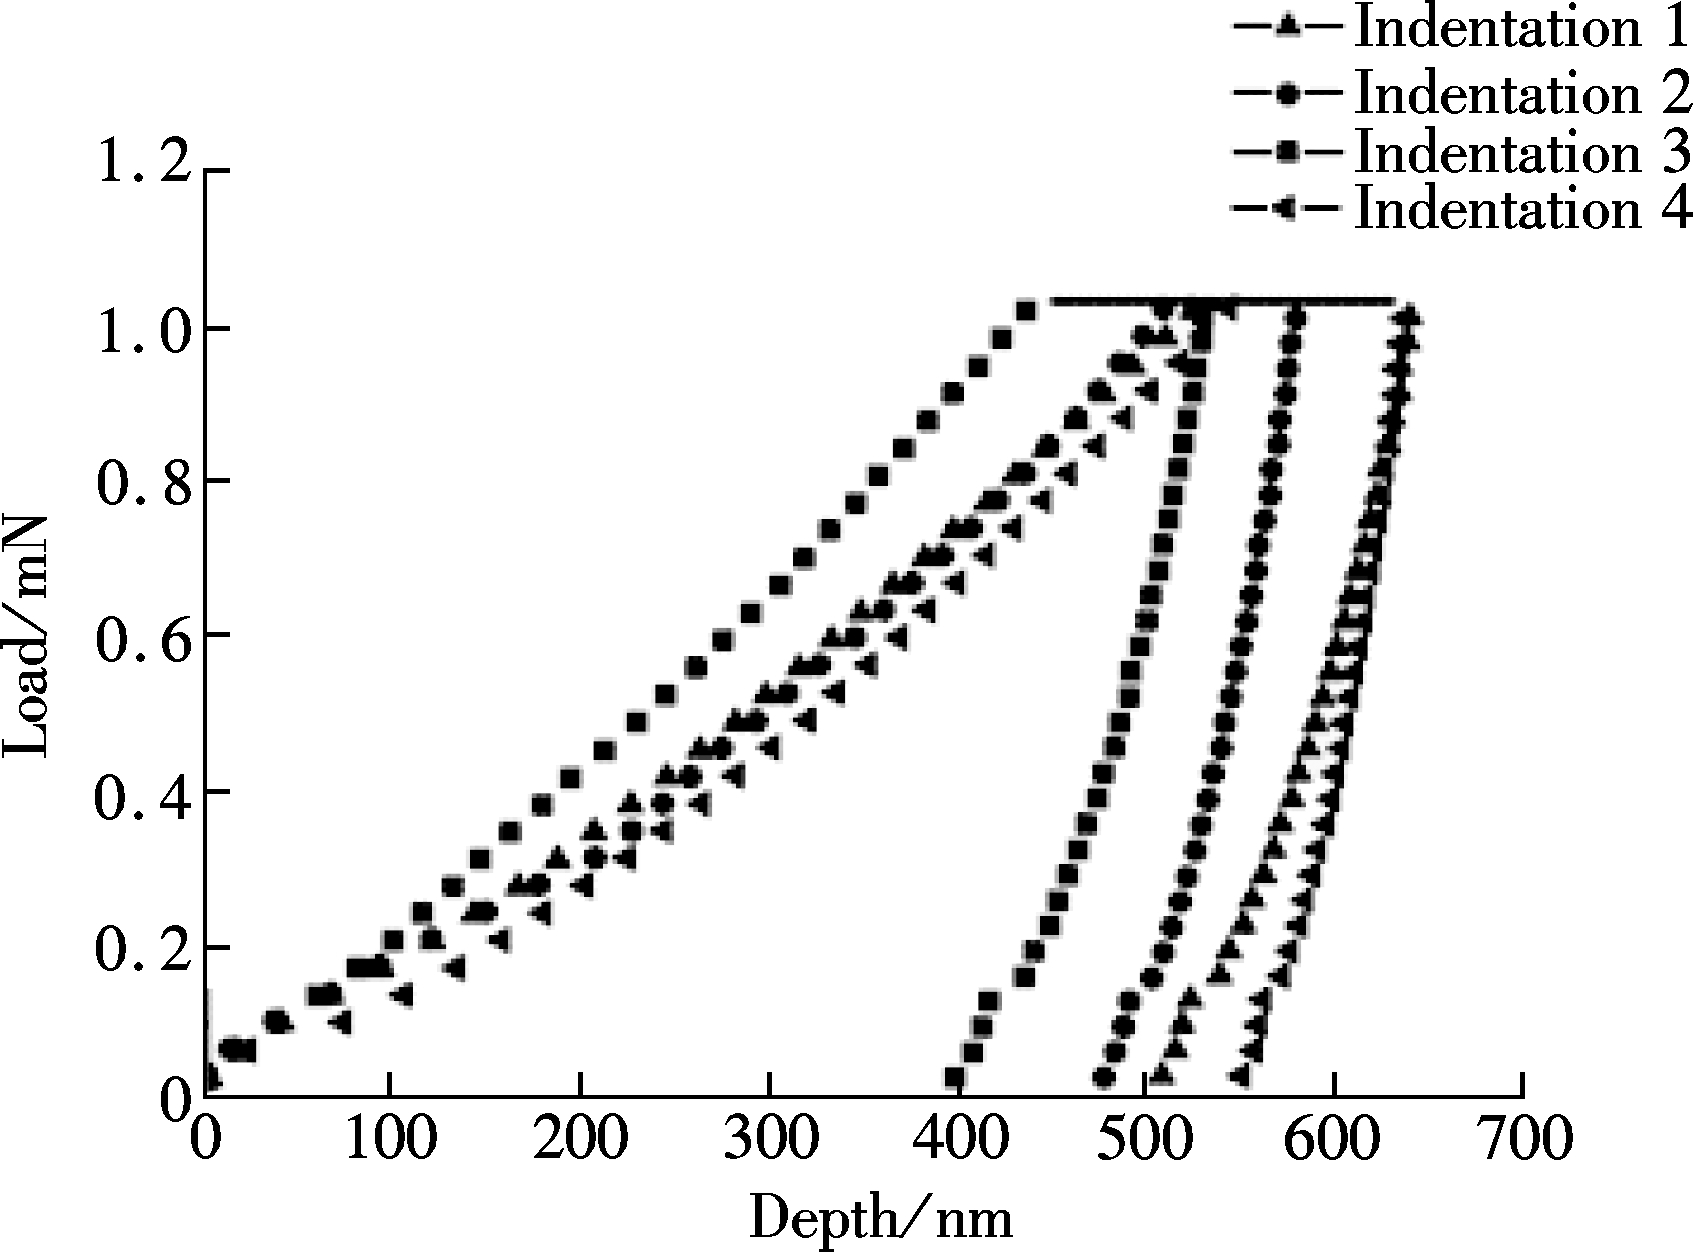
Fig.6 Four load-depth curves of the lingual region on the midroot specimen
Tab.1 and Tab. 2 respectively. A paired t-test was adopted to compare different levels (along longitudinal direction) and different areas (in the circumferential direction). Consequently, the elastic modulus shows a significant difference along the longitudinal direction, while no significant differences were observed in the circumferential direction. A highly significant difference was observed among the midroot, cervical margin, and apex (see Tab.3).
Tab.1 The average elastic modulus and standard deviations of PDL for different sections along the longitudinal direction
MPa
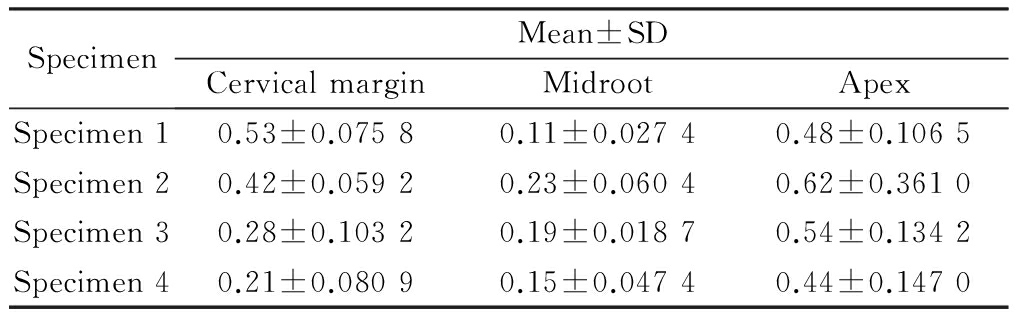
SpecimenMean±SDCervicalmarginMidrootApexSpecimen10.53±0.07580.11±0.02740.48±0.1065Specimen20.42±0.05920.23±0.06040.62±0.3610Specimen30.28±0.10320.19±0.01870.54±0.1342Specimen40.21±0.08090.15±0.04740.44±0.1470
Tab.2 The average elastic modulus and standard deviations of PDL for different areas in the circumferential direction
MPa
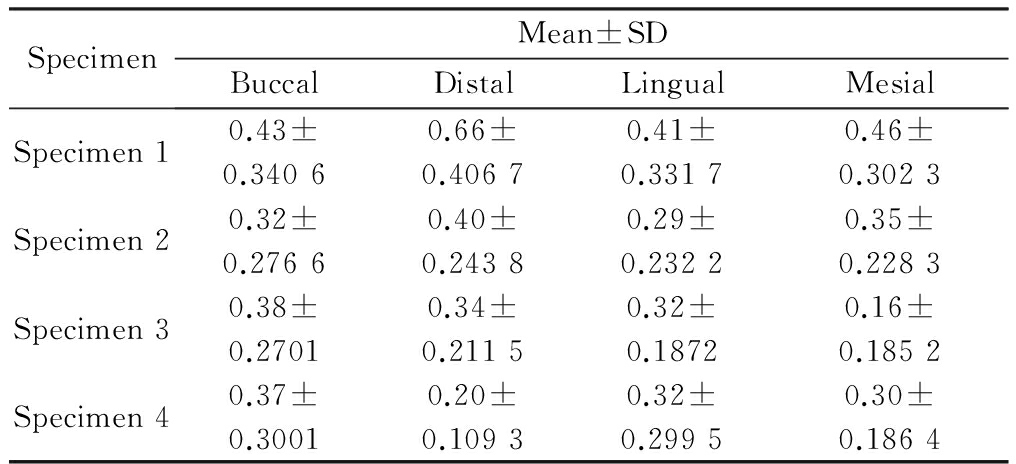
SpecimenMean±SDBuccalDistalLingualMesialSpecimen10.43±0.34060.66±0.40670.41±0.33170.46±0.3023Specimen20.32±0.27660.40±0.24380.29±0.23220.35±0.2283Specimen30.38±0.27010.34±0.21150.32±0.18720.16±0.1852Specimen40.37±0.30010.20±0.10930.32±0.29950.30±0.1864
Tab.3 Results of statistical analyses of PDL on different section sections
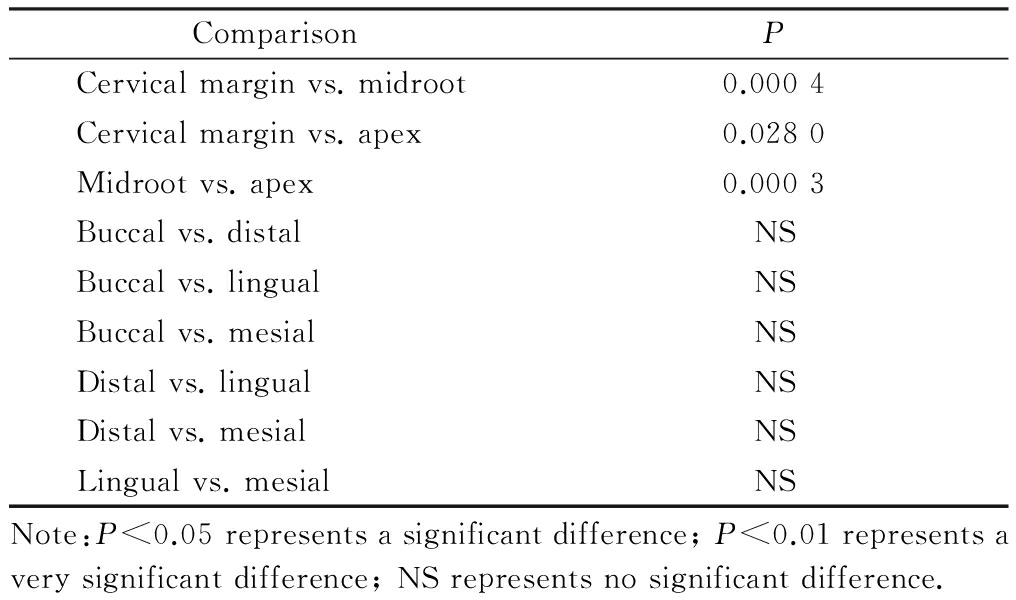
ComparisonPCervicalmarginvs.midroot0.0004Cervicalmarginvs.apex0.0280Midrootvs.apex0.0003Buccalvs.distalNSBuccalvs.lingualNSBuccalvs.mesialNSDistalvs.lingualNSDistalvs.mesialNSLingualvs.mesialNSNote:P<0.05representsasignificantdifference;P<0.01representsaverysignificantdifference;NSrepresentsnosignificantdifference.
The elastic modulus in the midroot ranging from 0.11 to 0.23 MPa was lower than that in the cervical margin ranging from 0.21 to 0.53 MPa and apex ranging from 0.44 to 0.62 MPa, among which the maximum value is 1.23 MPa at the apex on distal aspect, while the minimum value is 0.07 MPa at midroot on the mesial aspect. However, the mean value of elastic modulus has no obvious difference in the circumferential direction, the standard deviation ranging from 0.185 2 to 0.406 7 was higher than that along the longitudinal direction ranging from 0.018 7 to 0.361 0.
The above measurements detailed above are influenced by different factors that are difficult to judge quantitatively. In order to guarantee the measurement accuracy, the sample’s storage and experiment conditions are standardized as far as possible.
The experimental result is strongly affected by surface conditions. In order to make the cut surface relatively smooth, the samples were embedded in paraffin, so it was convenient to fix the position and guarantee the accuracy of sample preparation in the process of making samples. During the test, first, a low power micro lens(10 times of magnification) was moved to find the position of PDL(see Fig.4(b)), and then, a high power micro lens(50 times of magnification) was used to focus and test after determining the position of the test. However, there is a requirement on the sample surface roughness in the process of focusing. If the sample’s surface roughness of the testing zone in the focalization process is less than 5 μm, the focalization can be carried out to ensure the reliability of the results to some extent.
PDL is a soft connective tissue, which mainly consists of collagen fibers accounting for 50% of total mass fraction. In addition, PDL also contains cells, blood vessels and nerve endings embedded into a ground substance matrix[20]. The principal fibers are composed of a large fiber bundle of collagen fibers. Due to different positions and functions, as well as different arrangement directions, there are several arrangement modes from the cervical margin to apex. This is the reason why different elastic moduli present at different levels. Moreover, PDL is a type of inhomogeneous biological material and the elasticity moduli of different test areas are different as well.
The present study demonstrates the difference among the indentation curves of the load-depth behavior in different regions depended on loading velocity and dwell time. In this study, the elastic modulus of upper (cervical margin) and lower (apex) regions are higher than that of intermediate regions (midroot). This observation means that along the axial direction, the stiffness of PDL with different regions is in conformity with observations made by other authors[19]. Another important phenomenon observed is that the mean values of elastic modulus show no significant difference in the circumferential direction (buccal, lingual, distal, mesial). However, the value changes greatly in each region (see Tab.2). The reason may be that the percentage of blood vessels and nerves is high in the midroot area when compared with the other two areas[21]. The density variation of collagen fibers is different along the axial direction.
The finite element method has been applied to dental biomechanics for a long time. In the early stage, it was confined to the study of axisymmetric and two-dimensional problems. The development of the technology is particularly attractive to a number of orthodontic investigators. This is because they can establish elaborative three-dimensional models, accurately simulate tooth movement when subjected to various orthodontic forces and provide an excellent visualized profile of the displacement and stress fields occurring in PDL and surrounding tissues. When modeling PDL in a finite element analysis study, one problem is how physical property values describe this structure. The results of the nanoindentation test are easily affected by the experimental conditions, such as the size of sample, loading and unloading rate, shape of the indenter, punch radii and etc.
As it is known, the PDL exhibits anisotropic, inhomogeneous and viscoelastic material properties. A qualitative analysis for PDL will be conducted in future research, in which a viscoelastic constitutive model is established.
In this work, the elastic moduli of PDL in different regions are compared and evaluated in the nanoindentation method. In the direction of the long axis, the minimum mean value of the elastic modulus is in midroot, while the maximum in apex. This phenomenon is associated with the different arranging direction of the principal fibers. A highly significant difference was observed among these areas. However, the values of elastic modulus present a relatively great variation in the circumferential direction, and there is no statistic difference in this direction. Thus, the values of elastic modulus for cervical margin, midroot and apex in this study can be used in finite element analysis.
[1]Storey E. The nature of tooth movement [J]. American Journal of Orthodontics, 1973, 63(3): 292-314. DOI:10.1016/0002-9416(73)90353-9.
[2]Melsen B. Tissue reaction to orthodontic tooth movement—a new paradigm [J]. European Journal of Orthodontics, 2001, 23(6): 671-681. DOI:10.1093/ejo/23.6.671.
[3]Marangalou J H, Ghalichi F, Mirzakouchaki B. Numerical simulation of orthodontic bone remodeling [J]. Orthodontic Waves, 2009, 68(2): 64-71. DOI:10.1016/j.odw.2008.12.002.
[4]Badawi H M, Toogood R W, Carey J P, et al. Three-dimensional orthodontic force measurements[J]. American Journal of Orthodontics and Dentofacial Orthopedics, 2010, 136(4): 518-528. DOI:10.1016/j.ajodo.2009.02.025.
[5]Dorow C, Krstin N, Sander F G. Determination of the mechanical properties of the periodontal ligament in a uniaxial tensional experiment[J]. Journal of Orofacial Orthopedics, 2003, 64(2): 100-107. DOI:10.1007/s00056-003-0225-7.
[6]Dorow C, Krstin N, Sander F G. Experiments to determine the material properties of the periodontal ligament[J].Journal of Orofacial Orthopedics, 2002, 63(2): 94-104. DOI:10.1007/s00056-002-0107-4.
[7]Toms S R, Lemons J E, Bartolucci A A, et al. Nonlinear stress-strain behavior of periodontal ligament under orthodontic loading[J]. American Journal of Orthodontics and Dentofacial Orthopedics, 2002, 122(2): 174-179. DOI:10.1067/mod.2002.124997.
[8]Burstone C J, Pryputniewicz R J. Holographic determination of centers of rotation produced by orthodontic forces[J]. American Journal of Orthodontics and Dentofacial Orthopedics, 1980, 77(4): 396-409. DOI:10.1016/0002-9416(80)90105-0.
[9]Hinterkausen M, Bourauel C, Siebers G, et al. In vitro analysis of the initial tooth mobility in a novel optomechanical set-up[J]. Medical Engineering & Physics, 1998, 20(1): 40-49. DOI:10.1016/s1350-4533(97)00042-8.
[10]Maia L G, de Moraes Maia M L, da Costa Monini A, et al. Photoelastic analysis of forces generated by T-loop springs made with stainless steel or titanium-molybdenum alloy[J]. American Journal of Orthodontics and Dentofacial Orthopedics, 2011, 140(3): 123-128. DOI:10.1016/j.ajodo.2011.03.020.
[11]Liu D X, Wang H N, Wang C L, et al. Modulus of elasticity of human periodontal ligament by optical measurement and numerical simulation[J]. Angle Orthodontist, 2011, 81(2): 229-236. DOI:10.2319/060710-311.1.
[12]Fill T S, Carey J P, Toogood R W, et al. Experimentally determined mechanical properties of, and models for the periodontal ligament: Critical review of current literature[J]. Journal of Dental Biomechanics, 2011, 2(1):312980. DOI:10.4061/2011/312980.
[13]Motoyoshi M, Hirabayashi M, Shimazaki T, et al. An experimental study on mandibular expansion: Increases in arch width and perimeter[J]. European Journal of Orthodontics, 2002, 24(2): 125-130. DOI:10.1093/ejo/24.2.125.
[14]Katona T R, Qian H A. Mechanism of noncontinuous supraosseous tooth eruption[J]. American Journal of Orthodontics and Dentofacial Orthopedics, 2001, 120(3):263-271. DOI:10.1067/mod.2001.116086.
[15]Tanne K. Stress induced in the periodontal tissue at the initial phase of the application of various types of orthodontic forces: 3-dimensional analysis using a finite element method[J]. Journal of Osaka University Dental School, 1983, 28(2):209-261. DOI:10.1016/0002-9416(85)90115-0.
[16]Oliver W C, Pharr G M. An improved technique for determining hardness and elastic modulus using load and displacement sensing indentation experiments[J]. Journal of Materials Research, 1992, 7(6): 1564-1583. DOI:10.1557/jmr.1992.1564.
[17]Huang H, Tang W, Yan B, et al. Mechanical responses of the periodontal ligament based on an exponential hyperelastic model: A combined experimental and finite element method[J]. Computer Methods in Biomechanics and Biomedical Engineering, 2016, 19(2): 188-198. DOI:10.1080/10255842.2015.1006207.
[18]Ashrafi H, Shariyat M. A. Mathematical approach for describing time-dependent Poisson’s ratios of periodontal ligaments[J]. Journal of Biomedical Physics & Engineering, 2012, 2(3):108-114.
[19]Feng G, Ngan A H W. Effects of creep and thermal drift on modulus measurement using depth-sensing indentation[J]. Journal of Materials Research, 2002, 17(3): 660-668. DOI:10.1557/jmr.2002.0094.
[20]Pietrzak G, Curnier A, Botsis J, et al. A nonlinear elastic model of the periodontal ligament and its numerical calibration for the study of tooth mobility[J]. Computer Methods in Biomechanics and Biomedical Engineering, 2002, 5(2): 91-100. DOI:10.1080/10255840290032117.
[21]Chiba M, Yamane A, Ohshima S, et al. In vitro measurement of regional differences in the mechanical properties of the periodontal ligament in the rat mandibular incisor[J]. Archives of Oral Biology, 1990, 35(2): 153-161. DOI:10.1016/0003-9969(90)90177-c.
References:
摘要:为了研究牙周膜(PDL)不同部位的材料特性,采用纳米压痕方法测量牙周膜不同层面的弹性模量.实验样本取自4个成年捐献者的上颚尖牙,使用慢速切割机分别在颈缘、根中、根尖3个层面共制作16个切片样本.分别测试每个尖牙样本的不同区域(沿圆周方向)和不同层面(沿长轴方向),基于Oliver-Pharr理论计算这些位置的弹性模量并比较它们之间的差异.根中区域平均弹性模量为0.11~0.23 MPa, 颈缘与根尖分别为0.21~0.53 MPa,0.44~0.62 MPa.实验结果表明,根中区域的弹性模量平均值小于颈缘与根尖区域,且变化较小,而沿圆周方向的弹性模量有较大的变化.
关键词:牙周膜;弹性模量;纳米压痕;材料特性;尖牙
中图分类号:R783.1
Foundation item:The National Natural Science Foundation of China(No. 51305208).
Citation::Yang Yu, Tang Wencheng. Elastic modulus determination at different levels of periodontal ligament in nanoindentation[J].Journal of Southeast University (English Edition),2017,33(1):33-38.
DOI:10.3969/j.issn.1003-7985.2017.01.006.
DOI:10.3969/j.issn.1003-7985.2017.01.006
Received 2016-11-20.
Biographies:Yang Yu (1988—), male, graduate; Tang Wencheng(corresponding author), male, doctor, professor, tangwc@seu.edu.cn.