
Abstract:By deriving the stress concentration factor of the estimation approach for residual fatigue life, an estimation approach for structure crack propagation based on multiple factors correction is proposed. Then, the quantitative expression among the structure factor, stress ratio, loading type, the manufacture processing factor and the crack propagation is achieved. The proposed approach is implemented in a case study for an instance structure, and the influences of correction factors on the crack propagation are analyzed. Meanwhile, the probabilistic method based on Weibull distribution probability density function is selected to evaluate the precision of the corrected estimation approach, and the probability density of results is calculated by the probability density function. It is shown that the results estimated by the corrected approach is more precise than those estimated by the fracture mechanics, and they are closer to the test data.
Key words:estimation study; crack propagation; multiple factor correction; probability density function
Many mechanical components experience fatigue failure in service, e.g. the mast in a helicopter, railroad wheels, turbine blades, etc[1]. As an important parameter for reliability assessment, the calculation of crack propagation is of great significance. However, many factors, such as the structure factor, stress ratio, loading type, manufacturing processing and etc., affect the results of crack propagation.
Therefore, it is necessary to conduct research on crack propagation based on the factors above. Stasevic et al.[2] predicted the crack propagation by the mechanics model. Carter et al.[3] presented the prediction of crack propagation by the finite element method (FEM). However, these prediction methods disregard the structure characteristics and other influencing factors.
Also, various correction approaches were proposed. Zhang et al.[4] proposed an approach to predict the crack propagation by using the closed-form solution of the stress concentration factor. Wang et al.[5] built a linear embedded spring model by using the distribution load. Esmaeili et al.[6]studied the crack propagation of specimens under multiaxial loading. Lu et al.[7] presented research on the base of the multiaxial damage model and the concept of equivalent initial flaw size. These corrected prediction approaches can be used effectively to predict the crack propagation under multiaxial loading. However, these approaches did not make comprehensive consideration of the impact factors. As a result, a new approach which considers the impact factors comprehensively should be proposed.
Zhu et al.[8] and Shi et al.[9] proposed an estimation approach of residual fatigue life based on multiple factors correction. The quantitative values of multiple factors were achieved. When fracture is seen as the unified failure standard, both the S-N curve and crack propagation curve can be used to reflect the fatigue properties. Cui[10] and Lam et al.[11] proposed that the crack propagation curve can be achieved by transforming the S-N curve after finding the threshold between the initiation process and the propagation process. The stress concentration factor is an important parameter in the conversion process. The proposed estimation approach[8-9] includes the factor for reflecting the degree of stress concentration. Therefore, the corrected estimation approach can be used to reflect the process of crack propagation.
In this paper, the corrected prediction approach of crack propagation is proposed, and it is also implemented in a case study. The effects of correction factors on the results of the crack propagation are analyzed. The results calculated by the proposed approach are compared with the results of fracture mechanics and the test data by an acoustic emission device. Furthermore, the probabilistic method based on Weibull distribution is selected as the statistical framework to evaluate the precision of the proposed approach.
The relationship of structure factor, stress ratio, loading type, manufacture processing factor and the residual fatigue life of crack propagation process can be expressed as
(1)
where σ is the cyclic stress; σm is the mean stress; ![]() ; σmax is the maximum stress; σmin is the minimum stress; σu is the ultimate tensile strength; Kt is the stress concentration coefficient; β is the surface quality coefficient; m and C are material constants; CL is the loading type coefficient; N is the fatigue life.
; σmax is the maximum stress; σmin is the minimum stress; σu is the ultimate tensile strength; Kt is the stress concentration coefficient; β is the surface quality coefficient; m and C are material constants; CL is the loading type coefficient; N is the fatigue life.
Kt is the parameter in the calculation, which can be used to represent the crack propagation process.
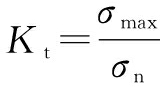
(2)
Nominal stress σn[12]can be expressed as
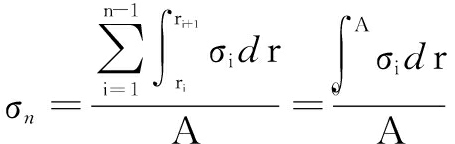
(3)
where σi is the stress amplitude of points in the stress field; r is the distance between arbitrary point under the stress field and the maximum stress point; A is the limit
radius of the stress field, A=rmax.
Stress on the crack tip in the direction of the crack extension, σi[13], can be expressed as
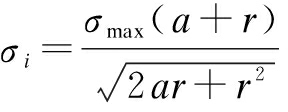
(4)
where a is the crack propagation length.
Substituting Eqs.(3) and (4) into Eq.(2), the stress concentration factor can be obtained by

(5)
Finally, substituting Eq.(5) into Eq.(1), the crack length a is expressed as
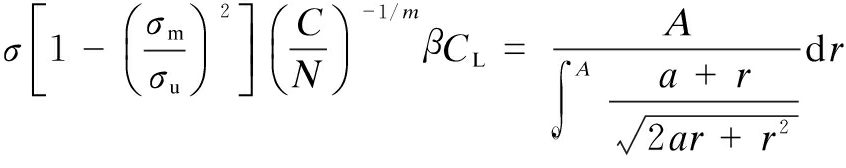
(6)
Each processing type has different influences on the crack propagation of the structure. The surface quality coefficient corresponding to the common processing method[14]is shown in Tab.1. The loading type coefficient is used to modify the influence of working loading on the crack propagation.
Tab.1 The surface quality coefficient corresponding to the common processing method

ProcessingmethodStrength/MPaCoefficientofsurfacequalityβKt=0Kt≤1.5Kt≥2.0 Highfrequencyquenching600-800800-10001.3-1.51.4-1.51.8-2.21.5-2.01.7-2.7 Surfacenitridingtreatment900-12001.1-1.31.5-1.71.7-2.1 Carburizingtreatment400-6001.8-2.03.03.1-3.7700-8001.4-1.52.2-2.62.9-3.2 Shotblasting600-15001.1-1.41.4-1.61.6-2.0
In order to verify the prediction accuracy of the proposed approach, the case structure as shown in Fig.1 is predicted based on multiple factors correction. The dimension of the structure is shown in Tab.2. The material is Q235, and the performance parameters of the material are shown in Tab.3.
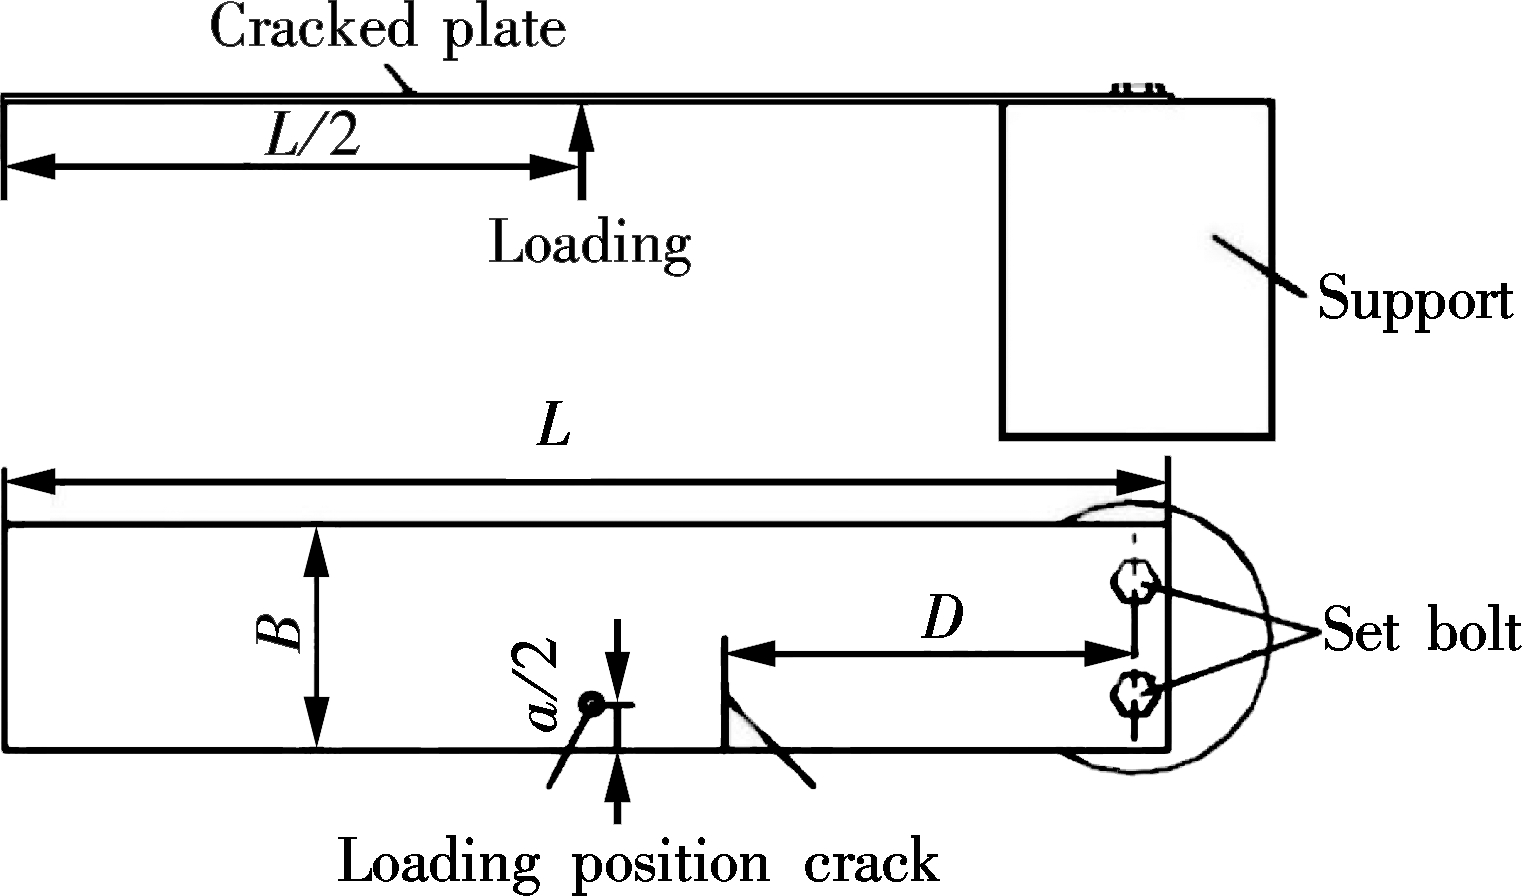
Fig.1 Case structure
Tab.2 The size of instance structure
mm
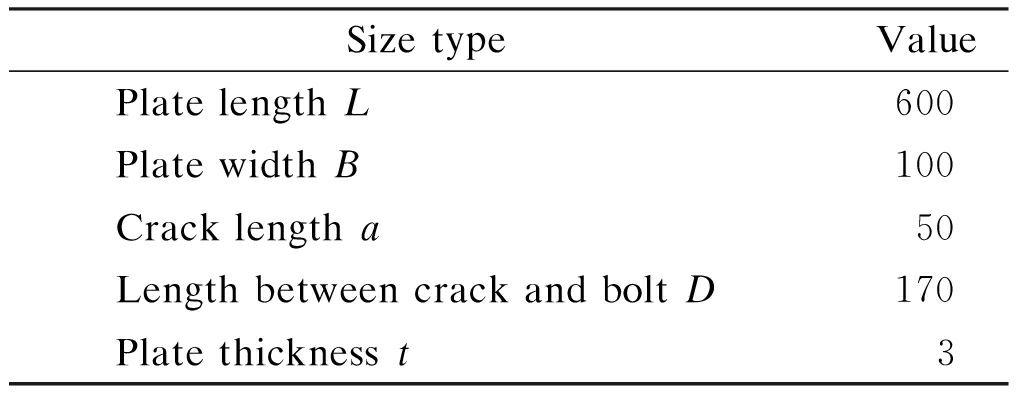
SizetypeValue PlatelengthL600 PlatewidthB100 Cracklengtha50 LengthbetweencrackandboltD170 Platethicknesst3
Tab.3 The mechanical parameters of the material

ParameterR0.2/MPaRm/MPaElongationA/%Value23750022
First, the 3D model of the case structure is created by using the Pro-e software. Then, the 3D model is imported into the ANSYS software for the solution of equivalent stress. Finally, the stress nephogram is obtained as shown in Fig.2. It can be found in Fig.2 that the maximum stress occurs in the crack tip, and the value of which is 163.49 MPa.
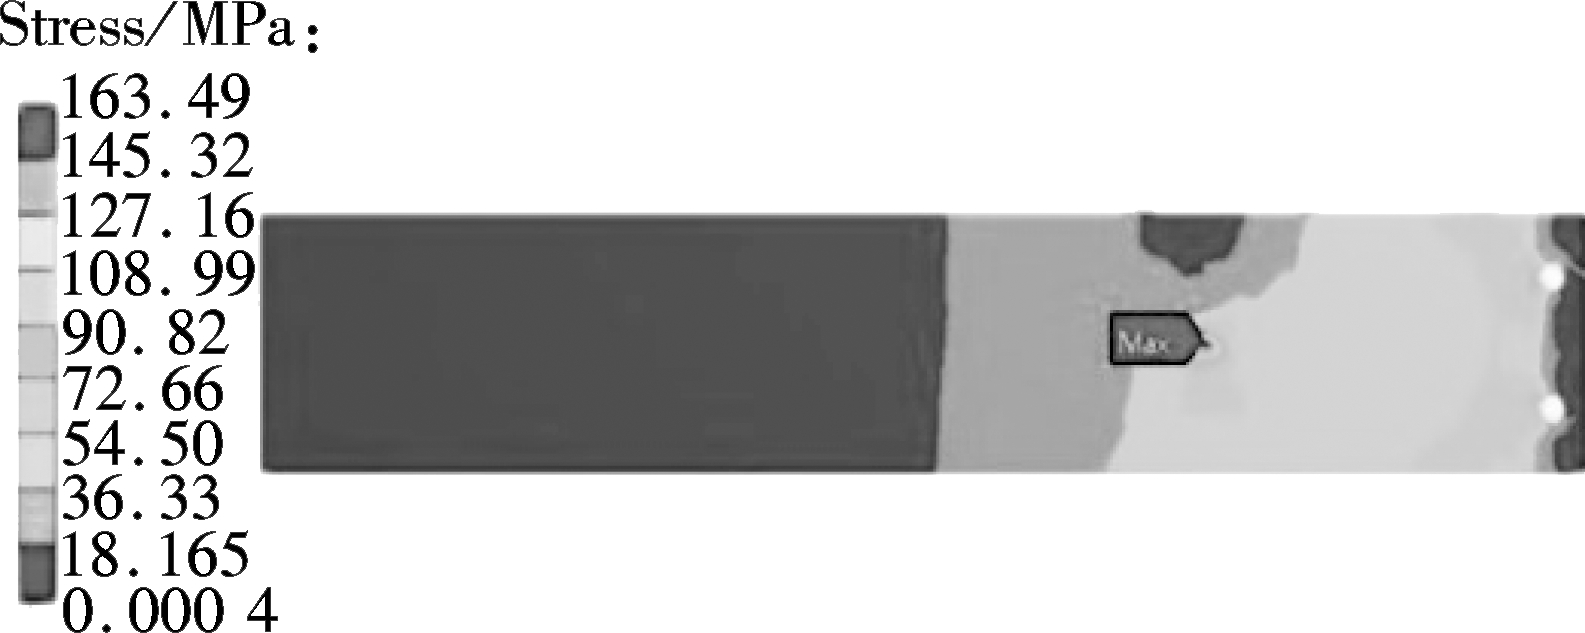
Fig.2 Stress nephogram of case structure
The relationship between stress and fatigue cycles can be expressed as
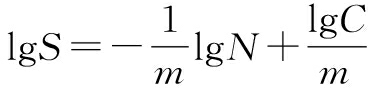
(7)
where S is the stress amplitude; m and C are material constants; N is the number of fatigue cycles.
Eq.(7) shows that the linear slope of the logarithmic relationship between stress amplitude and fatigue cycles is ![]() , and the intersection value of the logarithmic relationship is
, and the intersection value of the logarithmic relationship is ![]() .
.
The logarithmic relationship between stress amplitude and fatigue cycles as shown in Fig.3 is obtained through the fatigue test. The basic performance parameters C and m are calculated according to Eq.(7).
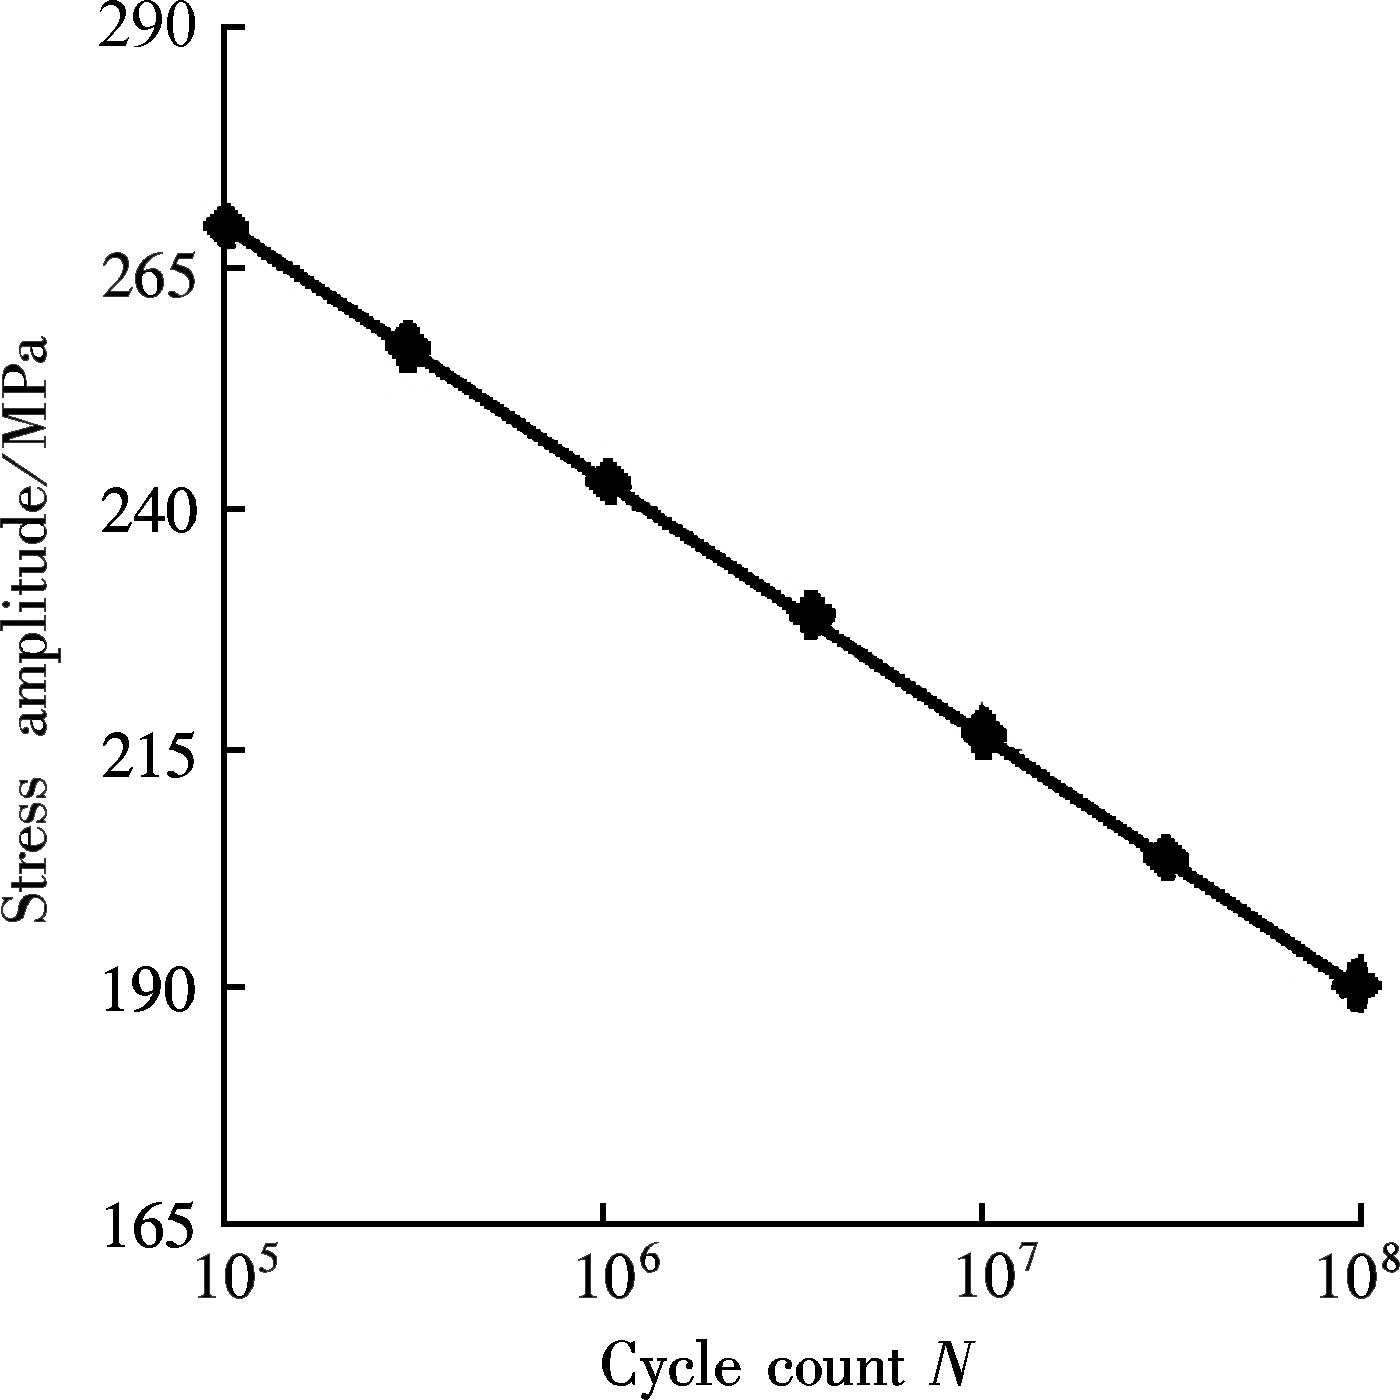
Fig.3 Logarithmic relationship between stress amplitude and fatigue cycles
Also, the calculation of correction coefficient is important for the study. The surface quality coefficient (SQC) of the case is 1.6 according to Tab.1. According to Ref.[15], the loading type coefficient (LTC) corresponding to uniaxial load is 1, and the coefficient corresponding to the bending load is 0.8. Finally, the result as shown in Fig.4 is obtained by substituting the initial parameters into a program.
The LTC and SQC are the principal correction factors in
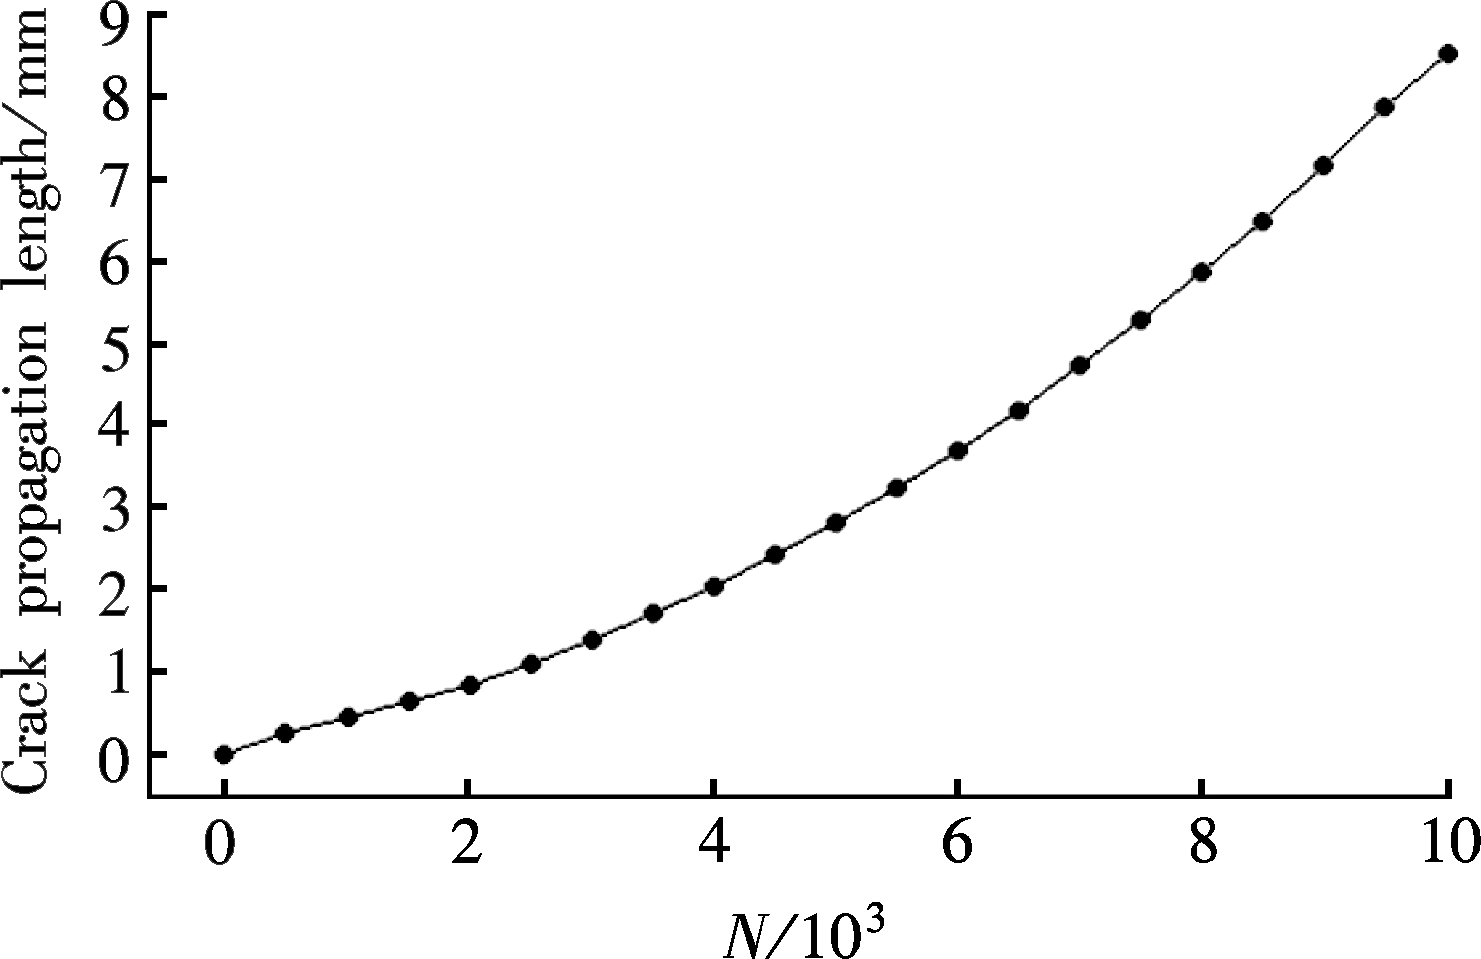
Fig.4 Simulation result of crack propagation
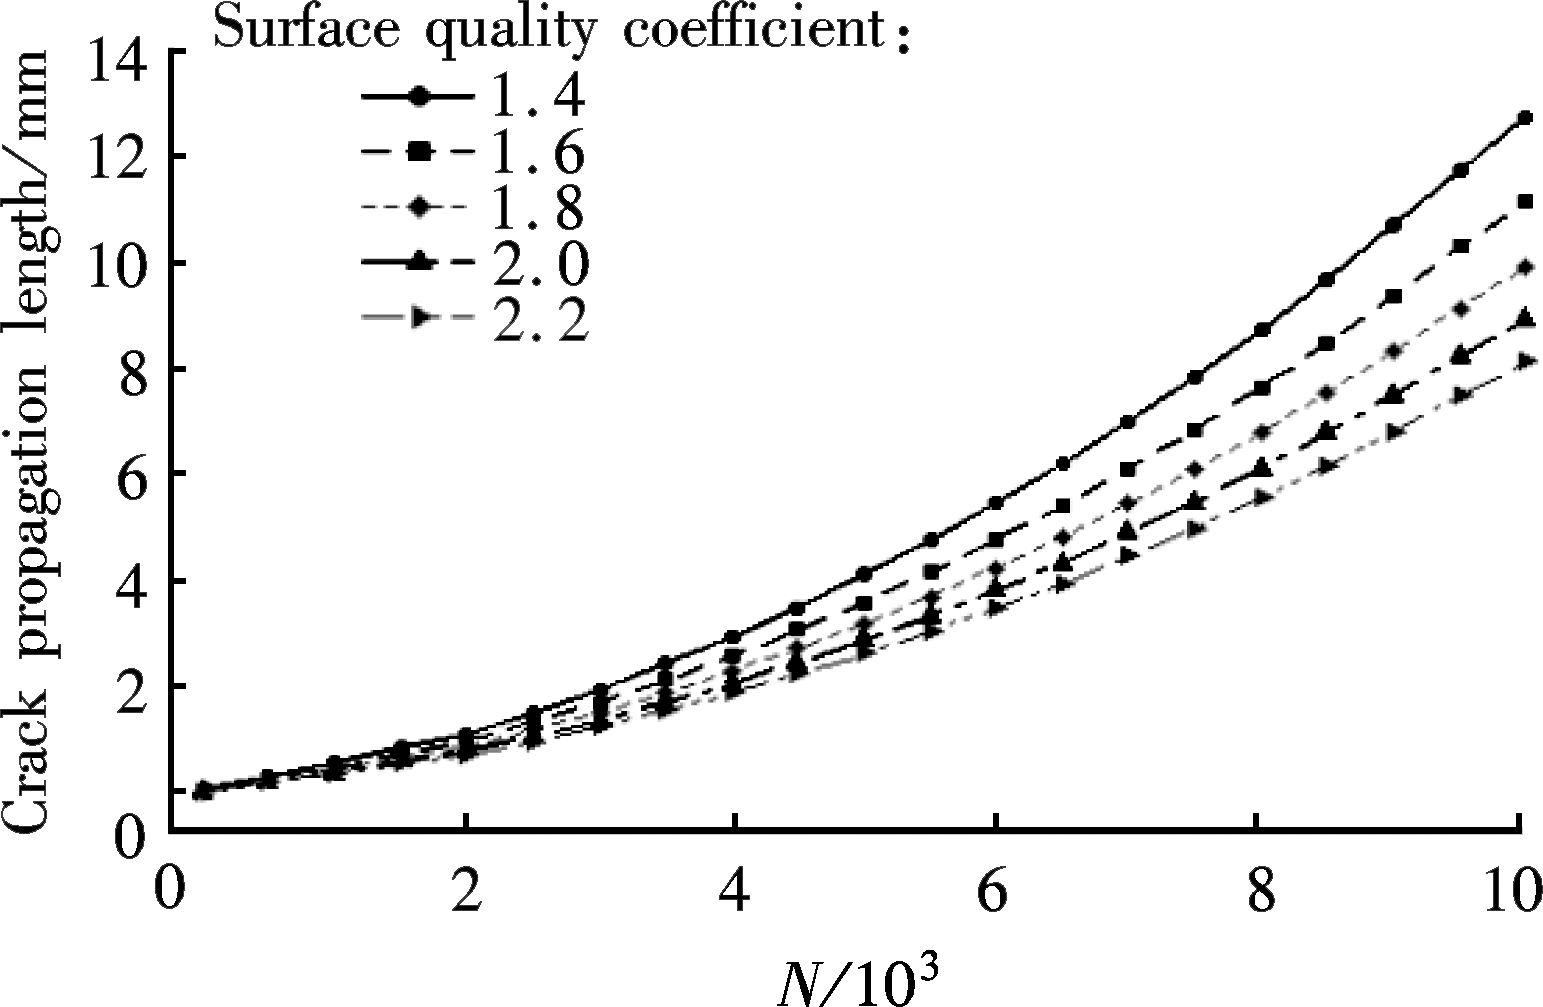
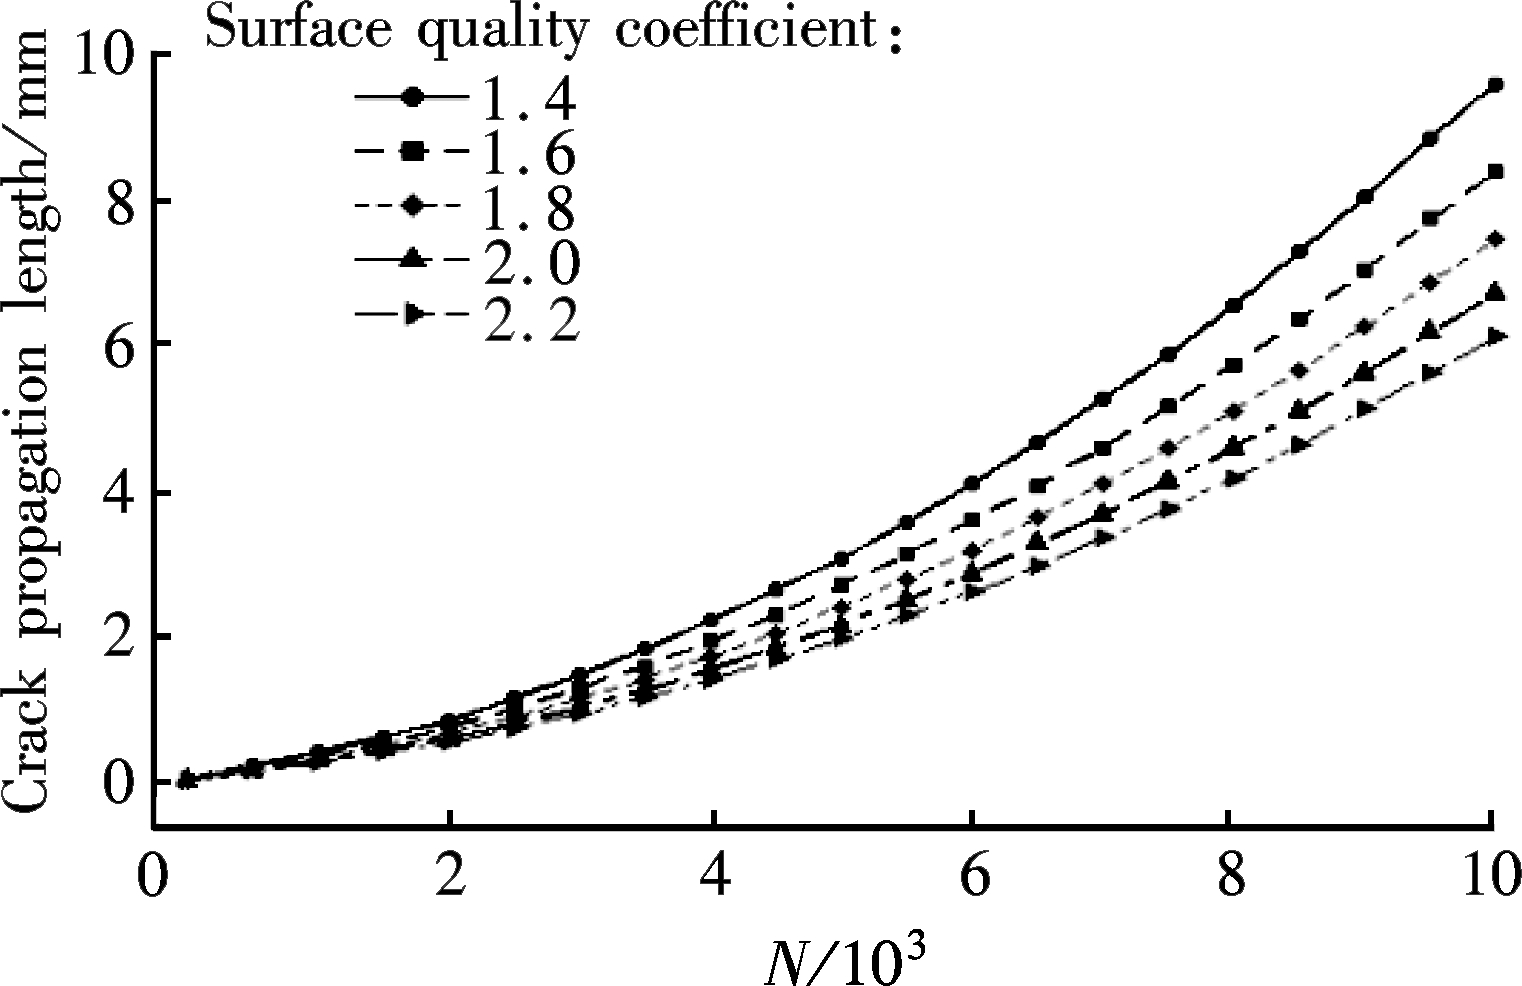
the numerical procedure. Therefore, it is necessary to analyze the influence of factors on the result. Different groups of SQC parameter and LTC parameter are utilized for the analysis. The SQC is selected as 1.4, 1.6, 1.8, 2.0, 2.2, and the LTC is selected as 0.6, 0.8, 1.0, 1.2 and 1.4. Then, the influence of the SQC on the crack propagation is achieved by the corrected approach, as shown in Fig.5. It can be found from Fig.5 that the crack propagation decreases with the increase of the SQC when the LTC is determined.
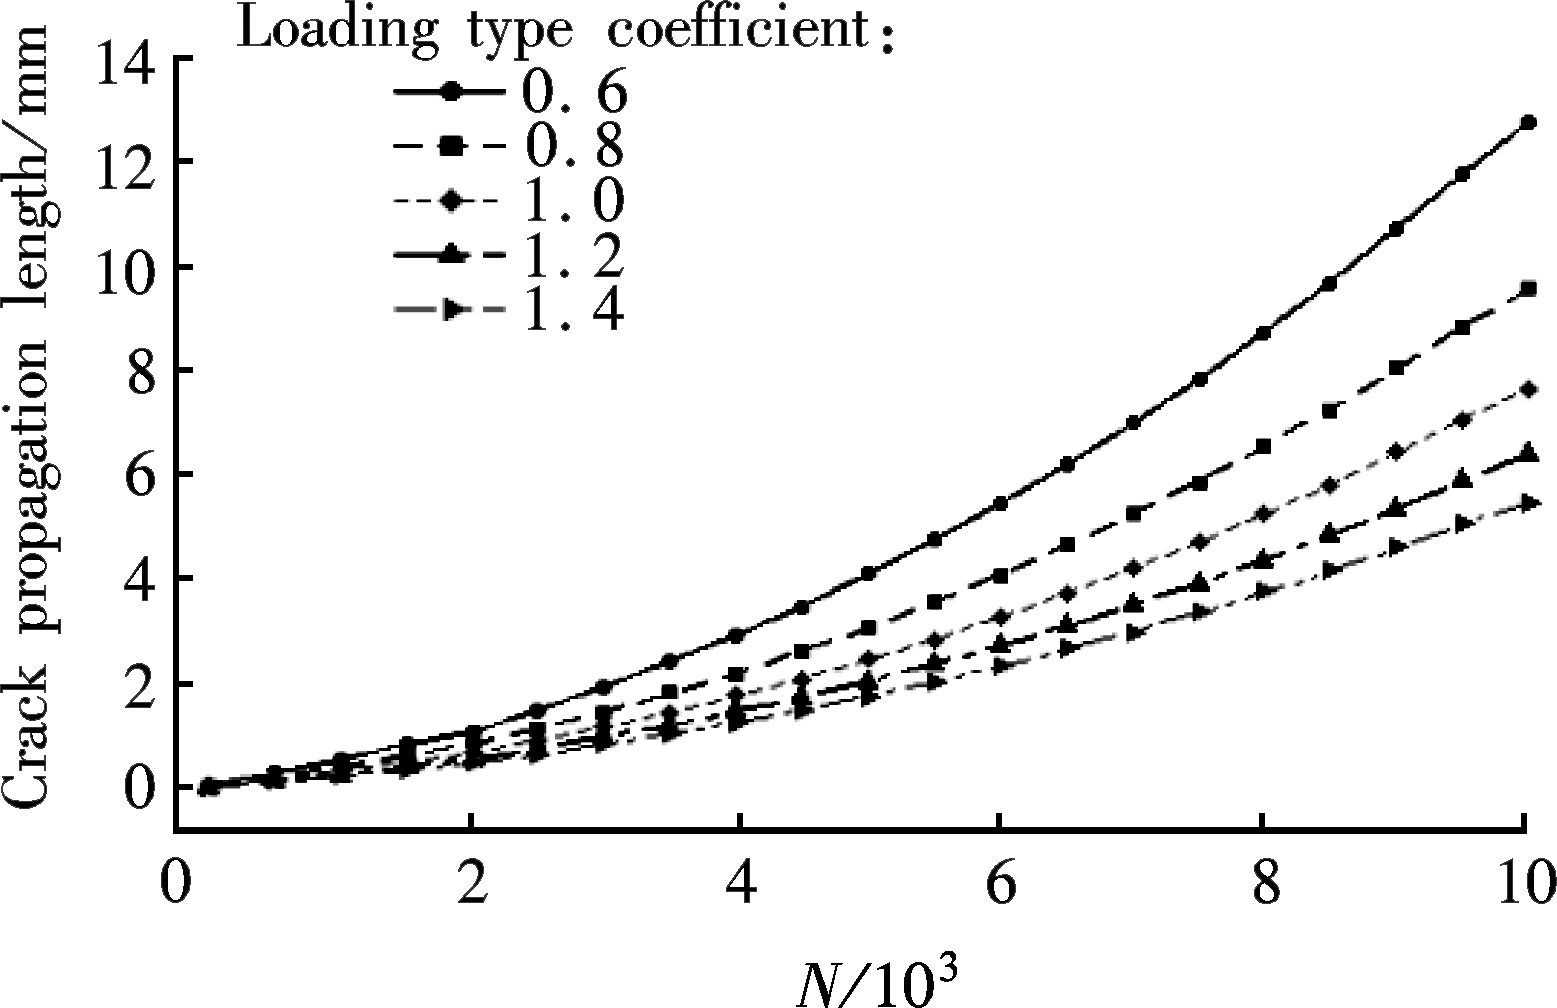
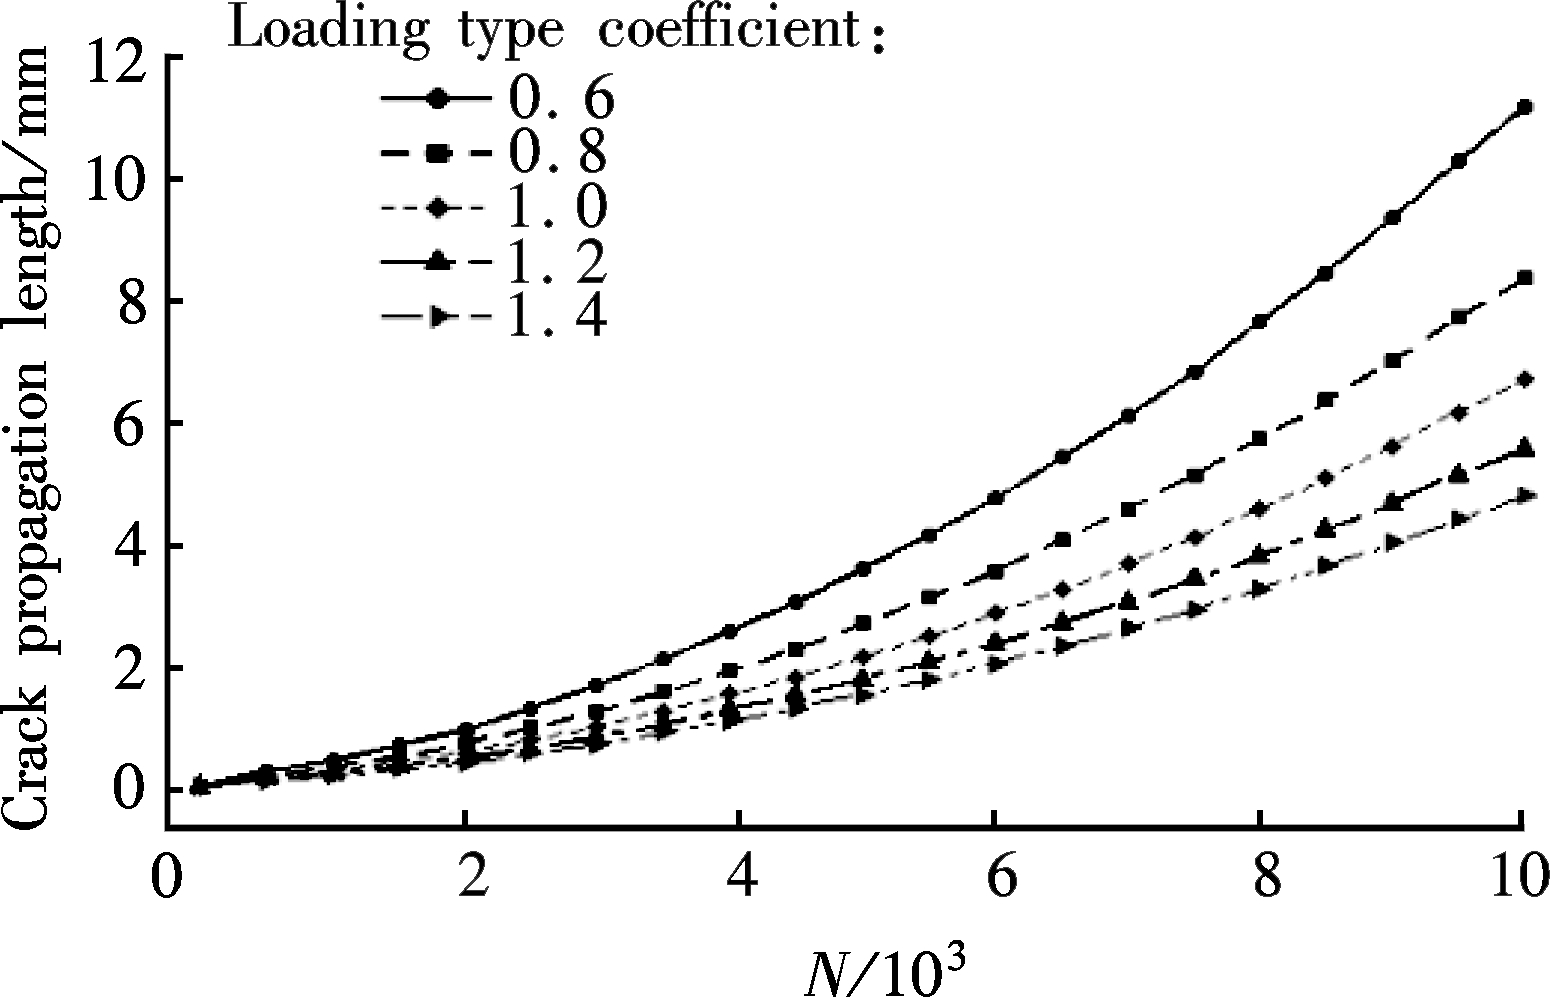
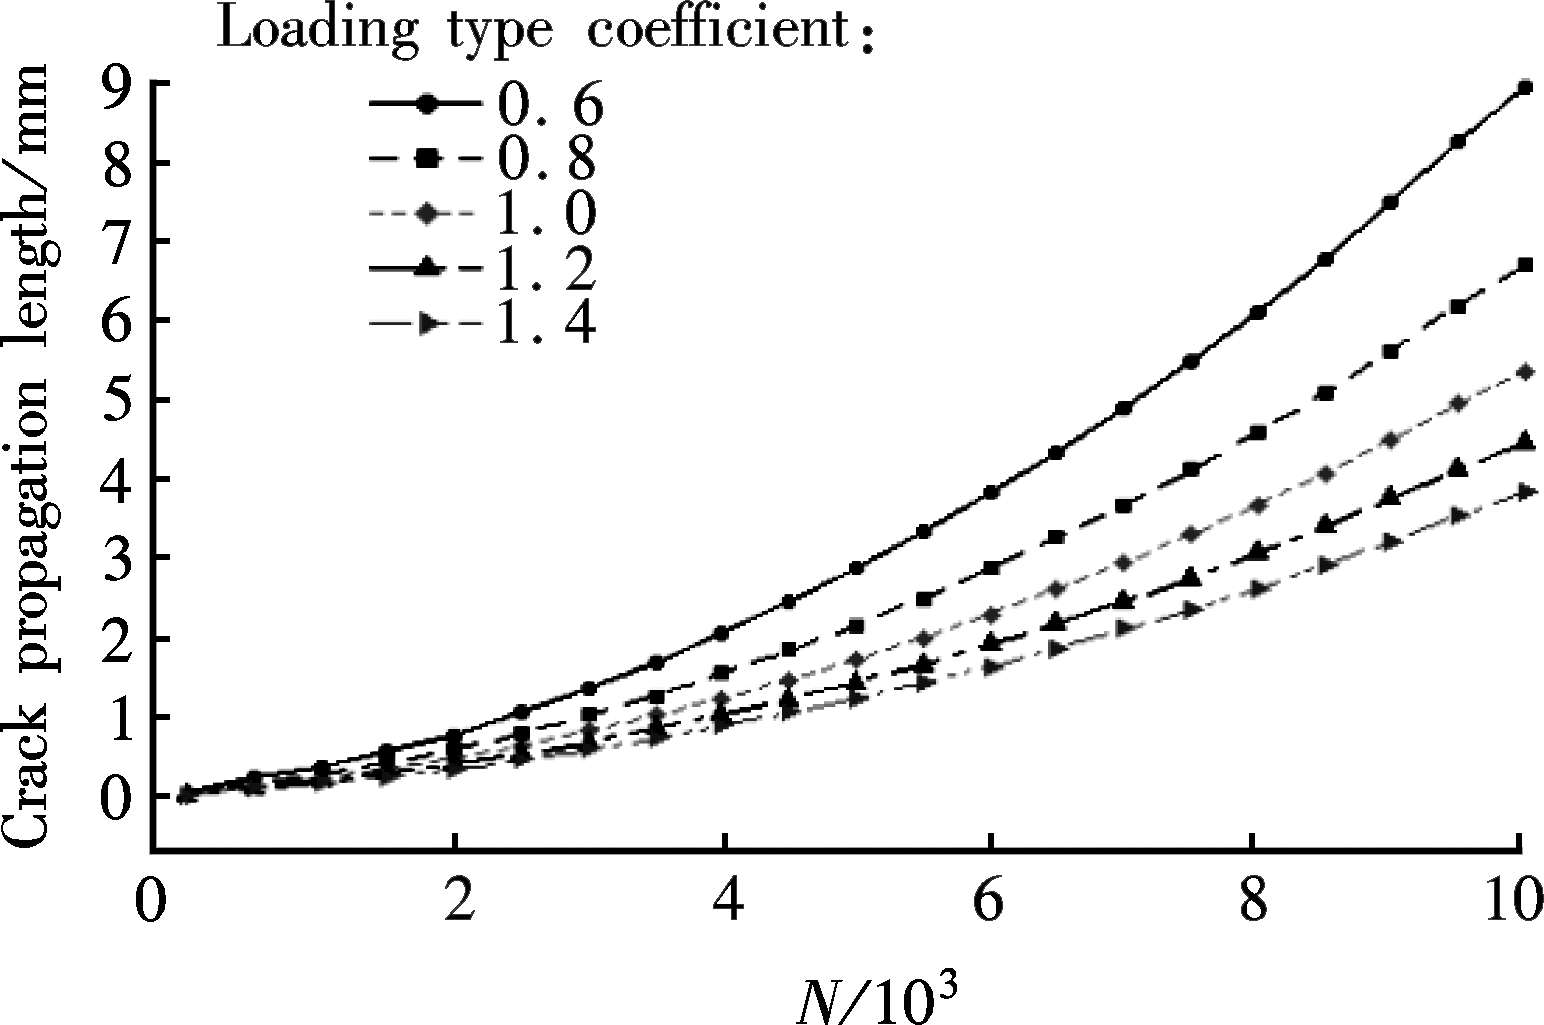
Also, the influence of the LTC on the crack propagation is obtained by the corrected approach, as shown in Fig.6. It can be found that the crack propagation length of the case structure decreases with the increase of the LTC when the SQC is determined.
4.1 Experimental plan
The SAMOS PCI-8 AE device is used for the long term monitoring of the crack propagation process in the experiment study. The system parameters of the AE experiment are shown in Tab.4.
Tab.4 The system parameters of AE experiment

ParameterValue Samplingfrequency/MHz2 Thresholdvalue/dB32 Digitalfilterfrequency/kHz1-400 Wavelength/nm4096 Triggerrate/(bit·s-1)512
A broadband, resonant-type, electric transducer from the physical acoustics corporation (PAC), called PICO, is used as the AE sensor. The sensor has a resonance frequency of 480.58 kHz and an optimum operating range of 100-750 kHz. To improve the signal transmission between the instance structure and sensor, vacuum silicon grease is used. The location of the sensor arrangement is shown in Fig.7. The arrangement of sensors, the instance structure, the loading device and the acoustic emission device is shown in Fig.8.
4.2 Result and precision comparison
After the process of processing the emission signal, the test data of the crack propagation is obtained. The test data shows some uncertainty corresponding to the fixed load cycle. The probabilistic method based on Weibull distribution is selected as the statistical framework to evaluate the precision of the corrected estimation approach, which is more suitable for the estimation of crack propagation[16].
(a)
(b)

(c)

(d)
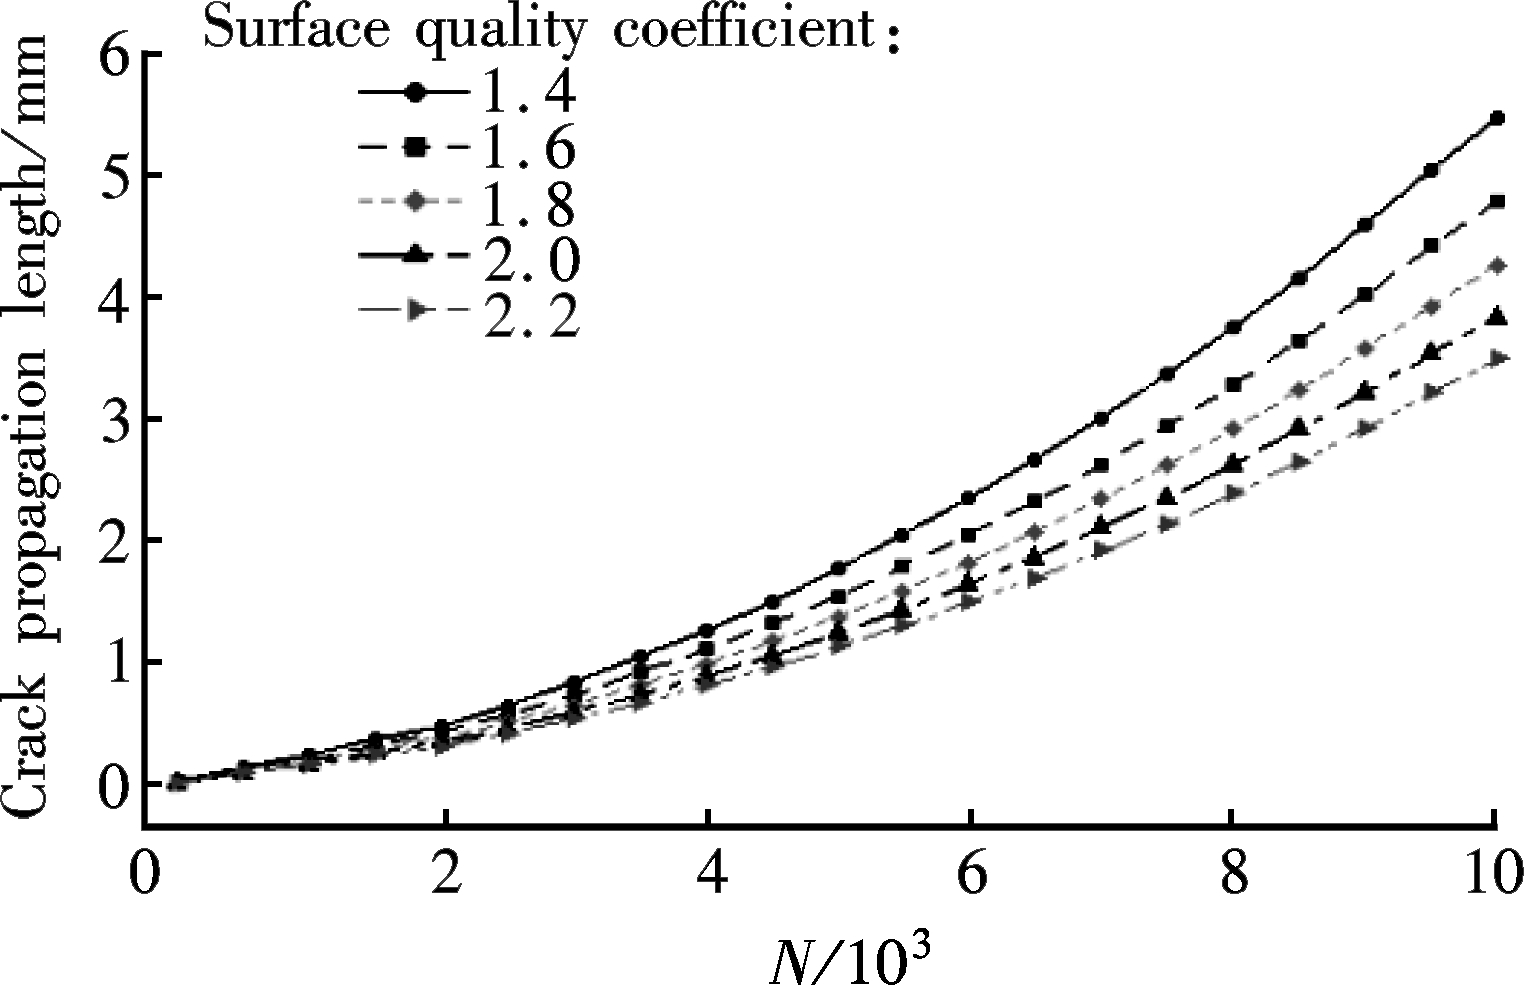
(e)
Fig.5 Influence of SQC on crack propagation. (a) LTC=0.6; (b) LTC=0.8; (c) LTC=1.0; (d) LTC=1.2; (e) LTC=1.4
(a)
(b)

(c)
(d)
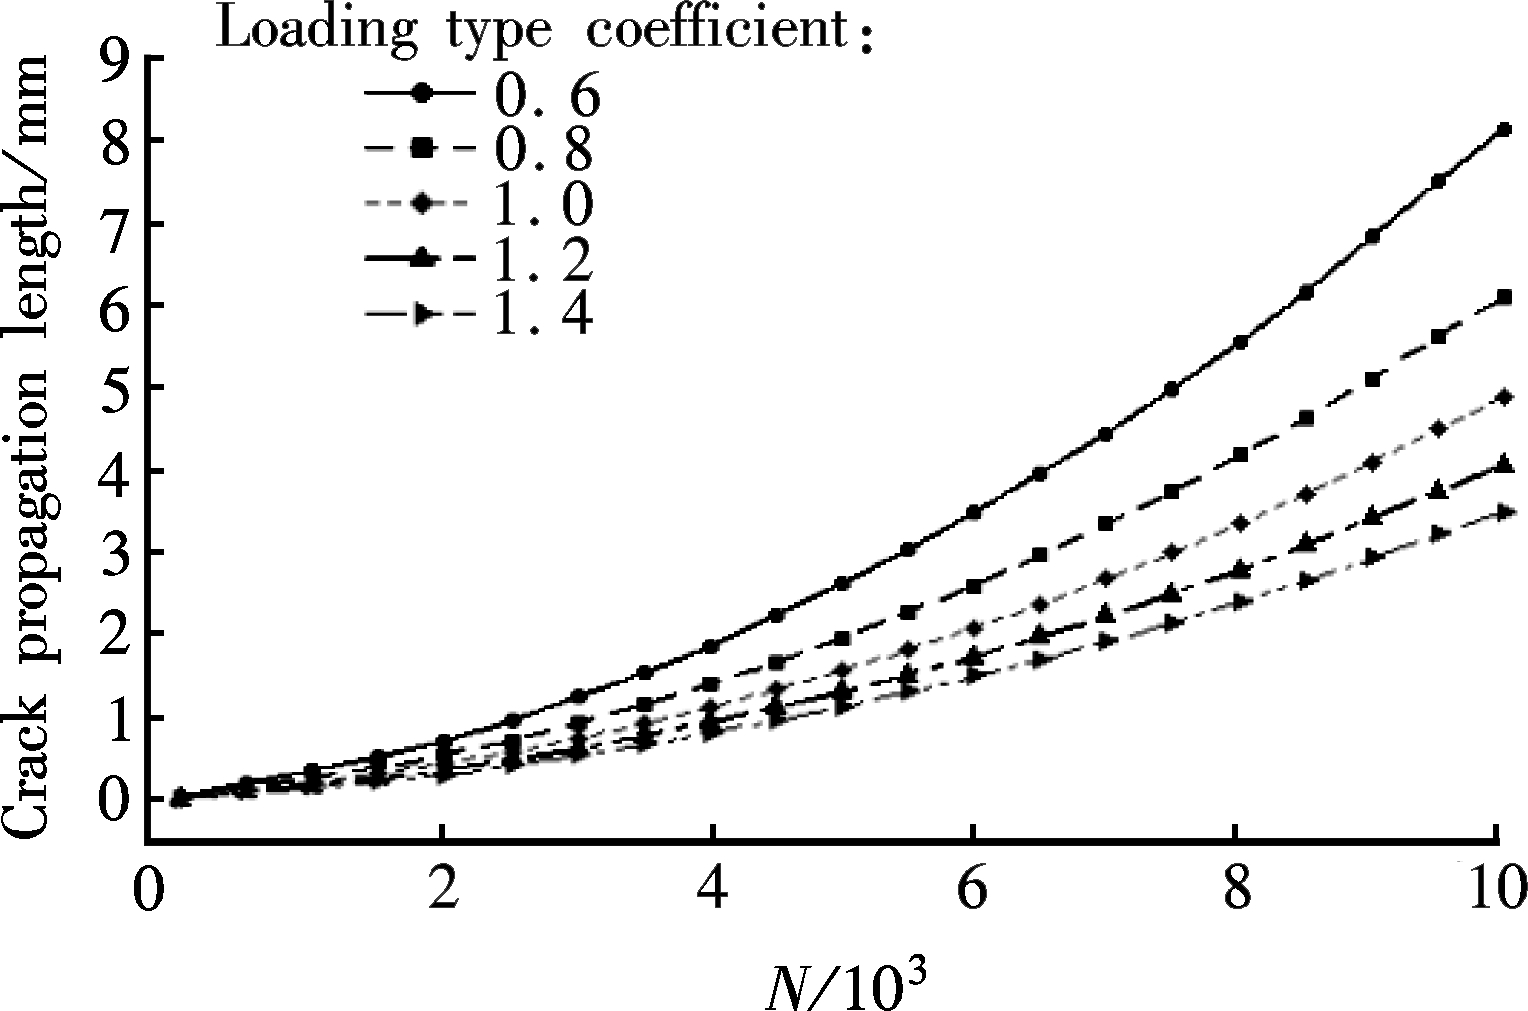
(e)
Fig.6 Influence of LTC on crack propagation. (a) SQC=1.4; (b) SQC=1.6; (c) SQC=1.8; (d) SQC=2.0; (e) SQC=2.2
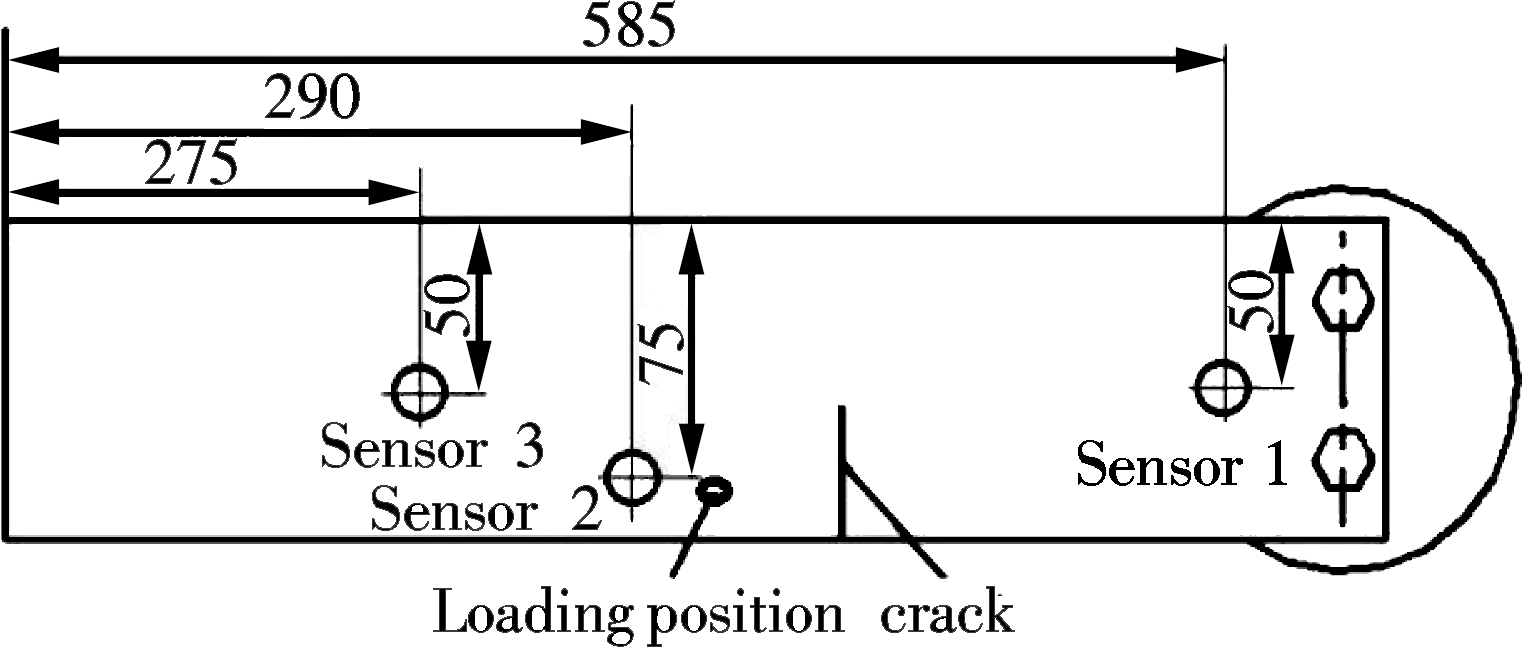
Fig.7 Location of the sensor arrangement (unit: mm)
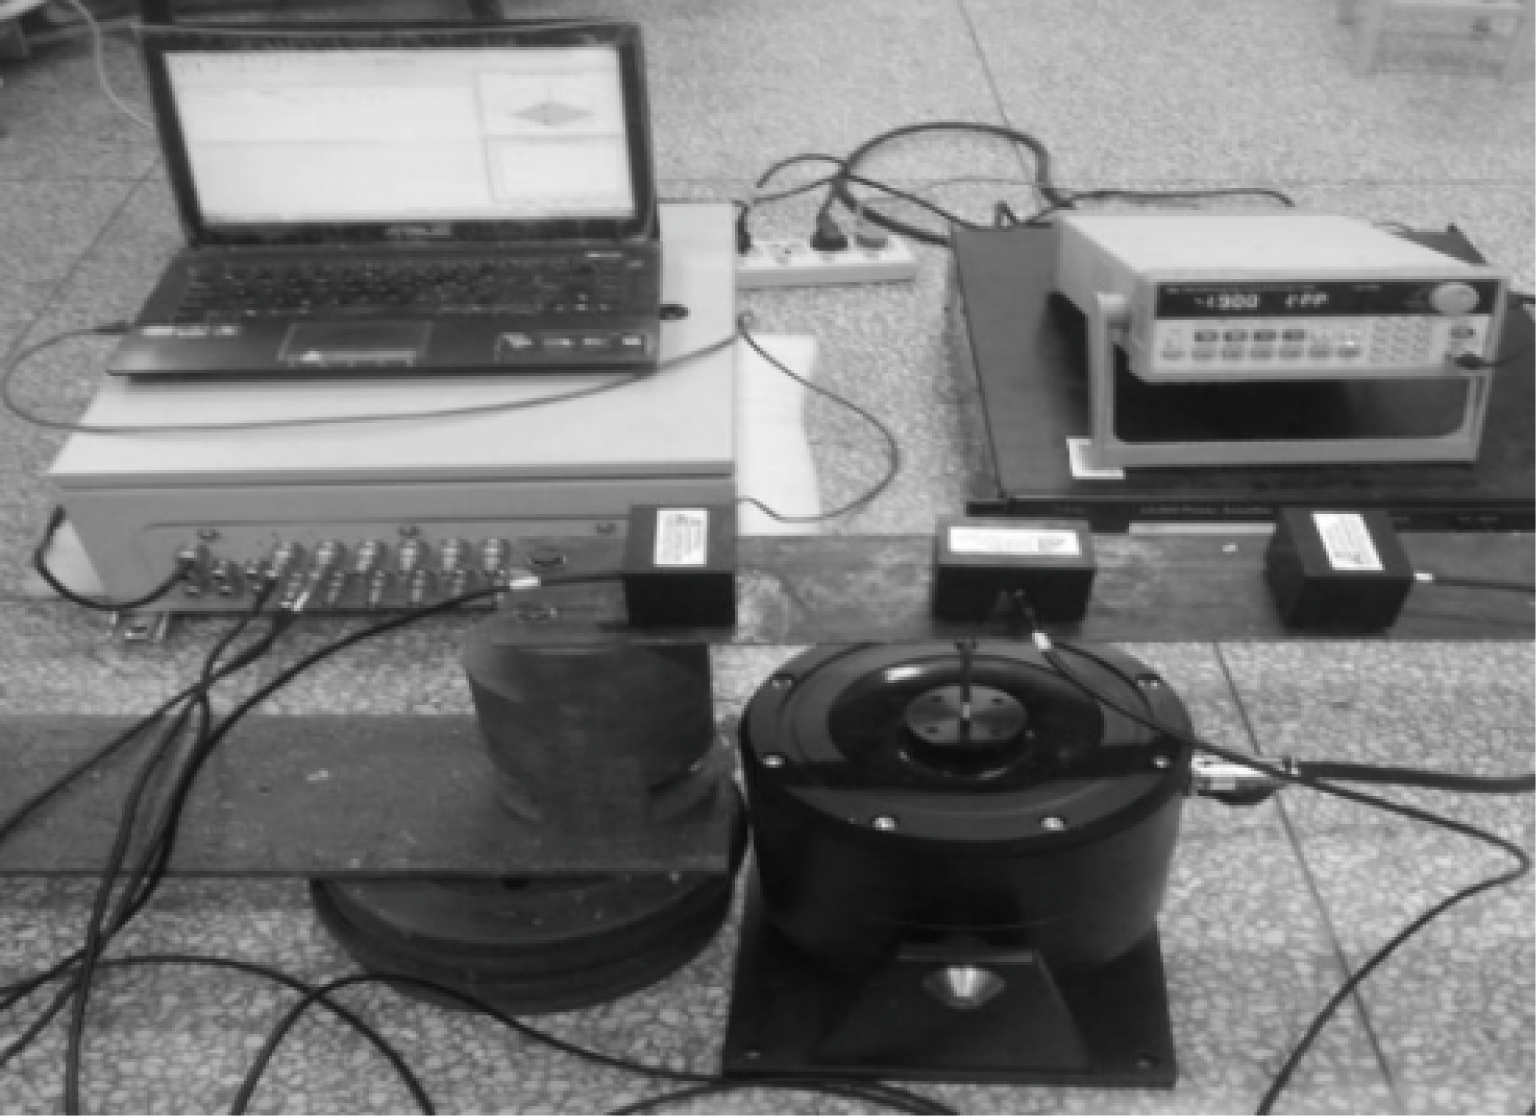
Fig.8 Process of crack propagation test
The distribution function F(x) and the probability density function (PDF) f(x) of the Weibull distribution can be expressed as
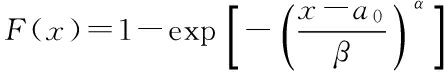
(8)
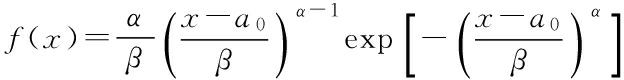
(9)
where α is the shape parameter; β is the scale parameter; a0 is the position parameter.
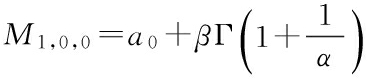
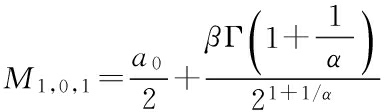
The Weibull parameters of the test data corresponding to the fixed load cycle can be calculated by the probability weighted moment method[17]. The probability weighted moment function can be expressed as
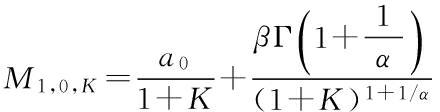
(10)
where M is the probability weighted moment function; Γ is the Gamma function; K=0, 1, 3.
(11)
(12)
(13)
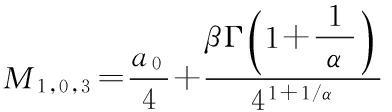
Therefore, the Weibull distribution parameter α, β, a0 can be expressed as
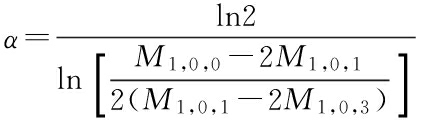
(14)

(15)
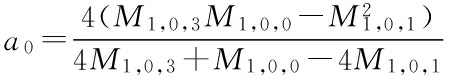
(16)
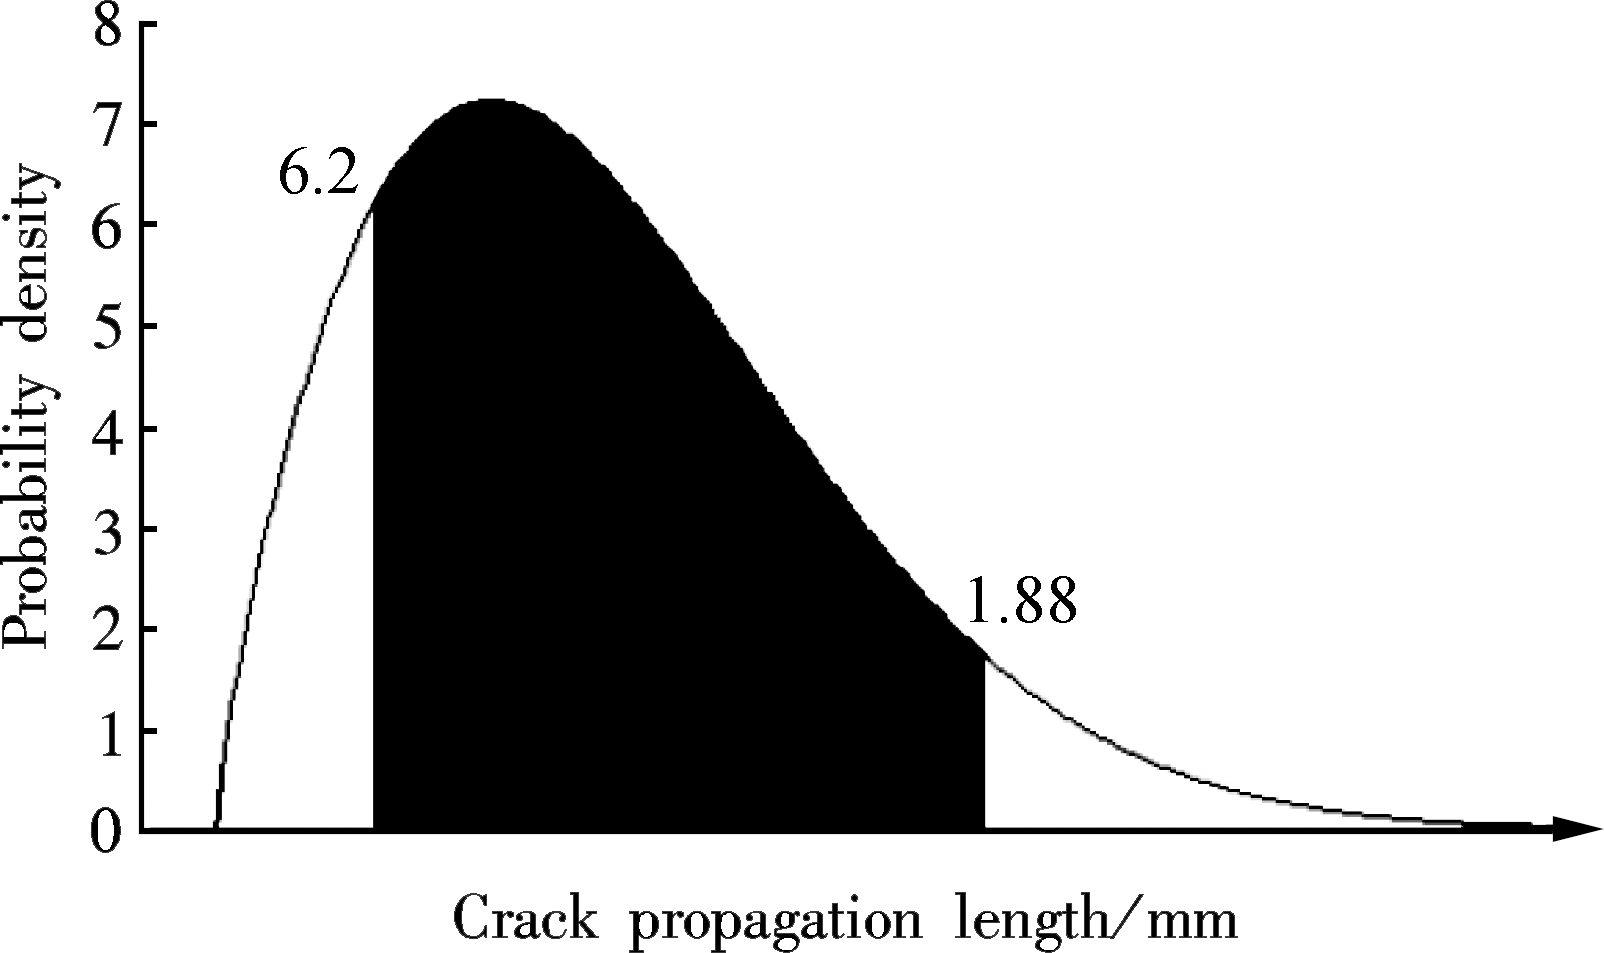
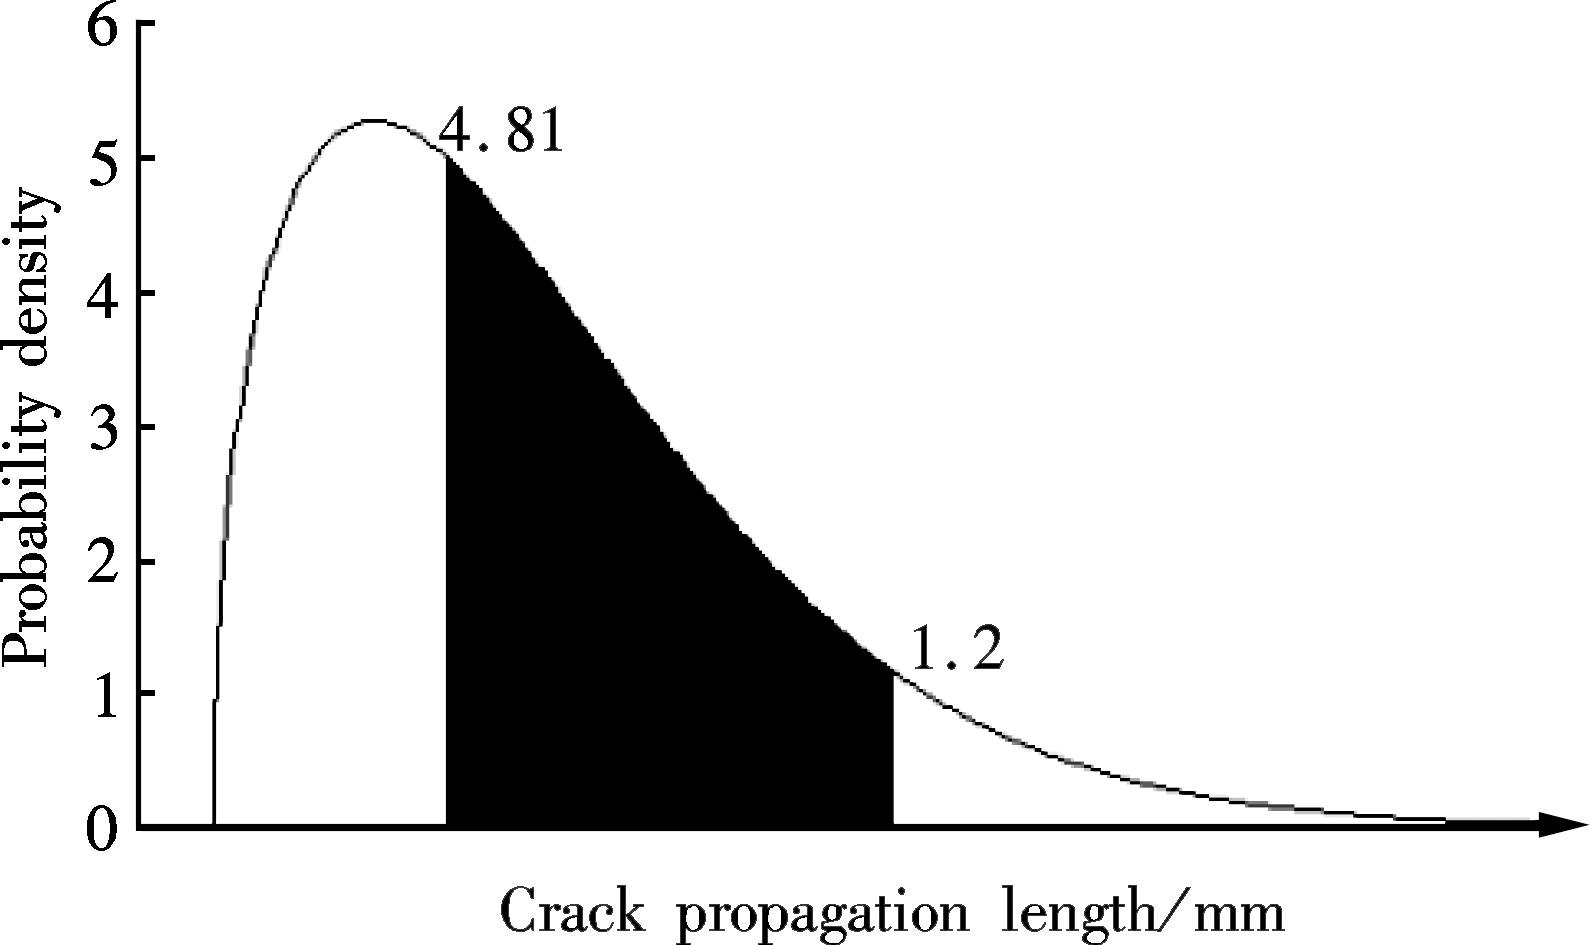
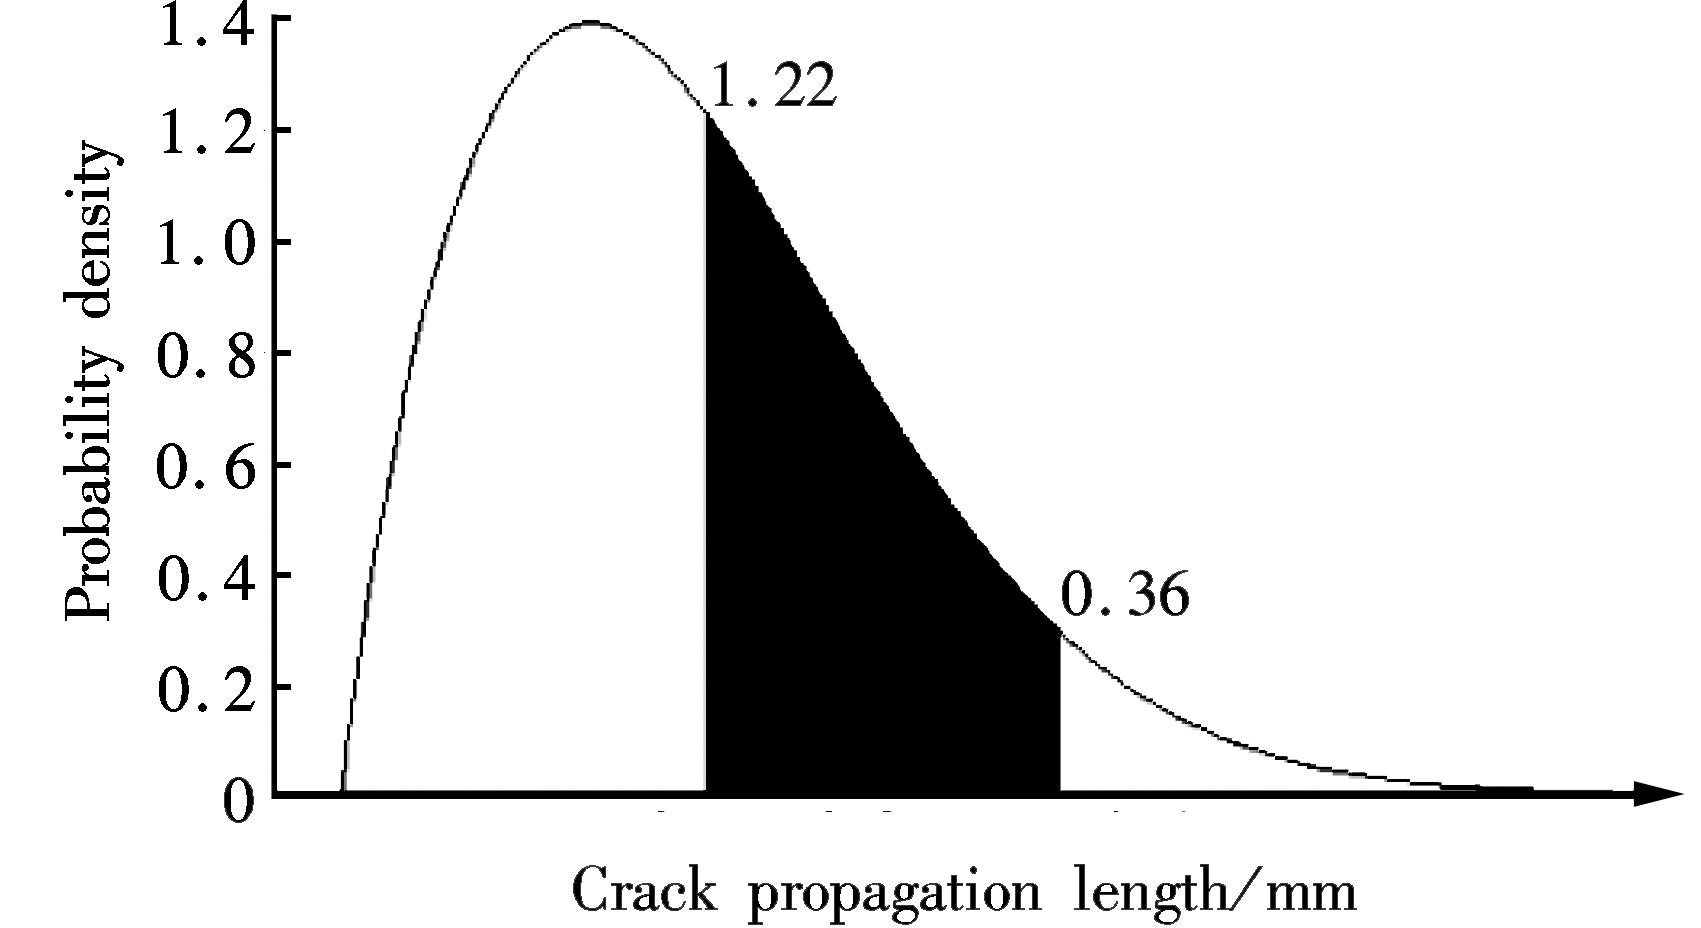
Then, the Weibull parameters of the test data corresponding to the fixed load cycle are calculated and shown in Tab.5. Also, the probabilistic density of the test data is shown in Fig.9. In order to further evaluate the precision of the corrected estimation approach, fracture mechanics is also used. Different results are compared as shown in Fig.9.
Tab.5 The Weibull distribution parameter of test data
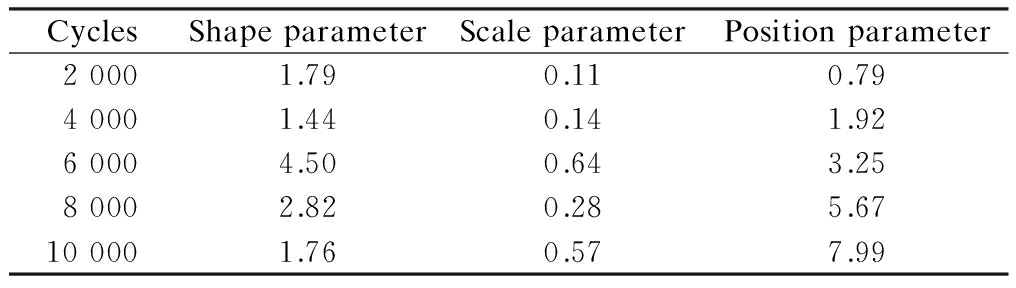
CyclesShapeparameterScaleparameterPositionparameter20001.790.110.7940001.440.141.9260004.500.643.2580002.820.285.67100001.760.577.99
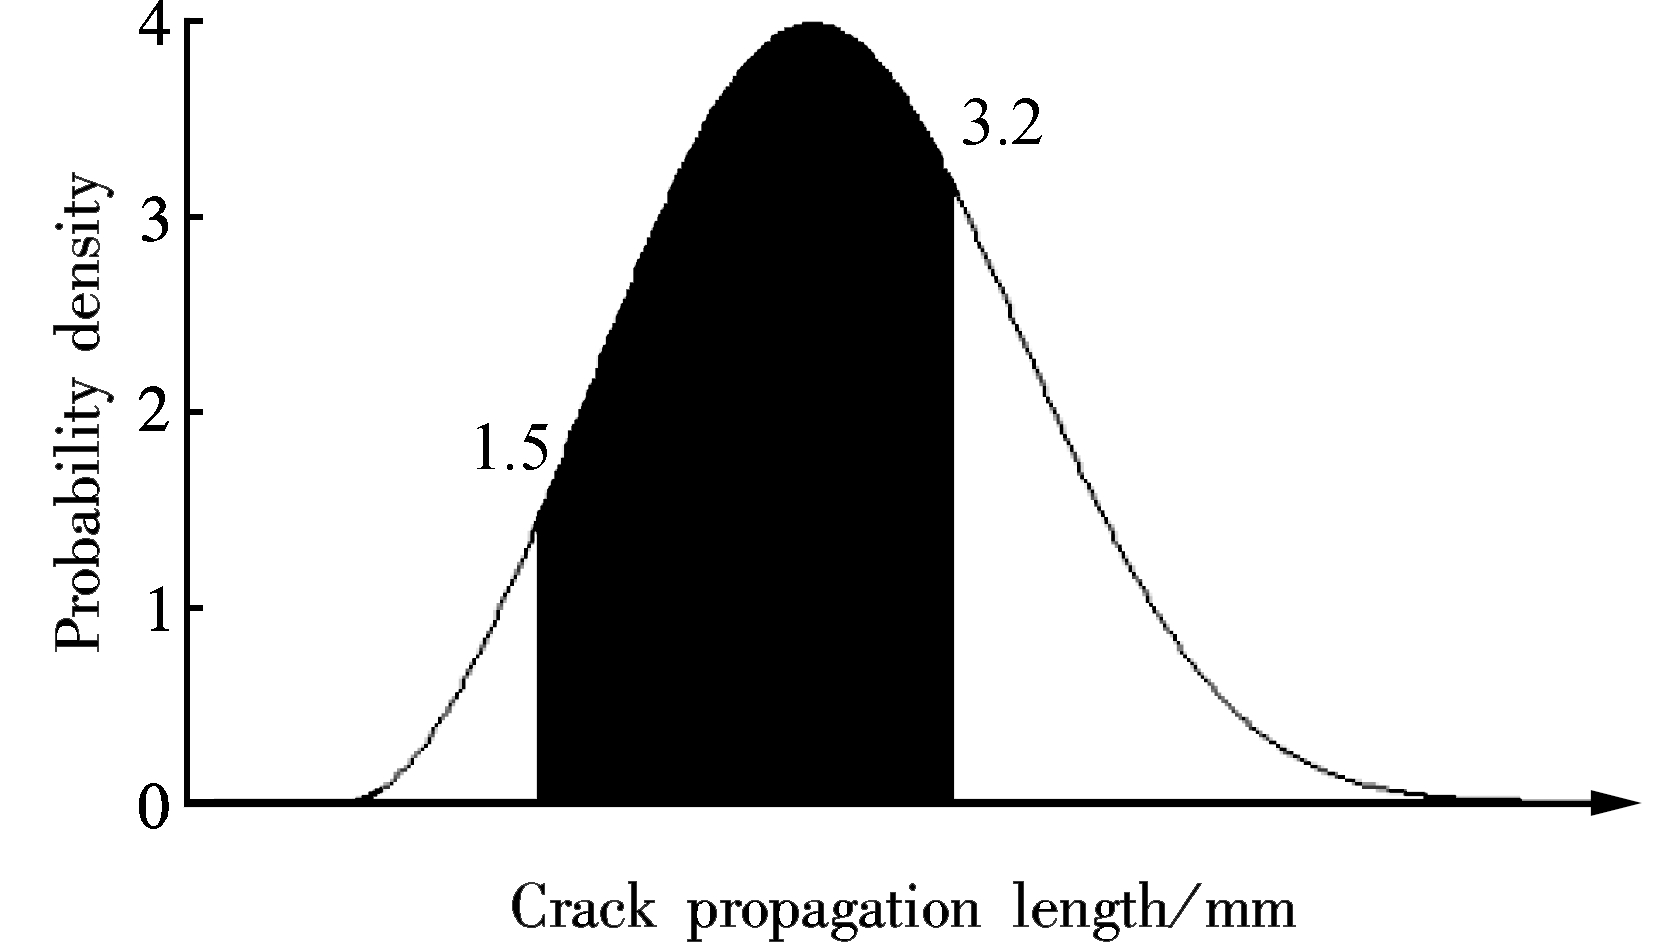
The probability density of the different results is shown in Tab.6. It can be found from Tab.6 that the probability density of the results estimated by the corrected approach is greater than that by fracture mechanics. Therefore, the results estimated by the corrected approach are more precise than those estimated by fracture mechanics, and they are closer to the test data.
Tab.6 The probability density of results
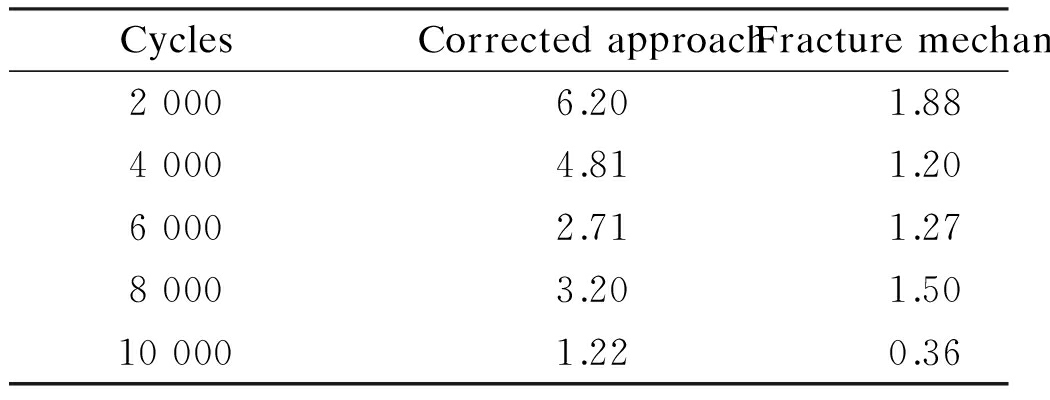
CyclesCorrectedapproachFracturemechanics20006.201.8840004.811.2060002.711.2780003.201.50100001.220.36
It can be found from Tab.6 that the results estimated by fracture mechanics show some discrepancy with the test data. The original estimation method based on fracture mechanics can be used effectively for the estimation under constant loading. However, the original fracture mechanic method takes less account of the influencing factors, and cannot be quantitatively corrected by the influencing factors at the same time.
(a)
(b)

(c)
(d)
(e)
Fig.9 The comparison of results obtained by the corrected model and fracture mechanics. (a) 2 000 cycles; (b) 4 000 cycles; (c) 6 000 cycles; (d) 8 000 cycles; (e) 10 000 cycles
1) A crack propagation prediction approach based on multiple factors correction is achieved by the estimation approach of residual fatigue life based on multiple factors correction. Then, the quantitative expressions among the structure factor, stress ratio, loading type, the manufacturing processing method and the crack propagation are achieved.
2) The crack propagation of a case is calculated by the prediction approach based on multiple factors correction. The influence of the correction factor on the crack propagation is studied. It can be found from the results that the crack propagation length decreases with the increase of LTC and SQC.
3) The AE device is used for the long term monitoring of the crack propagation in this experiment study. The probabilistic method based on the Weibull distribution is selected as the statistical framework to process the data. Then, the probability densities of the results estimated by the corrected approach and the results estimated by fracture mechanics are calculated by the probability density function. The comparisons show that the results estimated by the corrected approach are more precise than those estimated by fracture mechanics.
[1]Ibrahim R A. Overview of structural life assessment and reliability. Part Ⅰ: Basic ingredients of fracture mechanics[J]. Journal of Ship Production and Design, 2015, 31(1): 1-42. DOI:10.5957/jspd.31.1.130025-1.
[2]Stasevic M, Maksimovic S, Geric K, et al. Fatigue crack propagation models: Numerical and experimental comparisons[J]. Technics Technologies Education Management, 2012, 7(2): 801-810.
[3]Carter B J, Schenck E C, Wawrzynek P A, et al. Three-dimensional simulation of fretting crack nucleation and growth[J]. Engineering Fracture Mechanics, 2012, 96: 447-460. DOI:10.1016/j.engfracmech.2012.08.015.
[4]Zhang J K, Cheng X Q, Li Z N. Total fatigue life prediction for Ti-alloys airframe structure based on durability and damage-tolerant design concept[J]. Materials & Design, 2010, 31(9): 4329-4335. DOI:10.1016/j.matdes.2010.03.052.
[5]Wang Y Y, Yao W X. Evaluation and comparison of several multiaxial fatigue criteria [J]. International Journal of Fatigue, 2004, 26(1): 17-25. DOI:10.1016/s0142-1123(03)00110-5.
[6]Esmaeili F, Chakherlou T N, Zehsaz M. Prediction of fatigue life in aircraft double lap bolted joints using several multiaxial fatigue criteria [J]. Materials & Design, 2014, 59: 430-438. DOI:10.1016/j.matdes.2014.03.019.
[7]Lu Z, Xiang Y, Liu Y. Crack growth-based fatigue-life prediction using an equivalent initial flaw model. Part Ⅱ: Multiaxial loading [J]. International Journal of Fatigue, 2010, 32(2): 376-381. DOI:10.1016/j.ijfatigue.2009.07.011.
[8]Zhu L, Jia M P, Shi G L, et al. Estimation approach of structural fatigue life based on multiple factors correction[J]. Journal of Southeast University (Natural Science Edition), 2015, 45(3): 469-473. (in Chinese)
[9]Shi G L, Zhu L, Wang R G. The fatigue life analysis for the cage of overrunning clutch based on multiple factors correction[J]. Machine Design and Research, 2015, 31(2): 70-73, 76. (in Chinese)
[10]Cui W C. Relation between crack growth rate curve and S-N curve for metal fatigue [J]. Journal of Ship Mechanics, 2002, 6(6): 93-106.
[11]Lam T S, Topper T H, Conle F A. Derivation of crack closure and crack growth rate data from effective-strain fatigue life data for fracture mechanics fatigue life predictions[J]. International Journal of Fatigue, 1998, 20(10): 703-710. DOI:10.1016/s0142-1123(98)00023-1.
[12]Cui W C, Huang X P. A general constitutive relation for fatigue crack growth analysis of metal structures [J]. Acta Metallurgica Sinica (English Letters), 2009, 16(5): 342-354.
[13]Varvani-Farahani A, Kodric T, Ghahramani A. A method of fatigue life prediction in notched and un-notched components[J]. Journal of Materials Processing Technology, 2005, 169(1): 94-102. DOI:10.1016/j.jmatprotec.2005.01.015.
[14]Petrucci G, Zuccarello B. Fatigue life prediction under wide band random loading[J]. Fatigue & Fracture of Engineering Materials & Structures, 2004, 27(12): 1183-1195. DOI:10.1111/j.1460-2695.2004.00847.x.
[15]Zhang W, Liu Y. In situ SEM testing for crack closure investigation and virtual crack annealing model development [J]. International Journal of Fatigue, 2012, 43(5): 188-196. DOI:10.1016/j.ijfatigue.2012.04.003.
![]() J, Legat A, Zajec B, et al. Detection and characterization of stainless steel SCC by the analysis of crack related acoustic emission [J]. Ultrasonics, 2015, 62: 312-322. DOI:10.1016/j.ultras.2015.06.005.
J, Legat A, Zajec B, et al. Detection and characterization of stainless steel SCC by the analysis of crack related acoustic emission [J]. Ultrasonics, 2015, 62: 312-322. DOI:10.1016/j.ultras.2015.06.005.
[17]Gagnon M, Tahan A, Bocher P, et al. A probabilistic model for the onset of high cycle fatigue (HCF) crack propagation: Application to hydroelectric turbine runner [J]. International Journal of Fatigue, 2013, 47: 300-307. DOI:10.1016/j.ijfatigue.2012.09.011.
References:
摘要:通过对基于多因素修正的剩余寿命预测方法中的应力集中因子进行推导, 提出了一种基于多因素修正的结构件裂纹扩展预测方法,从而实现了结构因素、应力比、加载方式、表面质量系数与构件裂纹扩展之间的量化关系表达.将所提方法应用于具体的实例构件的裂纹扩展预测中,并定量分析了所提出的各具体修正因素对实例构件裂纹扩展预测结果的影响.同时,运用基于Weibull分布概率密度方程的概率方法对修正后方法预测结果的精度进行评价,通过概率密度方程对实际预测结果所对应的概率密度值进行了求解.结果表明,该方法的预测结果比断裂力学的预测结果更精确,更接近试验结果.
关键词:预测研究;裂纹扩展;多因素修正;概率密度方程
中图分类号:TH123
Foundation items:The National Natural Science Foundation of China (No.51675098), Chinese Specialized Research Foundation for Doctoral Program of Higher Education (No.20130092110003), Graduate Student Research Innovation Foundation of Jiangsu Province (No.KYLX15_0059).
Citation::Zhu Lin, Jia Minping, Jiang Changcheng, et al. Estimation of structure crack propagation based on multiple factors correction[J].Journal of Southeast University (English Edition),2017,33(1):39-45.
DOI:10.3969/j.issn.1003-7985.2017.01.007.
DOI:10.3969/j.issn.1003-7985.2017.01.007
Received 2016-11-07.
Biographies:Zhu Lin (1990—), male, graduate; Jia Minping (corresponding author), male, doctor, professor, mpjia@seu.edu.cn.