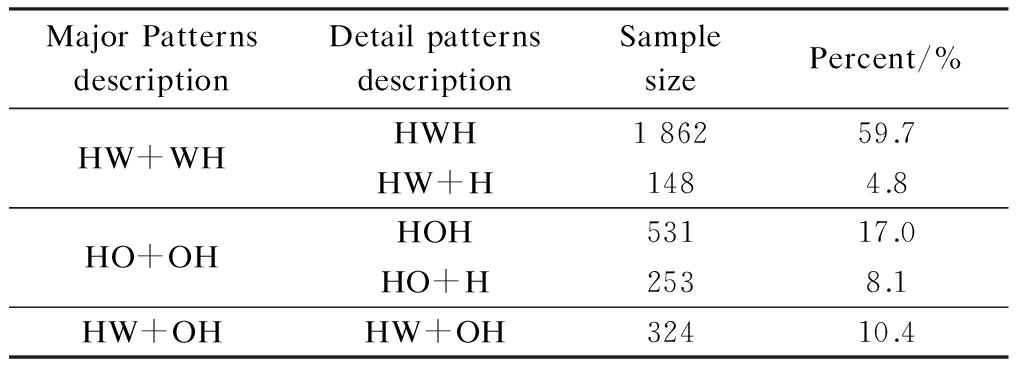
Tab.1 Description of trip chaining patterns
MajorPatternsdescriptionDetailpatternsdescriptionSamplesizePercent/%HW+WHHWH186259.7HW+H1484.8HO+OHHOH53117.0HO+H2538.1HW+OHHW+OH32410.4
Abstract:In order to improve the accuracy of travel demand forecast and considering the distribution of travel behaviors within time dimension, a trip chaining pattern recognition model was established based on activity purposes by applying three methods: the support vector machine (SVM) model, the radial basis function neural network (RBFNN) model and the multinomial logit (MNL) model. The effect of explanatory factors on trip chaining behaviors and their contribution to model performance were investigated by sensitivity analysis. Results show that the SVM model has a better performance than the RBFNN model and the MNL model due to its higher overall and partial accuracy, indicating its recognition advantage under a small sample size scenario. It is also proved that the SVM model is capable of estimating the effect of multi-category factors on trip chaining behaviors more accurately. The different contribution of explanatory factors to trip chaining pattern recognition reflects the importance of refining trip chaining patterns and exploring factors that are specific to each pattern. It is shown that the SVM technology in travel demand forecast modeling and analysis of explanatory variable effects is practical.
Key words:trip chaining patterns; support vector machine; recognition performance; sensitivity analysis
Trip chaining behavior is the fact that residents always connect several activities with different purposes that need to be done in a day within temporal and spatial constraints. Contrary to individual single trip behavior, trip chaining behavior contains a series of space, time and activity type information. Therefore, with the development of the activity-based theory, there is much research that emphasizes an analysis of which factors have effects on trip chaining behaviors. For example, both Xianyu [1] and Li et al.[2] used the co-evolutionary logit model to capture the interrelationship between the travel mode choice and trip chaining behavior, and the model results show that activity decision or trip chaining behavior is made before mode choice in most cases. Meanwhile, household characteristics and personal attributes are also found significantly influencing trip chaining behavior, such as household members’ work status[3], work schedule[4], gender[5], the presence of children[6], etc. In addition, the built environment where people live and work is another important factor, and its effects on trip chaining behaviors have found their way into the diverse concepts of planning, design and policies[7-9], such as a compact city, transit-oriented development and mixed land use.
However, as a matter of fact, all aspects of factors have influences on trip chaining behavior collaboratively, rather than separately, which means all these factors need to be carefully considered when studying trip chaining behavior. Furthermore, although works on the relationship between factors and chaining behavior have obtained rich results, there are few studies focusing on developing effective recognition models for trip chaining patterns. Given these circumstances, the primary objective of this paper is to experiment with different technologies to recognize residents’ trip chaining behavior, particularly to investigate the potential capability of using the support vector machine (SVM) algorithm, which is new data-mining technology. Specifically, the study includes the following tasks: comparing the recognition performance of statistical and machine learning methods; evaluating the impact of those possible explanatory variables on trip chaining choice behavior and comparing the results between different methods and putting forward some predictor selection improvements for forecast models’ accuracy.
1.1 The SVM model
The SVM model is an advanced technology of data mining based on the statistical learning theory and the structural risk minimization principle[10], which is capable of approximating linear and nonlinear relationships[11]. Through constructing an optimal hyper-plane with kernel functions, the SVM model can change a nonlinear problem into a linear problem and then realizes its regression or classification function. Clearly, trip chaining pattern recognition should be treated as a classification problem in this paper. There are usually four main steps for processing recognition.
1) Sample division: The complete data samples are randomly divided into two subsets, which are a learning subset and a holdout subset.
2) Training model: The trip chaining pattern recognition SVM model is trained based on the learning subset to obtain structural parameters.
3) Recognition: The SVM model uses these structure parameters again but it is fitted by the explanatory variables of the holdout subset. In this way, the trip chaining patterns for each sample (individual) in holdout subset can be recognized.
4) Evaluation: The performance of the SVM model can be measured via checking whether the recognized trip chaining pattern matches the real trip chaining pattern for each sample (individual).
1.2 Grid-search and 10-fold cross-validation
Generally, there are structural parameters that need to be calculated for optimizing the SVM performance, for example, the penalty factor that determines the trade-off between the complexity of model and training errors and the parameter in the kernel function. The radial basis kernel function is used in this paper. A combination of grid-search and cross-validation is applied to calibrate these parameters.
10-fold cross-validation is an effective experimental method to estimate generalization error in a pattern recognition problem in the training model. It subdivides the learning set into 10 subsets, and each subset is tested using the SVM model and trained on the remaining nine subsets sequentially, thus ten-time trainings are processed. After averaging the percentages of samples that are correctly recognized in all trainings, the cross-validation accuracy can be obtained.
The grid-search method specifies a plane which is the scope of two-dimensional parameters. Through setting up the search step length of parameters, the plane is partitioned into a number of grids, which represent various pairs of parameters. Each pair of parameters is taken into the cross-validation process, after searching all grids in the plane, the pair with the best cross-validation accuracy, namely the pair of optimal parameters, is determined.
1.3 Methods for comparison purpose
In order to verify whether the SVM model has the advantage of recognizing trip chaining patterns, another two methods are selected for comparison purpose, which are the multinomial logit (MNL) model and a typical three-layer framework of the radial basis function neural network (RBFNN) model. Since the MNL model produces probability of each trip chaining pattern, the pattern with the highest probability should be selected, and then the recognition function of the MNL model can be calculated.
The original data for this paper was collected from the 2013 Nanjing resident trip survey, which was conducted in the main city area of Nanjing consisting of 495 traffic analysis zones (TAZs) according to the street and administrative divisions. Above six-year-old residents were asked to provide individual characteristics, household characteristics, and all one-day trip information on October 30th, 2013. Initially, a total of 2 000 household attributes and 5 932 residents’ personal characteristics and travel information were collected. Samples with missing information and logical issues was excluded. Finally, 1 701 households’, 3 118 residents’ information was selected in this study.
According to Ref.[2], the trip chaining behavior is usually defined as a sequence of trips that occurs on a complete day which starts and ends at home. Thus, three major trip chaining patterns and five detailed trip chaining patterns are given in Tab.1. They are described as follows:
•HW+WH denotes that there are only subsistence activities (such as working, school, and business) within a day. It may contain one commuting activity stop, HWH, or more than one stops, HW+H.
•HO+OH denotes that there are only non-subsistence activities (such as shopping, entertainment, visiting friends, and picking up/dropping off) within a day. It may contain one non-commuting stop, HOH, or more than one stops, HO+H.
•HW+OH denotes that this chaining pattern is a combination of a subsistence chain and a non-subsistence chain with at least two stops.
Tab.1 Description of trip chaining patterns
MajorPatternsdescriptionDetailpatternsdescriptionSamplesizePercent/%HW+WHHWH186259.7HW+H1484.8HO+OHHOH53117.0HO+H2538.1HW+OHHW+OH32410.4
Tab.2 reports all explanatory variables for model specification, including three aspects: trip information, personal and household characteristics and land use characteristics. Of the trip information, travel mode choice is divided into two types, which are single-mode and multi-modes. The former denotes that a person finishes all trips only by one mode, while the latter denotes two or more modes. Transfer times sum the count of transfer in each trip. Road network saturation reflects the average traffic saturation of traffic analysis zone where residents live. Land use characteristics show some information of residents’ dwelling environments.
Tab.2 Explanatory variables for model development

FactorcategoryVariablesDescriptionSamplesizePercent/%TripinformationAverageduration/minNumeric(continuous)31.6(Mean)TransfertimesNumeric(count)0.05(Mean)RoadnetworksaturationNumeric(continuous)0.67(Mean)CrossinggrouptravelNo193562.1Yes118337.9ModechoiceSingle-mode280890.1Multi-modes3109.9PersonalattributesGenderMale153949.4Female157950.6JobEmployee203665.3Self-employed2959.5Retired78725.2Age15to29yearsold51016.430to49yearsold146847.1≥50yearsold114036.6PubliccardpossessionYes262684.2No49215.8CarlicensepossessionYes145246.6No166653.4EducationHighschoolorlower151748.7collegeorhigher160151.3HouseholdcharacteristicsHeadofhouseholdYes118638.0No193262.0Familysize≤3237376.1>374523.9ChildinhouseholdNo263284.4Yes48615.6CarsownershipNo147847.4Yes164052.6BikesownershipNo90228.9Yes221671.1EbikesownershipNo92929.8Yes218970.2Income<105yuan/year173255.5≥105yuan/year138644.5LandusecharacteristicsPopulationdensity/(persons·km-2)Numeric(continuous)15.3(Mean)Employmentdensity/(jobs·km-2)Numeric(continuous)7.4(Mean)LivingincenterareaNo91129.2Yes220770.8
In this paper, the SVM model, as well as the MNL model and the RBFNN model, was experimented on ten times with different learning and holdout sets with the ratio of 4:1 randomly, in order to reduce the bias when producing the random separation of the whole dataset. The SVM toolbox developed by Chang et al. [12] was used to specify the SVM model whose parameters were optimized by the grid-search approach. The MNL model and the RBFNN model were fitted using the SPSS software packages.
These recognition models’ performance is investigated from two sides: overall accuracy and partial accuracy. The former is defined as the proportion of all-class that recognized actually in the whole holdout sets, while the latter focuses on the proportion of each class that recognized actual accounts for every class of patterns in the holdout sets.
3.1 Accuracy assessment and comparison of recognition performance
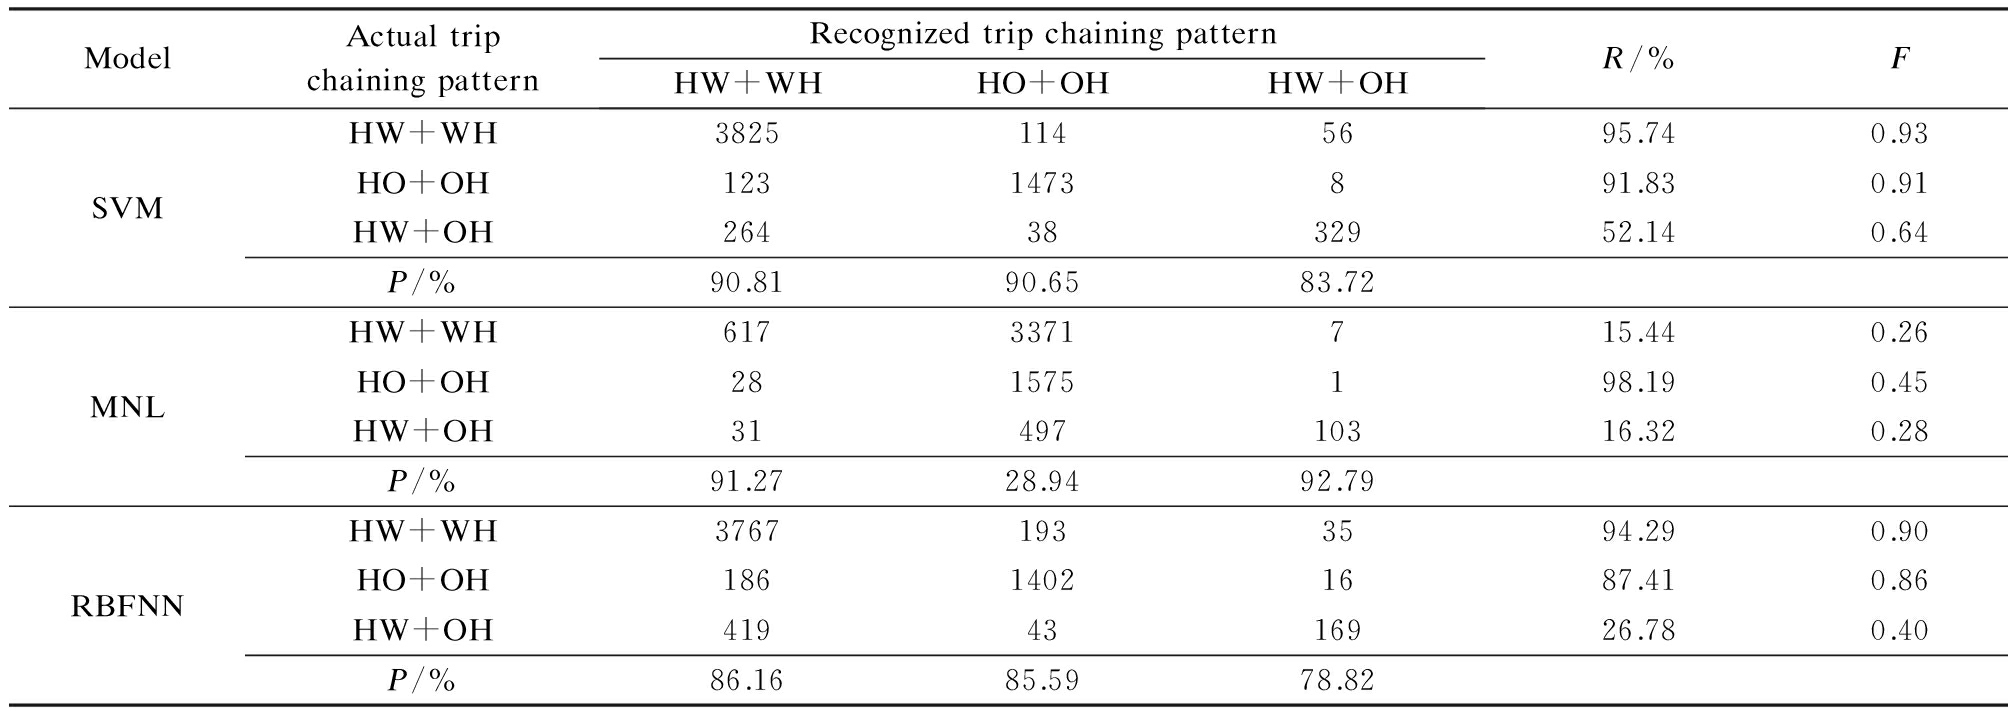
The partial recognition performance is represented by the confusion matrix, which contains two evaluation measures: the precision P for one trip chaining pattern X denotes the proportion of recognized trip chaining pattern X that correctly reflects trip chaining pattern X; the recall R for one trip chaining X denotes the proportion of real trip chaining pattern X that correctly recognizes the trip chaining pattern X. For comparison purposes, all ten experimental results produced by the three models were summarized into one confusion matrix as shown in Tab.3 and Tab.4.
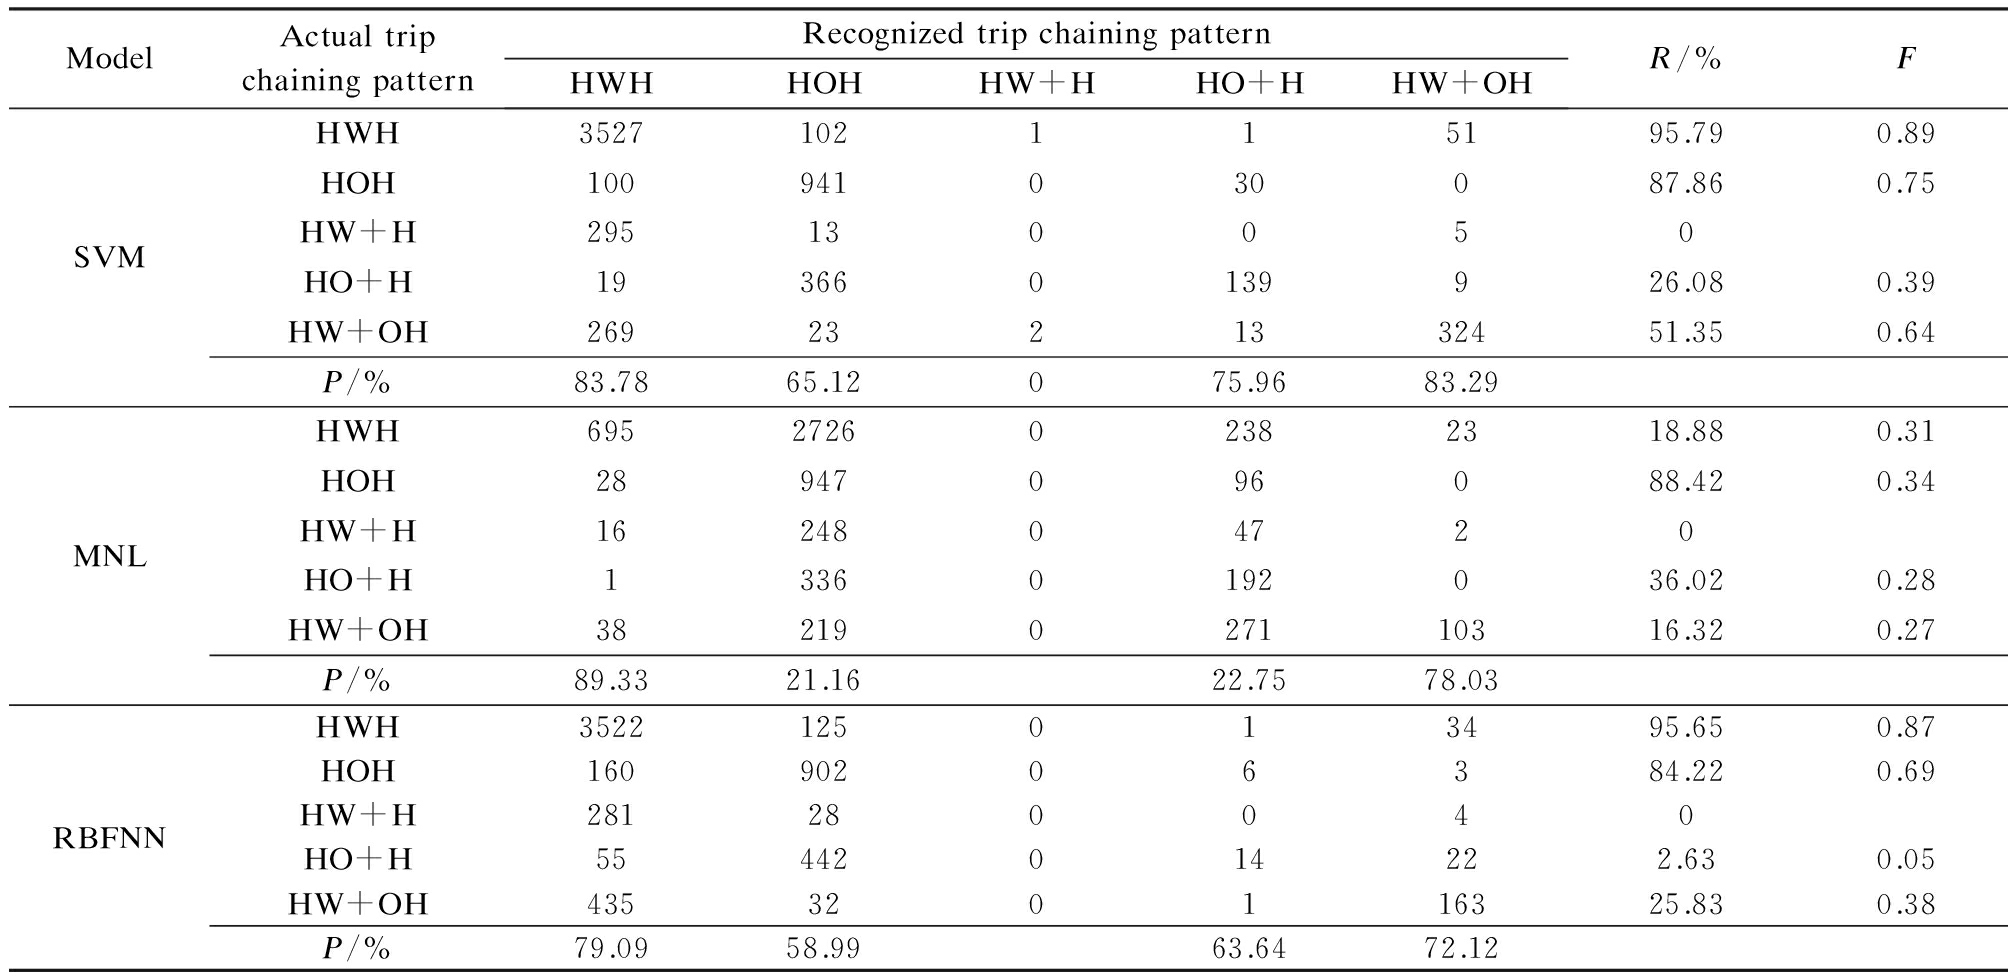
For major trip chaining pattern recognition, it is clear that, of the recall percentage, all models have good performance in identifying the HO+OH trip chaining pattern. Compared with the MNL model and the RBFNN model, the SVM model performs much better in recognizing the HW+OH trip chaining pattern. Of the precision, all models have more than 75% percentage, except that the precision of the MNL model for HO+OH is less than 30%. For detailed five-category trip chaining patterns, the SVM model, the MNL model and the RBFNN model experience great difficulty in identifying the trip chaining pattern of HW+H. However, the recognition performance of the SVM model is higher in terms of precision and recall percentages than those of the other two models.
Although Tabs.3 and 4 provide much information about the performance of different models, in order to determine their effectiveness, we compare all the models by using F-measure [13], which takes both the precision and recall percentages into consideration and it is computed as
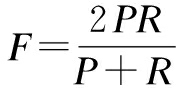
(1)
The F-measure values in Tabs.3 and 4 indicate that the SVM model performs better than the MNL model and the RBFNN model in terms of different trip chaining divisions and patterns.
Tab.3 Confusion matrix for the three models developed for recognizing the three major trip chaining patterns
ModelActualtripchainingpatternRecognizedtripchainingpatternHW+WHHO+OHHW+OHR/%FSVMHW+WH38251145695.740.93HO+OH1231473891.830.91HW+OH2643832952.140.64P/%90.8190.6583.72MNLHW+WH6173371715.440.26HO+OH281575198.190.45HW+OH3149710316.320.28P/%91.2728.9492.79RBFNNHW+WH37671933594.290.90HO+OH18614021687.410.86HW+OH4194316926.780.40P/%86.1685.5978.82
Tab.4 Confusion matrix for the three models developed for recognizing detailed three trip chaining patterns
ModelActualtripchainingpatternRecognizedtripchainingpatternHWHHOHHW+HHO+HHW+OHR/%FSVMHWH3527102115195.790.89HOH100941030087.860.75HW+H295130050HO+H193660139926.080.39HW+OH2692321332451.350.64P/%83.7865.12075.9683.29MNLHWH695272602382318.880.31HOH28947096088.420.34HW+H1624804720HO+H13360192036.020.28HW+OH38219027110316.320.27P/%89.3321.1622.7578.03RBFNNHWH3522125013495.650.87HOH16090206384.220.69HW+H281280040HO+H55442014222.630.05HW+OH435320116325.830.38P/%79.0958.9963.6472.12
In addition to partial accuracy, the average overall accuracy of all experiments is also compared. For major trip chaining patterns, the average overall accuracy of the SVM model, the MNL model and the RBFNN model are 90.32% (0.010 6 ), 36.84% (0.024 8), 85.68% (0.016 1), respectively, which in parentheses are standard errors. For detailed trip chaining patterns, the average overall accuracy of the SVM model is 79.15% (0.016 5), the MNL model’s is 31.09% (0.033 4), and the RBFNN model’s is 73.85% (0.019 0). The result clearly shows that the SVM model outperforms another two models no matter how the trip chaining patterns are divided and the lower standard deviation demonstrates that the outcomes of the SVM model are more stable. In conclusion, it is effective to use the support vector machine learning technique to produce acceptable and accurate outcomes in trip chaining pattern recognition.
3.2 Analysis of effects of explanatory variables
Although the SVM model performs well in terms of partial accuracy and overall accuracy, impact evaluation of explanatory variables is a common problem in machine learning methods, such as the SVM model and the neural network model, due to their “black-box” mechanism. However, inspired by Refs.[10,14], the one-dimensional sensitivity analysis of the SVM model is conducted in this study to investigate the relationship between trip chaining behavior and various explanatory variables. Each explanatory variable fitted in the SVM model is perturbed by increasing one unit change with other variables remaining unchanged, and then the proportion change of trip chaining patterns is estimated by comparing the SVM’s recognition result before and after the perturbation. Furthermore, because there are 21 explanatory variables, the sensitivity degrees caused by all the variables are ranked from the maximum variation to the minimum variation. Sensitivity degree is defined as the sum of absolute value of probability changes of all-category trip chaining patterns. Each variable’s sensitivity degree is then used to calculate its contribution that accounts for the whole SVM model sensitivity degree gross, and only these ranked variables whose accumulative contribution proportion is above 95% are concerned as illustration. Meanwhile, the marginal effect of each input variable on each trip chaining pattern was also estimated using the MNL model, for comparison between machine learning and statistical models.
3.2.1 Sensitivity analysis result of the SVM model for three major trip chaining patterns
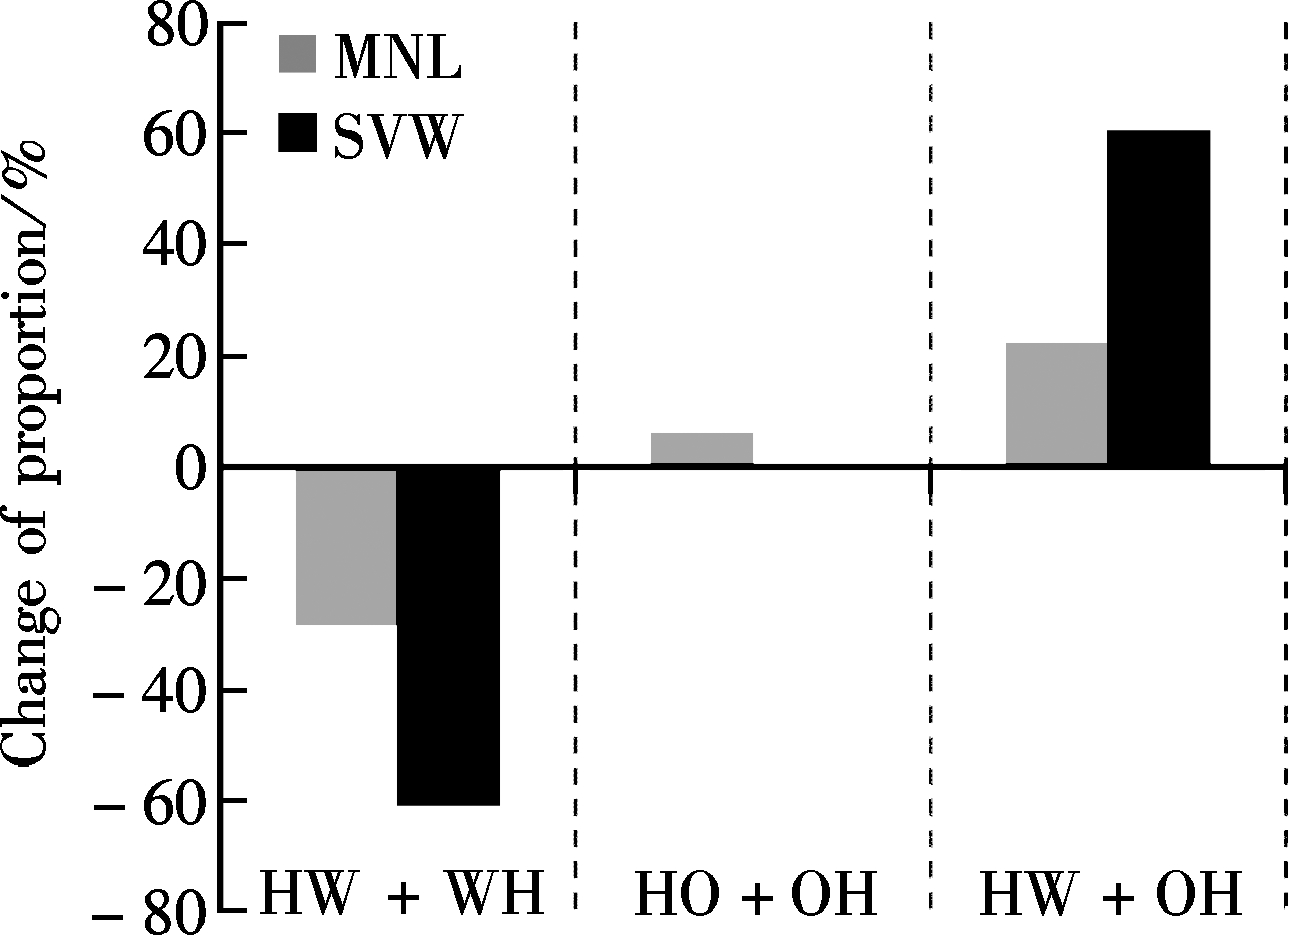
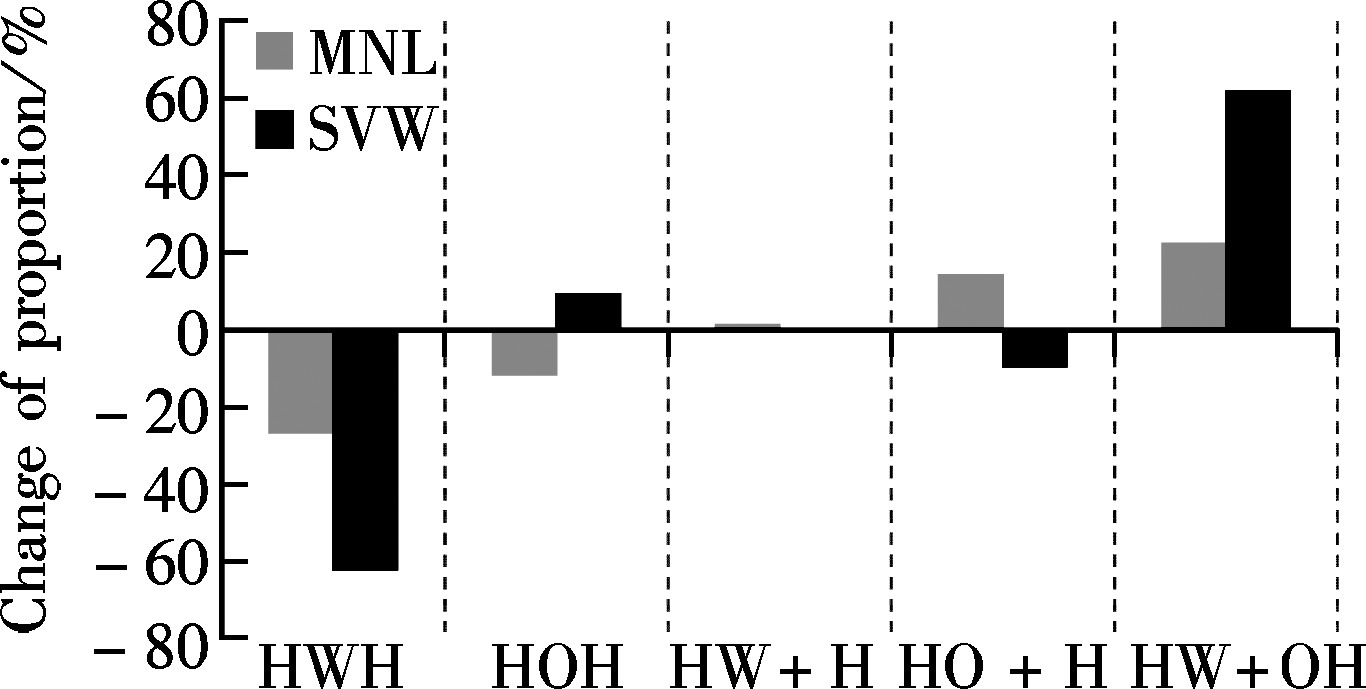
Sensitivity analysis results of the SVM and the MNL models for three major trip chaining patterns are presented in Fig.1. Only two explanatory variables, which are mode choice and job, have the accumulative sensitivity proportion occupancy above 95% (96.97%). As shown in Fig.1, the SVM model and the MNL model produce a similar results for the variable of mode choice, however, they produce opposite results for the variable of the job. In order to further explore and explain underlying reasons, the proportion of three chaining patterns grouped by different mode choice and jobs based on the complete data are plotted respectively in Fig.2.
For mode choice, if an individual changes his/her mode type from single-mode to multi-modes, he/she seldom makes the complex subsistence-related trip chain of HW+WH (the proportion of HW+HW chaining pattern decrease from 69.4% to 19.4%.) but tends to make a mixed trip chain of HW+OH (the proportion of HW+OH chaining pattern increase from 5.2% to 57.7%). Both the SVM and the MNL models captured the significant changes. However, according to Fig.2, people who use multi-modes will not like to make the trip chain of HO+OH (the proportion of HO+OH chaining pattern decrease slightly by 2.5% when comparing people who use multi-modes with who use single-mode), two models cannot reflect the subtle probability change of the HO+OH pattern, and even the MNL model has positive change which is not accurate.
(a)
(b)
(c)
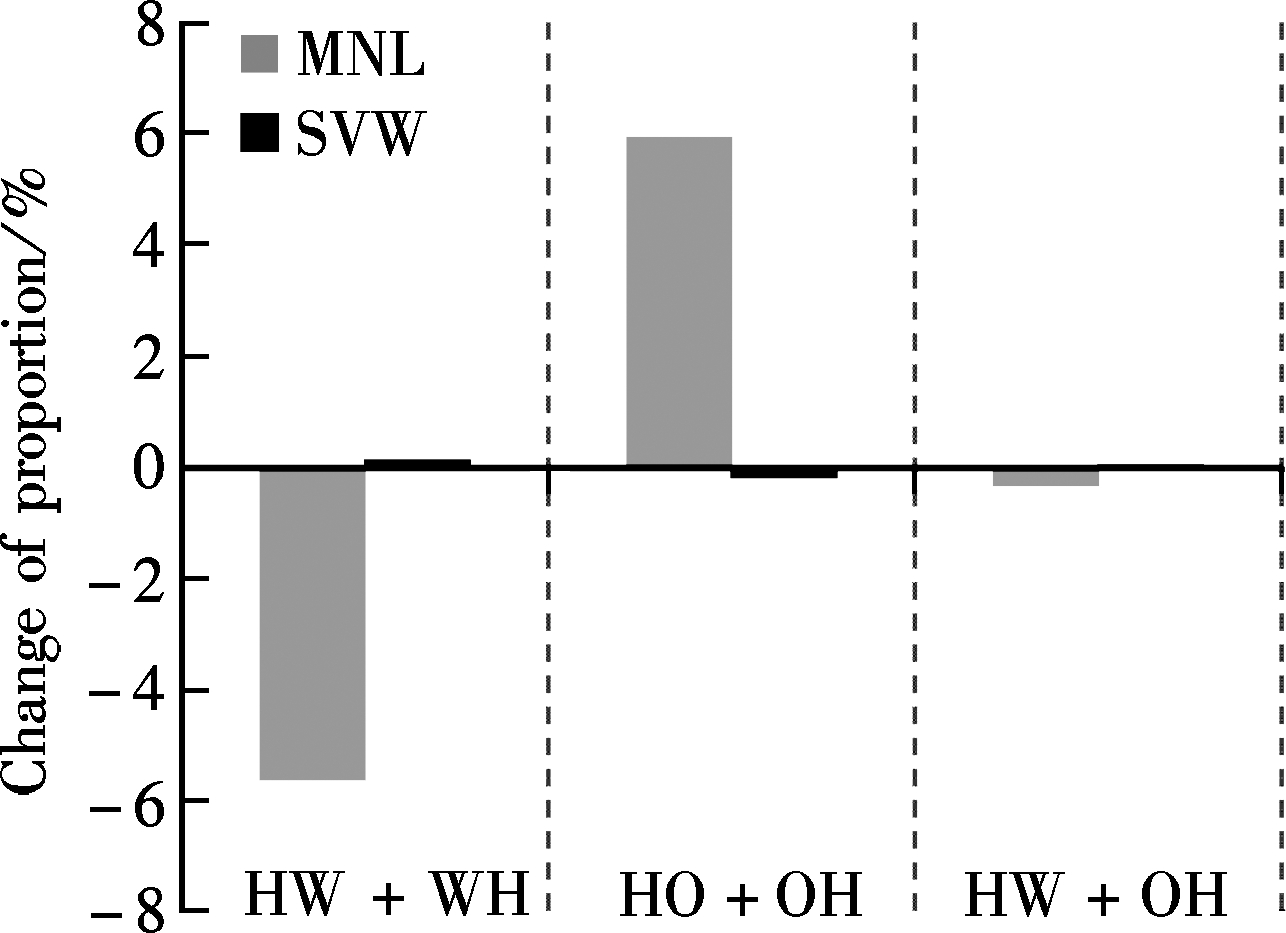
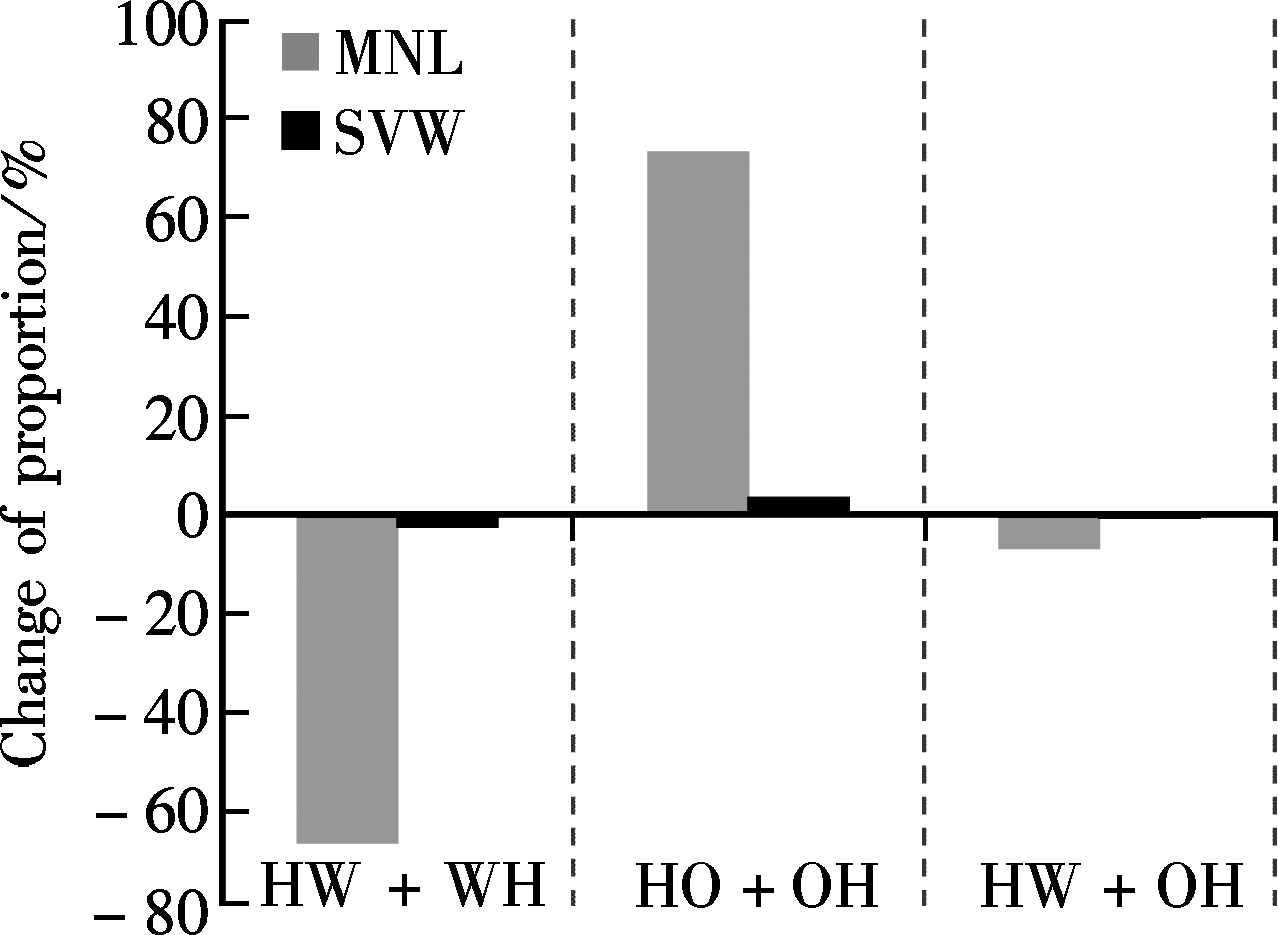
Fig.1 Comparison of the SVM and the MNL models regarding the impacts of mode choice and job on major trip chaining patterns. (a) Mode choice single to multiple; (b) Job employee to self-employed; (c) Job employee to retired
For the job, it is not difficult to find that the MNL model keeps the similar trend no matter how an individual’s job changes, and clearly the sensitivity result of the MNL model is much more significant than the SVM’s. However, the sensitivity result of the SVM model

(a)
(b)
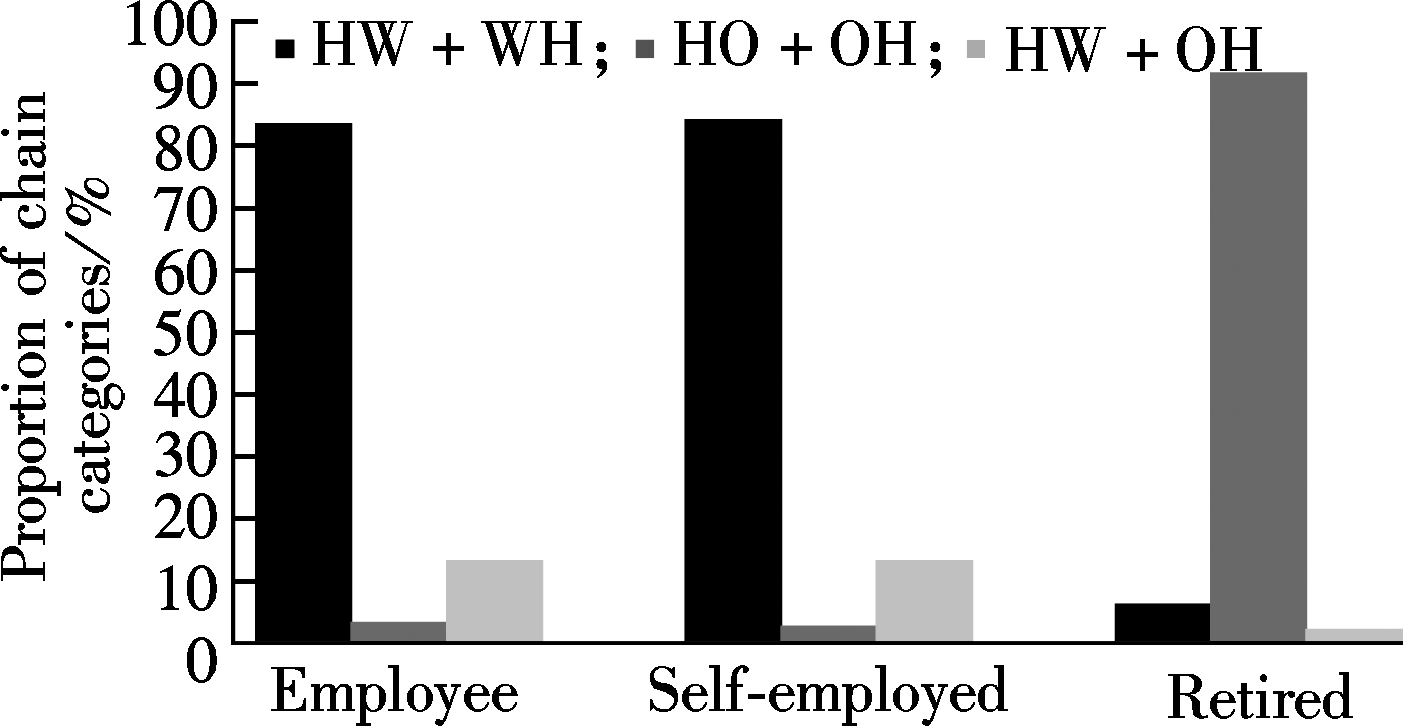
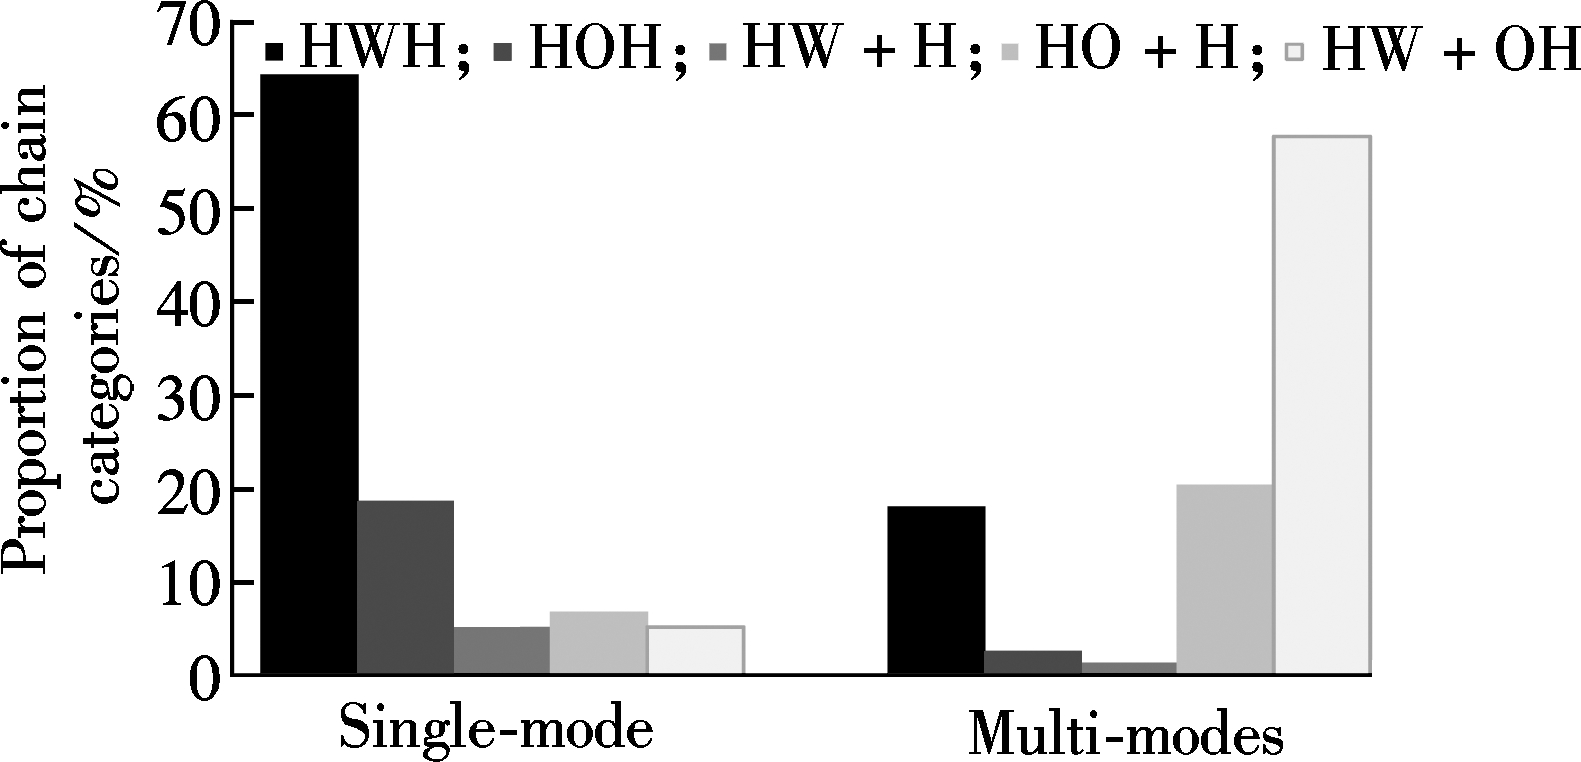
Fig.2 Proportion of three chain categories. (a) Grouped by different mode choices; (b) Grouped by different jobs
is only consistent with the MNL’s when an individual’s job changes from employee to being retired. If someone’s job changes from employee to self-employed, two models show the opposite result. From Fig.2, it seems that the SVM offers more accurate sensitivity. When comparing an individual whose job is self-employed with the one whose job is employee, the former tends to make a little more trip chaining behavior of HW+WH (84.1% vs. 83.4%), which corresponds to the positive change in proportion of HW+WH as displayed in Fig.1, but makes a little less trip chaining behavior of HO+OH (2.7% vs. 3.3%), which corresponds to the negative change of proportion of HO+OH as is also displayed in Fig.1. Therefore, the SVM model has the capability of capturing the interrelationship among multi-category explanatory variables particularly when the difference between each category is imperceptible.
3.2.2 Sensitivity analysis result of the SVM model for five detailed trip chaining patterns
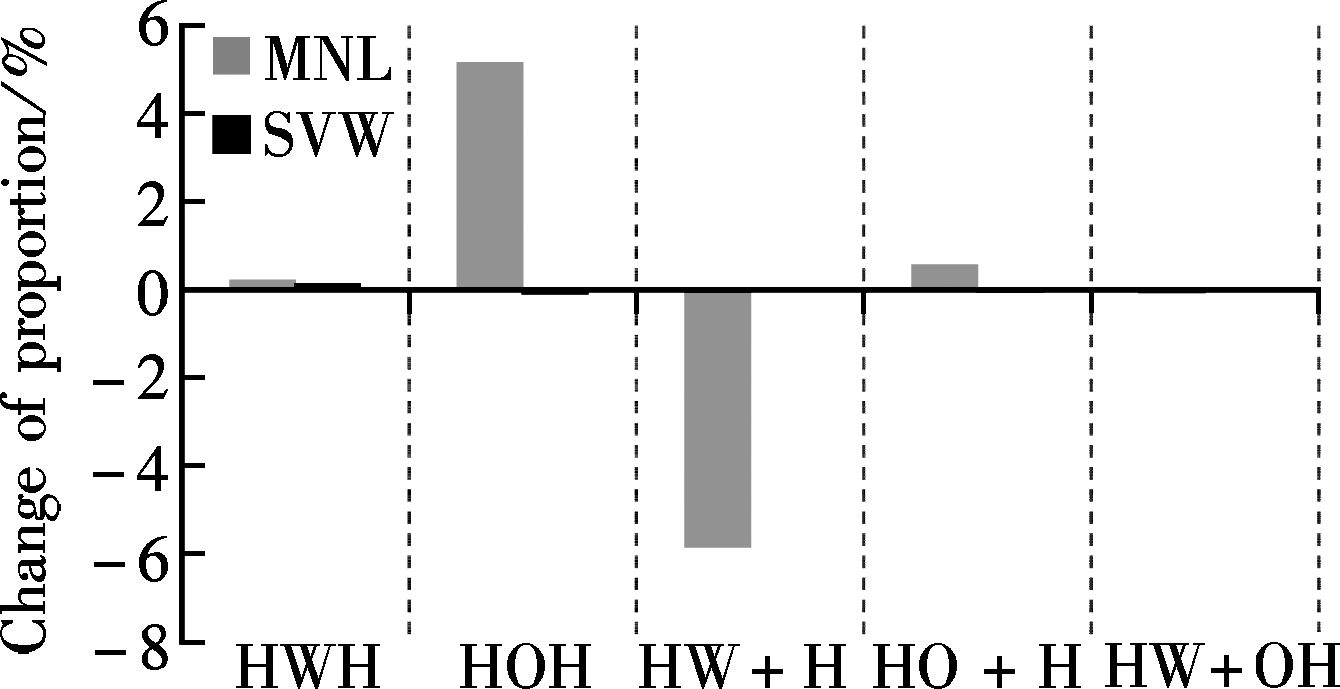
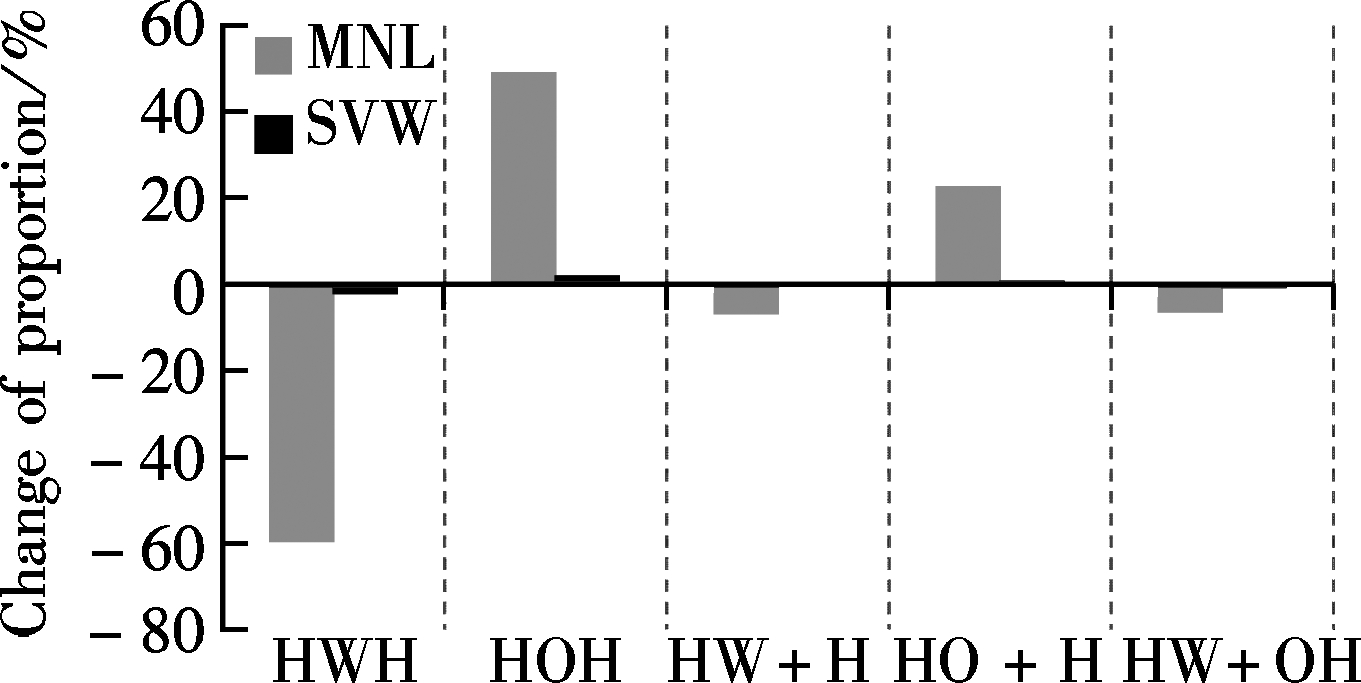
The SVM model for five detailed trip chaining patterns was also analyzed by sensitivity calculation. There are six explanatory variables, mode choice, job, average travel duration, family size, transfer times and population density, which make the accumulative sensitivity occupancy extend beyond 95% (95.54%). Also, the variables of mode choice and job that are the two most sensitive variables are regarded as examples for interpreting the results.
By exploring the description in Fig.3 and Fig.4, what should be noted is that generally sensitivity estimated by the SVM model is only suitable for analyzing the impact of explanatory variables on trip chaining patterns of HWH and HW+OH as the number of trip chaining pattern classification increases. However, the SVM model can still produce more accurate sensitivity for the patterns of HOH and HO+H when analyzing multi-category explanatory variables such as the variable of job. The impact of variables, mode choice and job types, on trip chaining pattern of HWH and HW+OH, conducted by the SVM model is consistent with the estimation of the MNL model. However, the SVM model fails when investigating the impact of explanatory variables on the trip chaining pattern of HW+H; that is, no matter how much the variables change, the proportion of HW+H in the SVM model recognition output will not change, indicating that none of the explanatory variables used in this paper can influence this type of trip chaining behavior. This unexpected result may be due to the minimum sample size of HW+H in the complete data and the fact that the SVM model suffers from a multi-class classification problem. Consequently, it can be concluded that when conducting the analysis on explanatory variable impacts, various methods need be applied not only for comparison but also for obtaining more reliable results.
(a)
(b)
(c)
Fig.3 Comparison of the SVM and the MNL models regarding the impacts of variables of mode choice and job on detailed trip chaining patterns. (a) Mode choice single to multiple. (b) Job employee to self-employed. (c) Job employee to being retired
3.3 Analysis of explanatory variables’ contribution to model recognition performance
During the sensitivity analysis, the percentage change of the SVM models’ recognition accuracy also based on the complete dataset is recorded, as shown in Tab.5 and Tab.6.
(a)

(b)
Fig.4 Proportion of five chain categories. (a) Grouped by different mode choices; (b) Grouped by different jobs
For the major trip chaining pattern model, it shows that job and mode choice greatly aid the improvement of the model’s overall accuracy performance, while other variables make little contribution. Of specific trip chaining patterns, only transfer times and job are significantly helpful for HW+WH pattern recognition accuracy. All of the variables improve the HO+OH patterns recognition accuracy, but most of them are much too small. Mode choice makes a great contribution to improving the accuracy of the HW+OH pattern by 49.07%. Conversely, the mode choice variable has a negative effect on HW+WH patterns recognition accuracy. This is consistent with the actual data. For example, most people whose trip chaining patterns are HW+WH and HO+OH always travel by single mode, while more people whose trip chaining pattern is HW+OH take multi-modes, which may cause the model difficulty when recognizing the patterns of HW+WH or HO+OH when one person travels by single mode.
Tab.5 Predictor contributions to the recognition performance of the SVM model for major trip chaining patterns
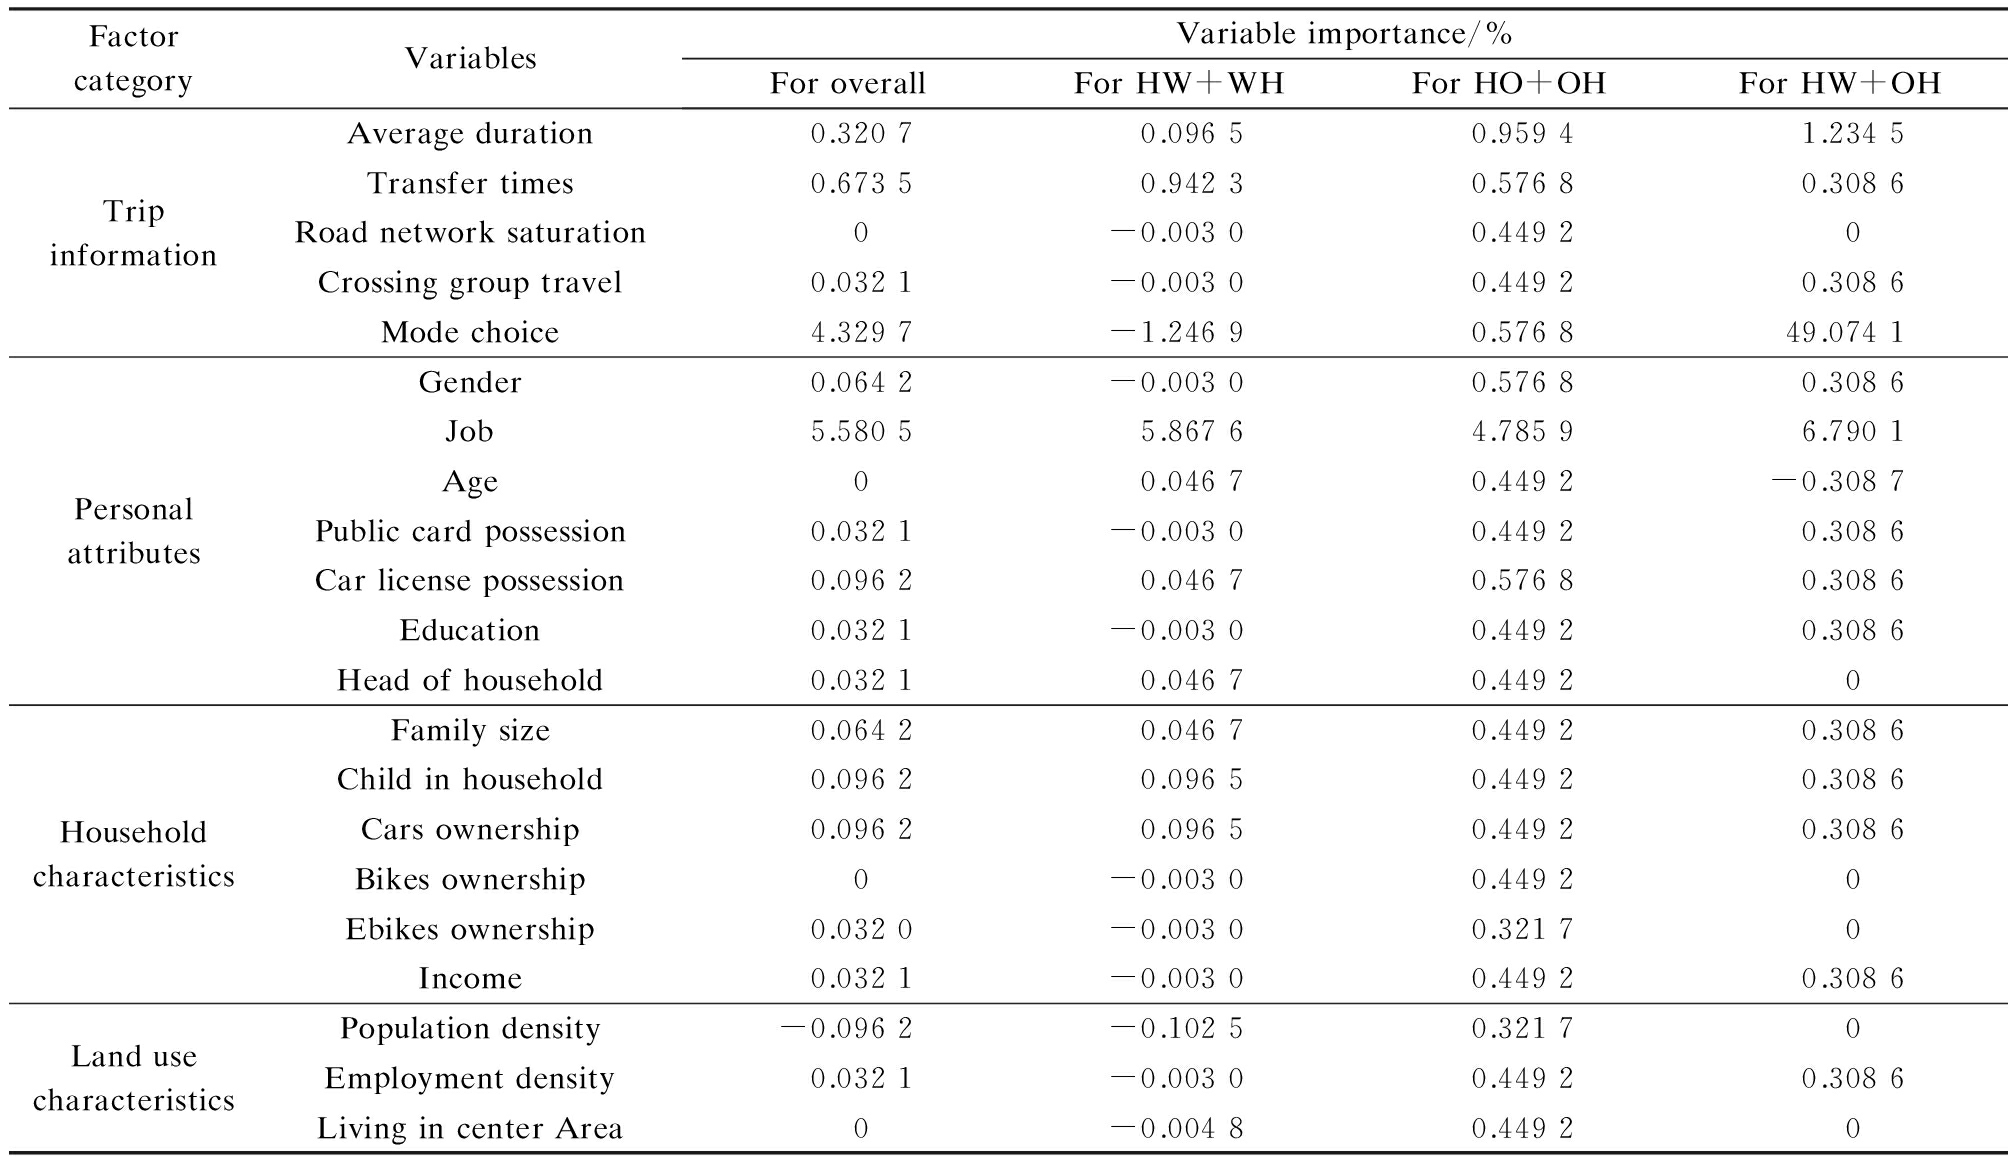
FactorcategoryVariablesVariableimportance/%ForoverallForHW+WHForHO+OHForHW+OHTripinformationAverageduration0.32070.09650.95941.2345Transfertimes0.67350.94230.57680.3086Roadnetworksaturation0 -0.00300.44920 Crossinggrouptravel0.0321-0.00300.44920.3086Modechoice4.3297-1.24690.576849.0741PersonalattributesGender0.0642-0.00300.57680.3086Job5.58055.86764.78596.7901Age0 0.04670.4492-0.3087Publiccardpossession0.0321-0.00300.44920.3086Carlicensepossession0.09620.04670.57680.3086Education0.0321-0.00300.44920.3086Headofhousehold0.03210.04670.44920 HouseholdcharacteristicsFamilysize0.06420.04670.44920.3086Childinhousehold0.09620.09650.44920.3086Carsownership0.09620.09650.44920.3086Bikesownership0 -0.00300.44920 Ebikesownership0.0320-0.00300.32170 Income0.0321-0.00300.44920.3086LandusecharacteristicsPopulationdensity-0.0962-0.10250.32170 Employmentdensity0.0321-0.00300.44920.3086LivingincenterArea0 -0.00480.44920
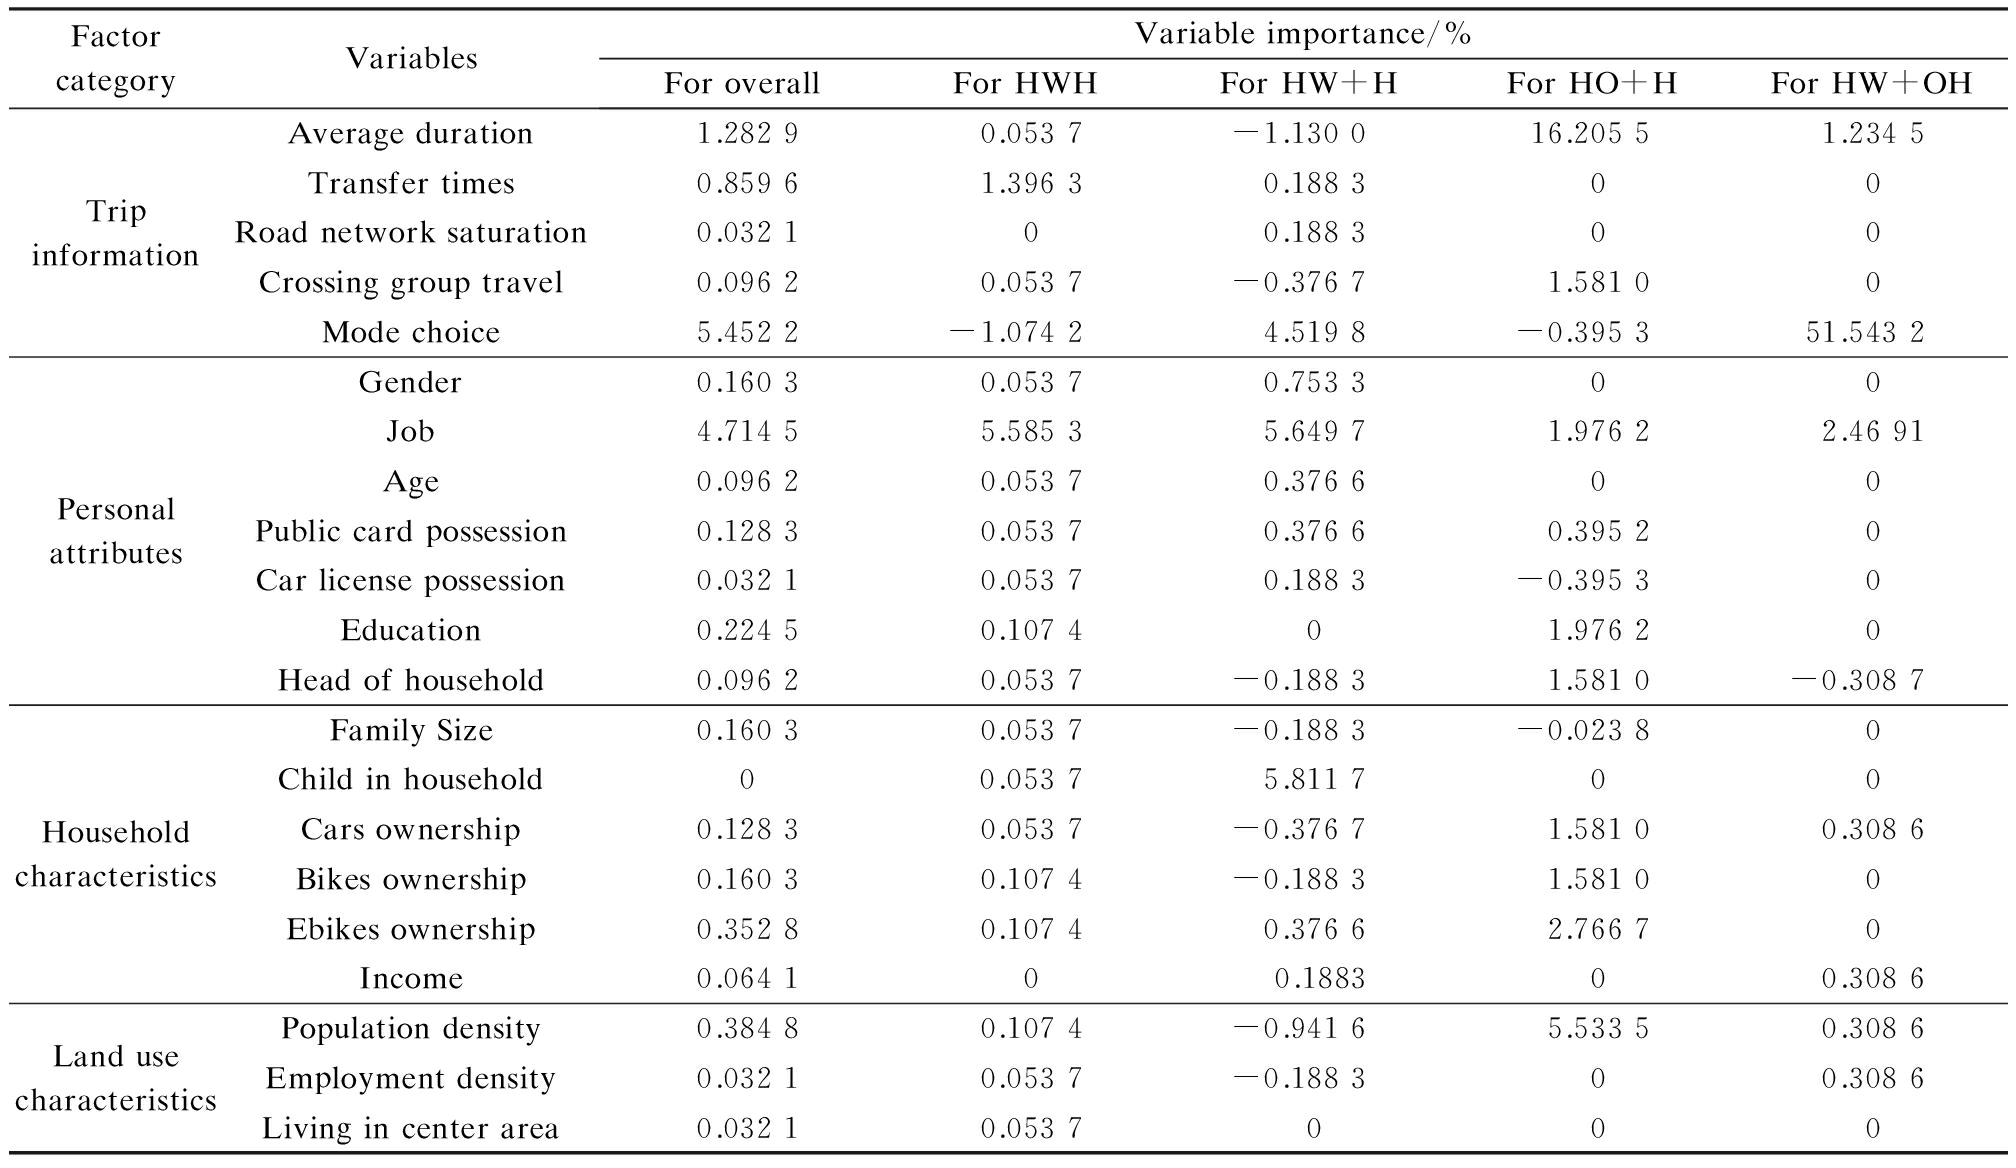
For the detailed trip chaining pattern model, the recognition performance change becomes much more complex. Similar to the major trip chaining pattern model, job and mode choice still have significant positive effects on overall recognition accuracy. Meanwhile, more variables shows slight contribution to overall recognition accuracy such as average duration, transfer times, education, family size, e-bike ownership and population density. Interestingly, some of these predictors show the opposite impact on different types of trip chaining patterns. For example, the variable of mode choice has a positive impact on recognizing HW+H and HW+OH patterns, but it affects HWH and HO+H patterns negatively. Besides, more predictors selected in this paper are not able to helpfully recognize the pattern of HW+H, and with the increase of categories being divided, fewer variables demonstrate positive effects on the recognition of the HW+OH pattern, although its absolute sample size is unchanged no matter how the trip chaining patterns are divided.
In summary, two conclusions can be drawn: different explanatory variables may be specific to trip chaining patterns and their sub-division influences the contribution to recognition performance. Therefore, it can be said that trip chaining patterns should be divided extensively and the explanatory variables’ effects must be determined carefully.
Tab.6 Predictor contributions to the recognition performance of the SVM model for detailed trip chaining patterns
FactorcategoryVariablesVariableimportance/%ForoverallForHWHForHW+HForHO+HForHW+OHTripinformationAverageduration1.28290.0537-1.130016.20551.2345Transfertimes0.85961.39630.18830 0 Roadnetworksaturation0.03210 0.18830 0 Crossinggrouptravel0.09620.0537-0.37671.58100 Modechoice5.4522-1.07424.5198-0.395351.5432PersonalattributesGender0.16030.05370.75330 0 Job4.71455.58535.64971.97622.4691Age0.09620.05370.37660 0 Publiccardpossession0.12830.05370.37660.39520 Carlicensepossession0.03210.05370.1883-0.39530 Education0.22450.10740 1.97620 Headofhousehold0.09620.0537-0.18831.5810-0.3087HouseholdcharacteristicsFamilySize0.16030.0537-0.1883-0.02380 Childinhousehold0 0.05375.81170 0 Carsownership0.12830.0537-0.37671.58100.3086Bikesownership0.16030.1074-0.18831.58100 Ebikesownership0.35280.10740.37662.76670 Income0.06410 0.18830 0.3086LandusecharacteristicsPopulationdensity0.38480.1074-0.94165.53350.3086Employmentdensity0.03210.0537-0.18830 0.3086Livingincenterarea0.03210.05370 0 0
This paper demonstrates the underlying significance of developing a trip chaining pattern recognition model, and also explores the potential benefits of using the SVM model with its classification function to recognize trip chaining patterns. The SVM model shows better performance than the MNL model and the RBFNN model. In addition, the sensitivity analysis of the SVM model can evaluate the effects of explanatory variables on trip chaining behavior because the SVM model can produce more reliable results. Meanwhile, the contribution of different factors is summarized, which provides some thoughts on how to improve model performance.
Despite the insights observed and trials tested in this study, there is still some further research that needs to be considered. For instance, the enhancement to data availability and quality, and the extraction of effective variables can help complement and distinguish different trip chaining pattern characteristics. Some underlying truths should be excavated by considering several explanatory variables simultaneously if a more deliberate sensitivity analysis is conducted. A more sophisticated statistical method should be used for elaborate comparison. Future studies that consider these limitations will lead to more accurate forecasting for residents’ trip chaining behavior, and will be helpful for transportation planning and management.
[1]Xianyu J C. An exploration of the interdependencies between trip chaining behavior and travel mode choice [J]. Procedia-Social and Behavioural Sciences, 2013, 96: 1967-1975. DOI:10.1016/j.sbspro.2013.08.222.
[2]Li Z B, Wang W, Yang C, et al. Exploring the causal relationship between bicycle choice and trip chain pattern [J]. Transport Policy, 2013. 29: 170-177. DOI:10.1016/j.tranpol.2013.06.001.
[3]Lee Y, Hickman M, Washington S. Household type and structure, time-use pattern, and trip-chaining behaviour [J]. Transportation Research Part A: Policy and Practice, 2007, 41(10): 1004-1020. DOI:10.1016/j.tra.2007.06.007.
[4]Wang R. The stops made by commuters: Evidence from the 2009 US National Household Travel Survey [J]. Journal of Tranport Geography, 2015, 47: 109-118. DOI:10.1016/j.jtrangeo.2014.11.005.
[5]Ma J, Mitchell G, Heppenstall A. Daily travel behavior in Beijing, China: An analysis of workers’ trip chains, and the role of socio-demographics and urban form [J]. Habitat International, 2014, 43: 263-273. DOI:10.1016/j.habitatint.2014.04.008.
[6]Lee Y, Washington S, Frank L D. Examination of relationships between urban form, household activities, and time allocation in the Atlanta metropolitan region [J]. Transportation Research Part A: Policy and Practice, 2009, 43(4): 360-373. DOI:10.1016/j.tra.2008.11.013.
[7]Frank L, Bradley M, Kavage S, et al. Urban form, travel time, and cost relationships with tour complexity and mode choice [J]. Transportation, 2008, 35(1): 37-54. DOI:10.1007/s11116-007-9136-6.
[8]Maat K, Wee B V, Stead D. Land use and travel behavior: Expected effects from the perspective of utility theory and activity-based theories [J]. Environment and Planning B: Planning and Design, 2005, 32(1): 33-46. DOI:10.1068/b31106.
[9]Shiftan Y. The use of activity-based modelling to analyse the effect of land-use policies on travel bahavior [J]. The Annals of Regional Science, 2008, 42(1): 79-97. DOI:10.1007/s00168-007-0139-1.
[10]Li Z B, Liu P, Wang W, et al. Using support vector machine models for crash injury severity analysis [J]. Accident Analysis and Prevention, 2012, 45: 478-486. DOI:10.1016/j.aap.2011.08.016.
[11]Xianyu J C. Travel mode choice analysis using support vector machine [C]//11th International Conference of Chinese Transportation Professionals (ICCTP).Nanjing, China, 2011: 14-17.
[12]Chang C C, Lin C J. LIBSVM: A library for support vector machines [EB/OL]. (2013-03-04)[2015-01-27] https://www.csie.ntu.edu.tw/~cjlin/papers/libsvm.pdf.
[13]Powers D M W. Evaluation: from precision, recall and F-measure to ROC, informedness, markedness & correlation [J]. Journal of Machine Learning Technologies, 2011, 2(1): 37-63.
[14]Cortez P, Embrechts M J. Using sensitivity analysis and visualization techniques to open black box data mining models [J]. Information Sciences, 2013, 225: 1-17. DOI:10.1016/j.ins.2012.10.039.
References:
摘要:为了提高交通需求预测精度,综合考虑居民出行行为在时间维度上的分布,采用支持向量机、径向基神经网络和多项logit三种方法,基于居民活动目的,建立了出行链模式识别模型,并利用敏感性分析方法研究了解释因素对出行链模式选择的影响和对模型性能的贡献程度.结果显示:支持向量机模型在总体准确度和分类准确度上均优于其他2种方法,体现了支持向量机在小样本下的识别性能优势;证明了支持向量机能够较准确地反映多分类因素对于出行链模式选择行为的影响程度;因素对于不同出行链模式识别精度的贡献度差异表明了细化出行链模式及探索各个模式特有影响因素的重要性.支持向量机技术在交通需求预测建模及影响因素分析方面均具有实践意义.
关键词:出行链模式;支持向量机;预测性能;敏感性分析
中图分类号:U121
Foundation items:The Fundamental Research Funds for the Central Universities, the Scientific Innovation Research of College Graduates in Jiangsu Province (No.KYLX_0177).
Citation::Yang Shuo, Deng Wei, Cheng Long. Application of support vector machine in trip chaining pattern recognition and analysis of explanatory variable effects[J].Journal of Southeast University (English Edition),2017,33(1):106-114.
DOI:10.3969/j.issn.1003-7985.2017.01.018.
DOI:10.3969/j.issn.1003-7985.2017.01.018
Received 2016-06-20.
Biographies:Yang Shuo (1988—), male, graduate; Deng Wei (corresponding author), male, doctor, professor, dengwei@seu.edu.cn.