Abstract:In order to address the issues of traditional resampling algorithms involving computational accuracy and efficiency in rolling element bearing fault diagnosis, an equal division impulse-based (EDI-based) resampling algorithm is proposed. First, the time marks of every rising edge of the rotating speed pulse and the corresponding amplitudes of faulty bearing vibration signal are determined. Then, every adjacent the rotating pulse is divided equally, and the time marks in every adjacent rotating speed pulses and the corresponding amplitudes of vibration signal are obtained by the interpolation algorithm. Finally, all the time marks and the corresponding amplitudes of vibration signal are arranged and the time marks are transformed into the angle domain to obtain the resampling signal. Speed-up and speed-down faulty bearing signals are employed to verify the validity of the proposed method, and experimental results show that the proposed method is effective for diagnosing faulty bearings. Furthermore, the traditional order tracking techniques are applied to the experimental bearing signals, and the results show that the proposed method produces higher accurate outcomes in less computation time.
Key words:rolling element bearing; fault diagnosis; variable rotational speed; equal division impulse-based resampling
Rolling element bearings are one of the most prevalent components in rotating machines, and their failure may lead to fatal machine breakdown[1-4].Identifying the bearings’ health condition timely and effectively by vibration analysis is increasingly crucial to reduce maintenance costs and ensure high productivity[5]. According to the tireless efforts of scholars, many powerful techniques have been developed for rolling element bearing fault diagnosis under constant rotational speed conditions. However, if the rotating speed is variable, the traditional diagnostic techniques are no longer applicable, such as the fast Fourier transform (FFT), and the frequency-smear phenomenon will occur in the frequency spectrum. Non-stationary operating conditions of rolling element bearings are very common in the industry, such as wind turbines, petrochemical engineering, mining industries, and other fields[6-7]. Therefore, it is necessary to develop new algorithms for diagnosing faulty rolling element bearings when operating at variable rotating speeds.
The order tracking technique[8-10]has become one of the most effective frequency analysis algorithms and it can be used to remove the influences of time-varying rotational speed. It can be divided into three types: hardware-based order tracking, computed order tracking[8] and order tracking based on instantaneous frequency estimation[11-12]. The essence of order tracking is resampling the original vibration signal at a constant angle increment to convert the non-stationary signal (in time domain) into a stationary one (in angular domain). In this way, we can obtain an order spectrum by the envelope demodulation algorithm[13-14] to diagnose faulty bearings. Signal resampling is the key step of order tracking analysis[8,11], which will directly influence the accuracy of the calculated results. Saavedra et al.[15] pointed out that there are two defects in the process of signal resampling, i.e., error and efficiency. The main causes of error in the order tracking algorithm are the process of resample times at constant angle intervals, and an interpolation procedure used to estimate the amplitude of the bearing signal at the resample times. On the other hand, the ordering track method is time consuming, since a large number of equations need to be solved in the process of estimating the shaft angular position. Furthermore, in many cases, the equations have no solutions.
For the above reasons, a state-of-the-art interpolation algorithm was proposed by Bossley et al.[10]. A high precision pulse counter and the interpolation method are used to improve the accuracy of the order tracking. In addition, Wang et al.[16] proposed the IFCF-based resampling algorithm. The essence of this algorithm is to reset the sampling data based on instantaneous fault characteristic frequency (IFCF) obtained from the time-frequency spectrum of the envelope signal and then obtaining the resampled signal by the interpolation method. These studies are important contributions to improving the order tracking technique. However, these methods have some shortcomings. On the one hand, Bossley et al. did not give consideration to the efficiency of the proposed signal, and financial costs of the high precision equipment also cannot be ignored. On the other hand, even though the method proposed by Wang et al. need not calculate a large number of equations, the accuracy of the results cannot be guaranteed.
Aimed at the shortcomings of the aforementioned algorithms, a novel resampling algorithm is proposed for rolling element bearing fault diagnosis under variable rotational speed conditions in this paper, which is named the equal division impulse-based (EDI-based) resampling algorithm. The speed-up and speed-down bearing vibration signals are measured on a test rig to test the improved performance of the proposed method. For the purpose of comparison, the computed order tracking and IFCF-based resampling algorithm are also investigated. The contrasting results show that the amplitude of the fault characteristic order (FCO) in envelope order spectrum is further improved. Also, the computational efficiency of the EDI-based resampling algorithm increases obviously. Hence, we can conclude that the proposed method is more suitable for diagnosing faulty bearings than the computed order tracking and the IFCF-based resampling algorithm under variable rotational speed conditions.
1.1 Computed order tracking
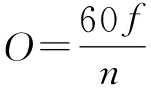
Order is defined as the frequency normalized by the rotational speed and it represents the number of cycles per revolution[11]. It can be calculated by
(1)
where O represents the order; f is the cycle frequency of vibration signal, Hz; n is the rotational speed of the reference shaft, revolution/min.
The formulas of fault characteristic frequency can be obtained in Ref.[17], based on these formulas and Eq.(1), the fault characteristic orders of the outer race, inner race and ball of the rolling element bearing can be calculated, respectively.
Fault characteristic order of the outer race:
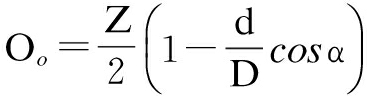
(2)
Fault characteristic order of the inner race:
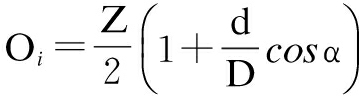
(3)
Fault characteristic order of the ball:
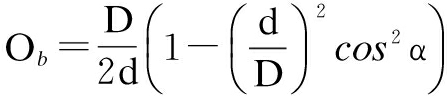
(4)
where Z is the number of the rolling elements; d is the diameter of the rolling element; D represents the pitch diameter; α is the contact angle.
The main steps of the computed order tracking are shown as follows:
1) Sample the vibration signal and rotating speed impulses signal of the reference shaft by the traditional synchronous sampling approach.
2) Obtain the speed curve of the reference shaft based on the impulses signal, then calculate the resample time marks of the even-angle sampling based on the speed curve.
3) Based on the resample time marks, an interpolation algorithm is applied to process the vibration signal for obtaining the resampled signal.
4) The envelope demodulation method is applied to the resampled signal for extracting the features of the faulty bearing.
According to the above steps, we can conclude that the key technique of the computed order tracking is signal resampling, and the main steps of signal resampling are listed as follows:
1) Speed curve fitting. A series of instantaneous speeds is obtained based on the impulse signal of the reference shaft. The impulse signal is measured by the encoder. The high degree curve is applied to fit the instantaneous rotational frequency for obtaining the speed curve. Fig.1 is the comparison of the instantaneous rotating frequency (blue dot) and rotating frequency curve (red solid line). As a general rule, the angular acceleration of the reference shaft is assumed to be a constant. With this assumption, the shaft angle θ can be described by a quadratic equation:
θ(t)=a0+a1t+a2t2
(5)
where the unknown coefficients a0, a1 and a2 are calculated by the impulse signal. Let the three continual impulses occur at times t1, t2 and t3, respectively, and the corresponding angles are 0, Δφ and 2Δφ. Substituting these angular values into Eq.(5), we can calculate the matrix formula as
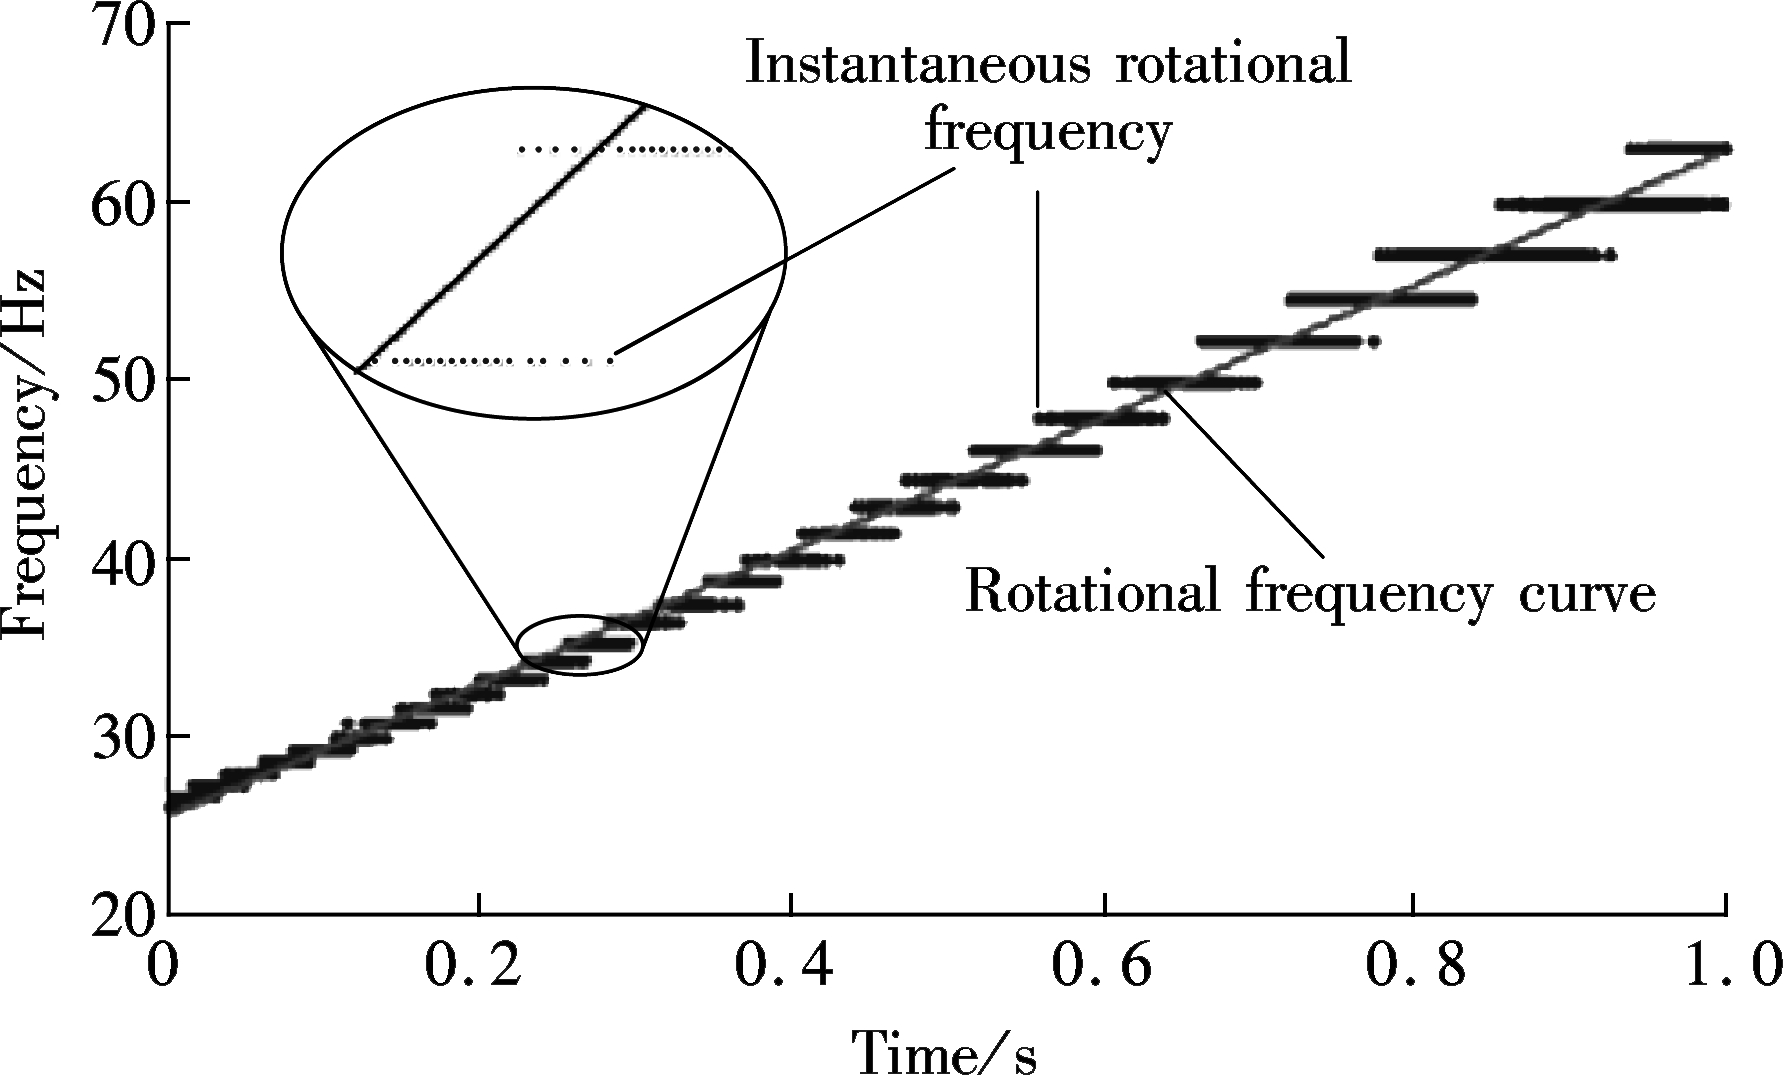
Fig.1 Instantaneous rotating frequency and rotating frequency curve
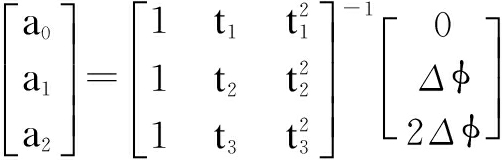
(6)
2) The even-angle sampling-time marks are obtained. Once the values of a1, a2 and a3 are calculated, the function relationship between any given constant shaft angular increment and its corresponding arrival times ti can be given as
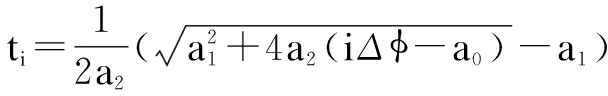
(7)
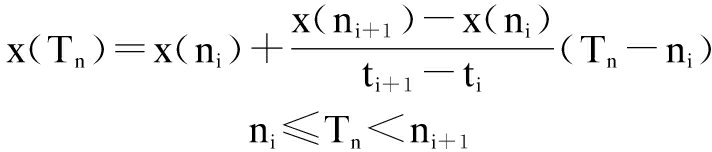
3) Even-angle resampling. Once the even-angle sampling-time marks for constant angle increments are calculated, the corresponding amplitudes at these times can be calculated by the interpolation method, such as the linear interpolation, cubic spline interpolation, Lagrange linear interpolation, etc. According to Ref.[8], the higher-order polynomials provide more accurate results. The Lagrange linear interpolation is employed in this paper and its formula is given as
(8)
where x(Tn) is the resampled signal; x(n) represents the original signal; ni and ni+1 represent two adjacent sampling-time marks in the constant-time interval sampling scheme.
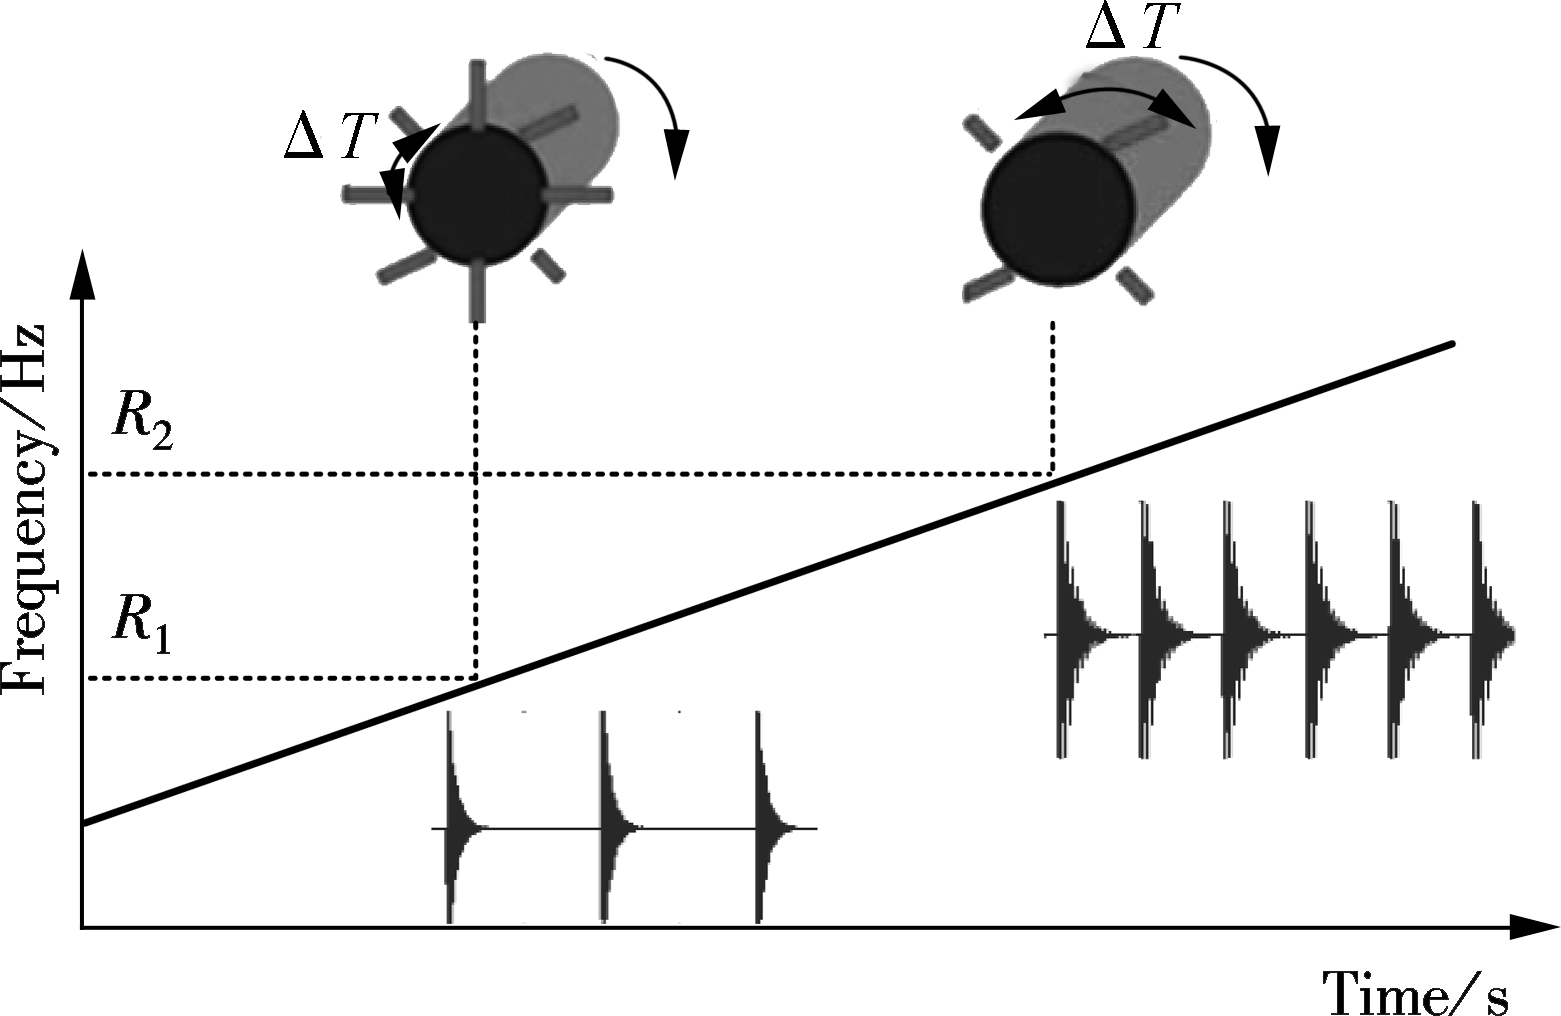
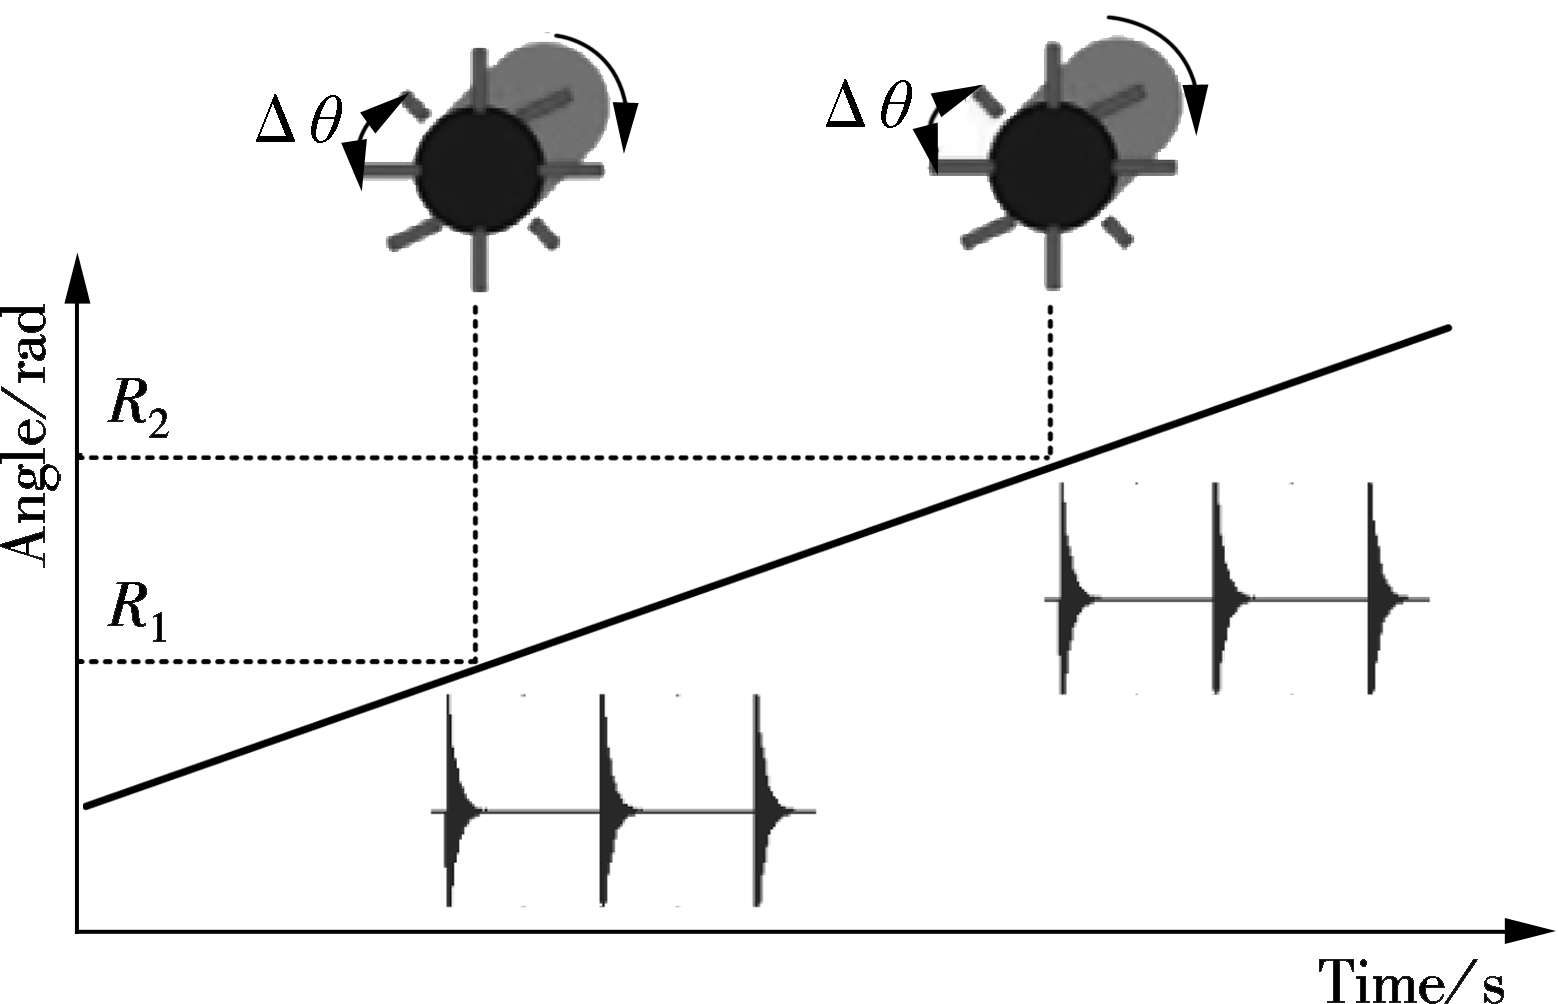
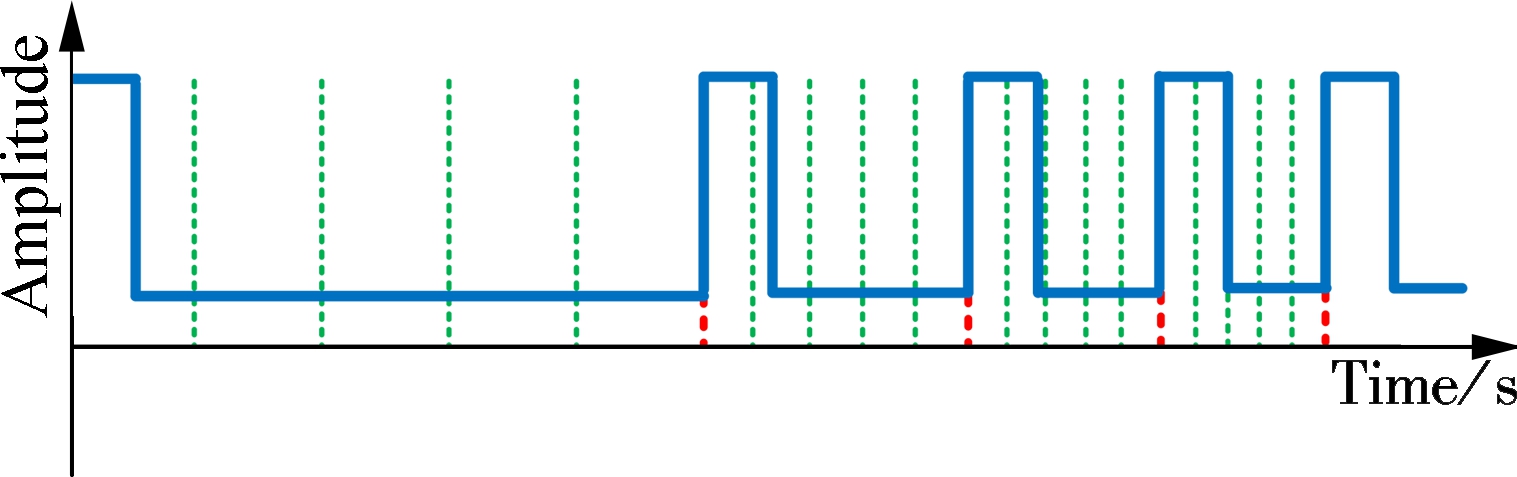
Fig.2(a) is the diagram of the bearing signals measured by the constant-time interval sampling scheme. As is evident in Fig.2(a), compared with the pulse interval at a larger rotate speed R2, the pulse interval at a smaller rotate speed R1 is larger.Fig.2(b) is the diagram of bearing signals which is processed by the signal resampling method. We find that the pulse intervals at different rotate speeds are identical.
According to the above analysis, the computed order tracking is an effective tool to eliminate the speed fluctuation effect, however, it also has some defects. The sources of defects can be classified into two types:
1) Error caused by rotate speed curve fitting. On the one hand, a0, a1 and a2 are determined by the assumption of constant angular acceleration. However, angular acceleration of the reference shaft is changed over time. On the other hand, there is error in the process of calculating the speed curve based on instantaneous speed. It is clear in Fig.1 that, at some points, there are two or even more instantaneous speeds, and we only choose one to fit the speed curve. These errors will cause spectral noise, namely, the fault characteristic orders will be easily buried by noise, and they cannot even be found in the envelope order spectrum.
2) Defect of computational efficiency. We need to cal-culate a large number of quadratic equations for obtaining the even-angle sampling-time marks, and the computational efficiency is very low. On the other hand, the equations have no solutions in many cases.
(a)
(b)
Fig.2 Pulse signals measured by different sampling schemes. (a) Constant-time interval; (b) Constant-angle interval
1.2 IFCF-based resampling algorithm
The IFCF-based resampling algorithm is proposed by Wang et al[16]. The instantaneous fault characteristic frequency (IFCF) is extracted from the time-frequency representation of the envelope signal, which can be used to substitute the bearing rotating frequency (RF). Detailed information of IFCF is referred to in Ref.[16]. The essence of the resampling algorithm is choosing the proper sampling rate in accordance with the rotational speed; namely, the original signal is divided into a number of parts, larger speed parts with a faster sampling rate and lower speed parts with a lower one. The ratio of the sampling rates of two different time segments is equal to the ratio of the rotational frequency. It should be noted that we use the bearing rotating frequency (RF) to resample the signal in this paper. The steps of the IFCF-based resampling algorithm are given as follows:
1) Divide the original signal into n parts, named x1,x2,…,xn, and every part of the signal has a rotational frequency RF1, RF2,…,RFn.
2) Define the baseline sample rate, namely,
fs,base=Fs
(9)
where Fs is the sampling rate of the original signal.
The initial RF is calculated as
RFbase=min(RF1,RF2,…,RFn)
(10)
3) Based on the ratios of the rotational frequency of xi, the sampling rate of xi is determined as
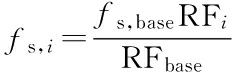
(11)
4) Signal resampling is based on the computed sampling rates fs,i. First, the new sampling point is determined based on the new sampling rate fs,i. Secondly, based on the original signal xi, the resampled signal ![]() i is determined by polynomial interpolation. Finally,
i is determined by polynomial interpolation. Finally, ![]() is arranged by the value of i, and the resampled signal is shown as x1,x2,…,xn.
is arranged by the value of i, and the resampled signal is shown as x1,x2,…,xn.
The IFCF-based resampling algorithm is effective in rolling element bearing fault diagnosis under variable rotational speed conditions. It does not need to solve many equations, and the computational efficiency can be improved clearly. However, it has errors in the process of calculating the reset sampling rate, which can influence the results.
According to the above analysis, a novel resampling algorithm is proposed to resolve these difficulties in the field of rolling element bearing fault diagnosis. In many mechanical applications, rotating speed pulse signal is usually collected by the encoder. One of the most important parameters of the encoder is resolution ratio, which can be described by the number of pulses per rotational period. If the type of the encoder is determined, the number of pulses per revolution of the shaft is constant, and angle intervals of every adjacent pulse are also constant. Based on the above principle, the rotating speed pulse signal measured by the encoder can be used to calculate the even-angle sampling-time marks without fitting the speed curve. The main steps of the EDI-based resampling are given as follows, and the schematic diagram is presented in Fig.3.
The time marks ti(i=1,2,…,k) of every rising edge of rotating speed pulses and the corresponding amplitudes of vibration signal xi(i=1,2,…,k) are determined. ti is the intersection between red dash line and timeline as shown in Fig.3(b). xi is the intersection between the red dash line and the vibration signal, as shown in Fig.3(a).
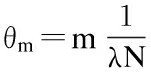
The time intervals of the adjacent rotate speed pulses are calculated and the largest one is selected, named Δtmax. The minimum angle increment, namely, the sampling rate in the angle domain Fo, is calculated by original signal; λ is the presupposed equal division number. As shown in Fig.3(a), the adjacent rotate speed pulses are divided by green dash lines, and λ=4.
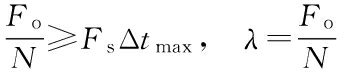
(12)
where N is the number of rotate speed pulses per revolution of the reference shaft, and it is constantly determined by the type of the encoder; Fs is the sampling rate of the

(a)
(b)
(c)
Fig.3 Schematic diagram of the EDI-based resampling algorithm. (a) Original signal; (b) Pulse signal; (c) Resampled signal
The time marks in every adjacent rotate speed pulses ![]() ) are determined, and their corresponding amplitudes of vibration signal
) are determined, and their corresponding amplitudes of vibration signal ![]() ) are obtained based on the Lagrange linear interpolation, where i=1,2,…,k;j=1,2,…,λ.
) are obtained based on the Lagrange linear interpolation, where i=1,2,…,k;j=1,2,…,λ.![]() and
and ![]() are arranged according to the order of i and j, and a set [tm,xm]is obtained.
are arranged according to the order of i and j, and a set [tm,xm]is obtained. ![]() is transformed into its corresponding angle and[θm,xm] is the resampled signal.
is transformed into its corresponding angle and[θm,xm] is the resampled signal.
(13)
Based on the above schematic diagram, we can conclude that the proposed method does not need to fit the rotational frequency curve, or compute a large number of quadratic equations, hence it is free of errors in curve fitting and variable angular acceleration, and also has satisfactory computational efficiency. As a result, the proposed method has theoretical advantages compared with other resampling methods.
The effectiveness of the EDI-based resampling algorithm is verified using experimental bearing vibration signals in this section. Experimental data is measured on the rolling element bearing test rig as shown in Fig.4. Fig.5(a) displays the tested bearing with an outer race fault, and Fig.5(b) is the tested bearing with an inner race fault. The faulty bearing 6000 is driven by a motor, whose geometry parameters, fault characteristic coefficients (FCC) of the outer race and inner race are listed in Tab.1, respectively. The driver motor is controlled by the speed controller. The signal is collected by an acceleration sensor, YE6321 acquisition card and its corresponding software. The pulse signal is collected by the encoder which is fixed on the bearing shaft, and the resolution ratio of the encoder is 30. The sampling rate is 24 kHz.
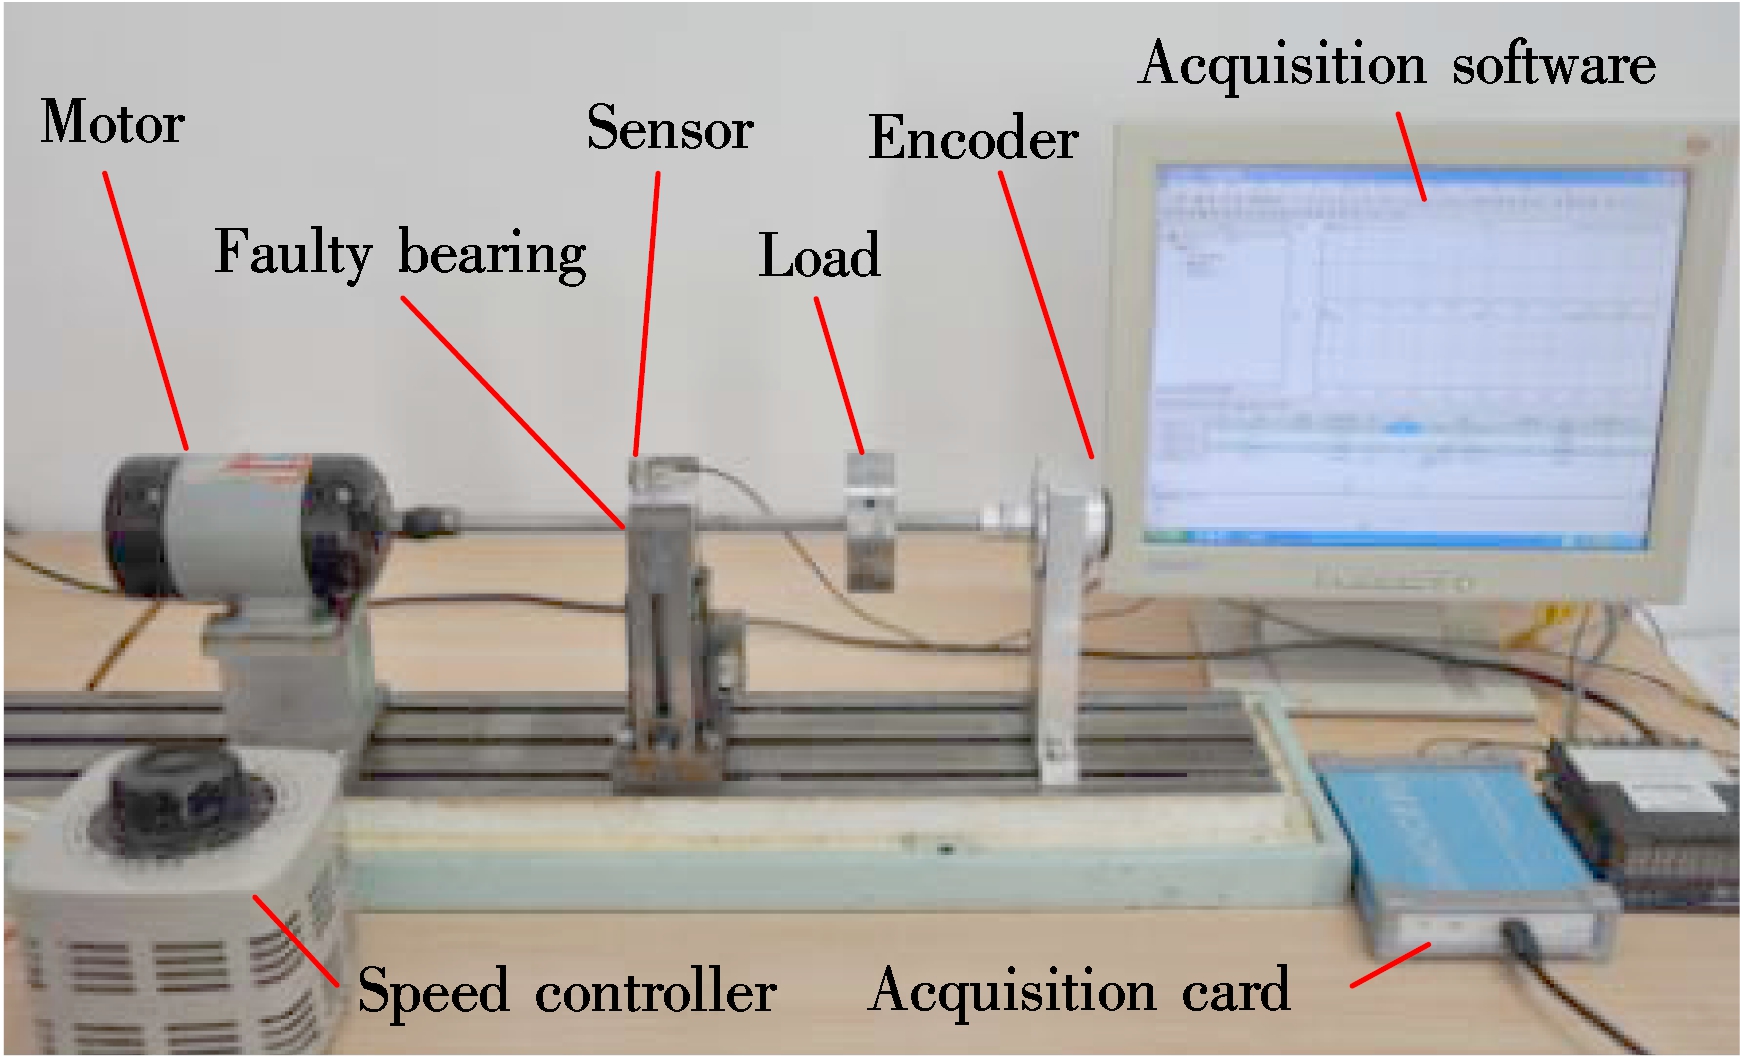
Fig.4 Layout of test rig
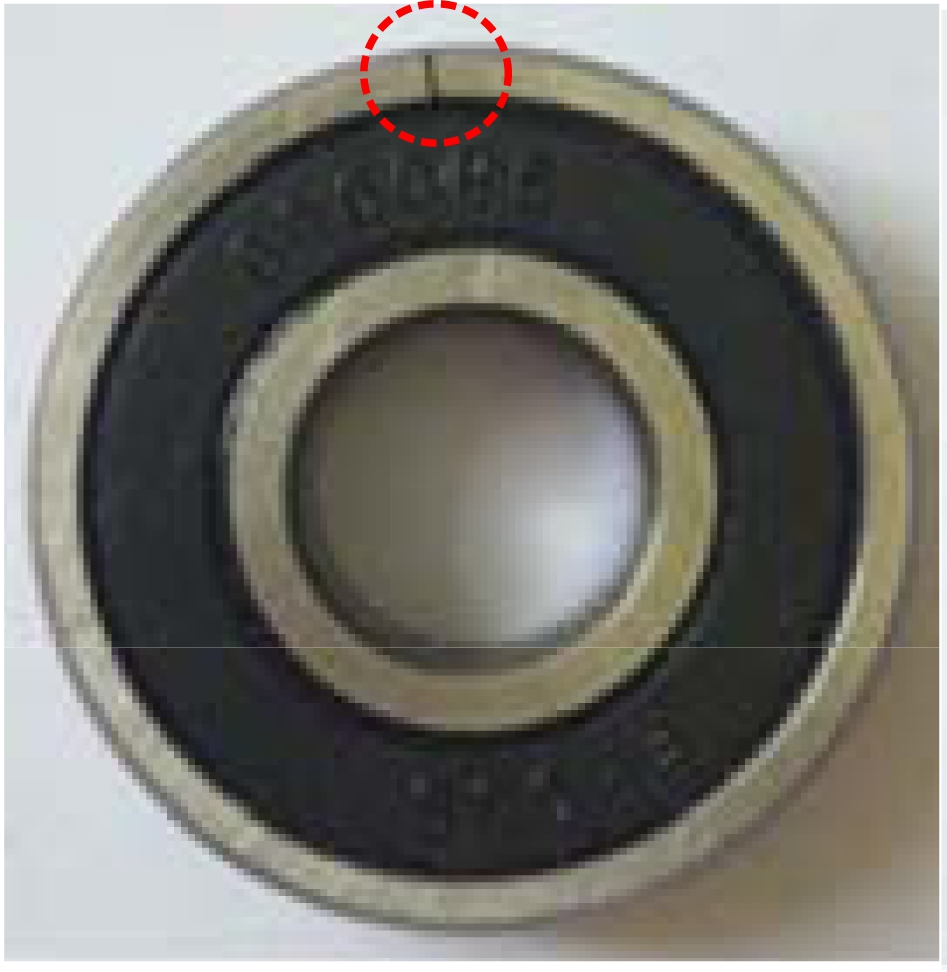
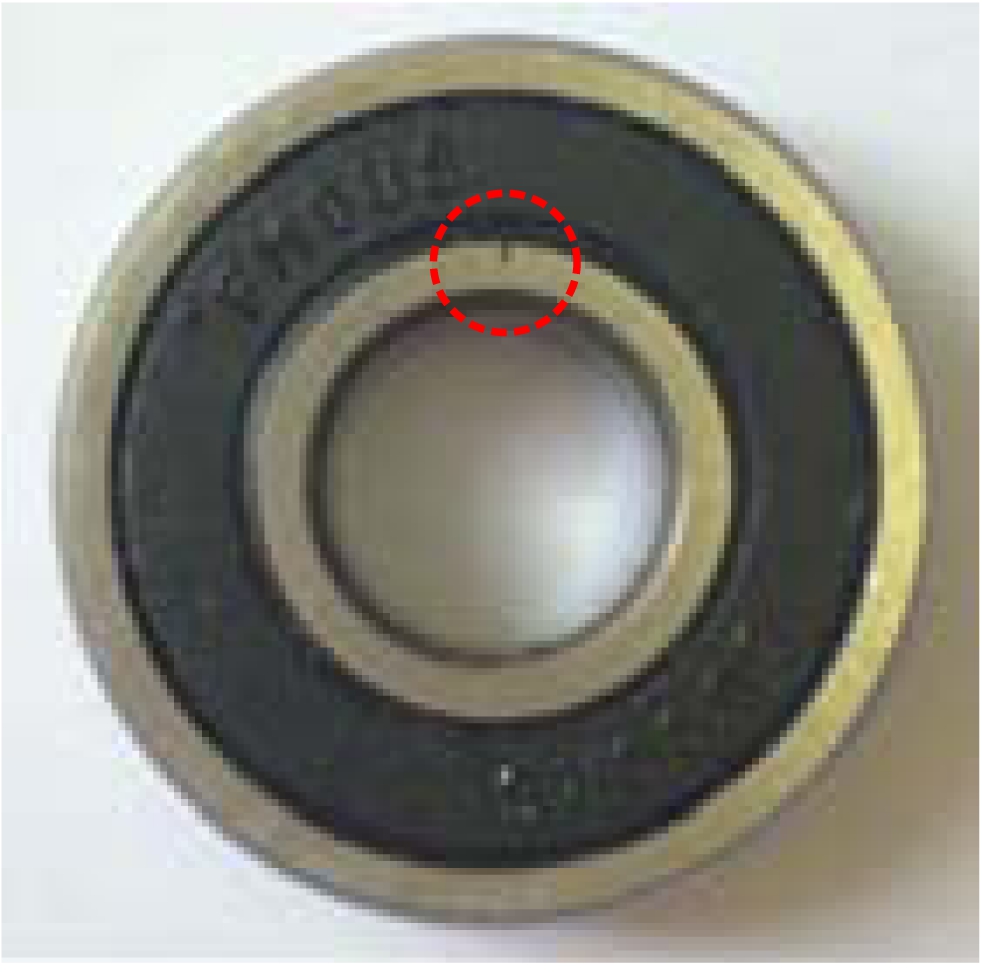
(a) (b)
Fig.5 Tested bearing. (a) Outer race fault; (b) Inner race fault
Tab. 1 Experimental bearing details and fault characteristic coefficients
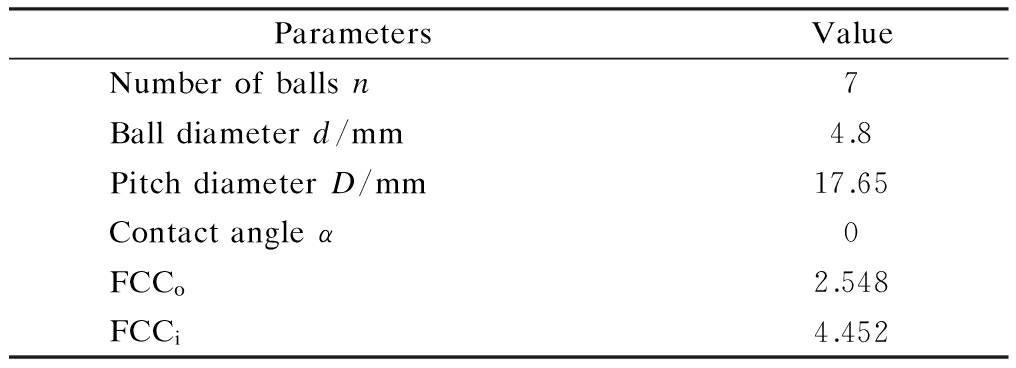
ParametersValueNumberofballsn7Balldiameterd/mm4.8PitchdiameterD/mm17.65Contactangleα0FCCo2.548FCCi4.452
3.1 Speed-up signal of rolling element bearing with an outer race fault
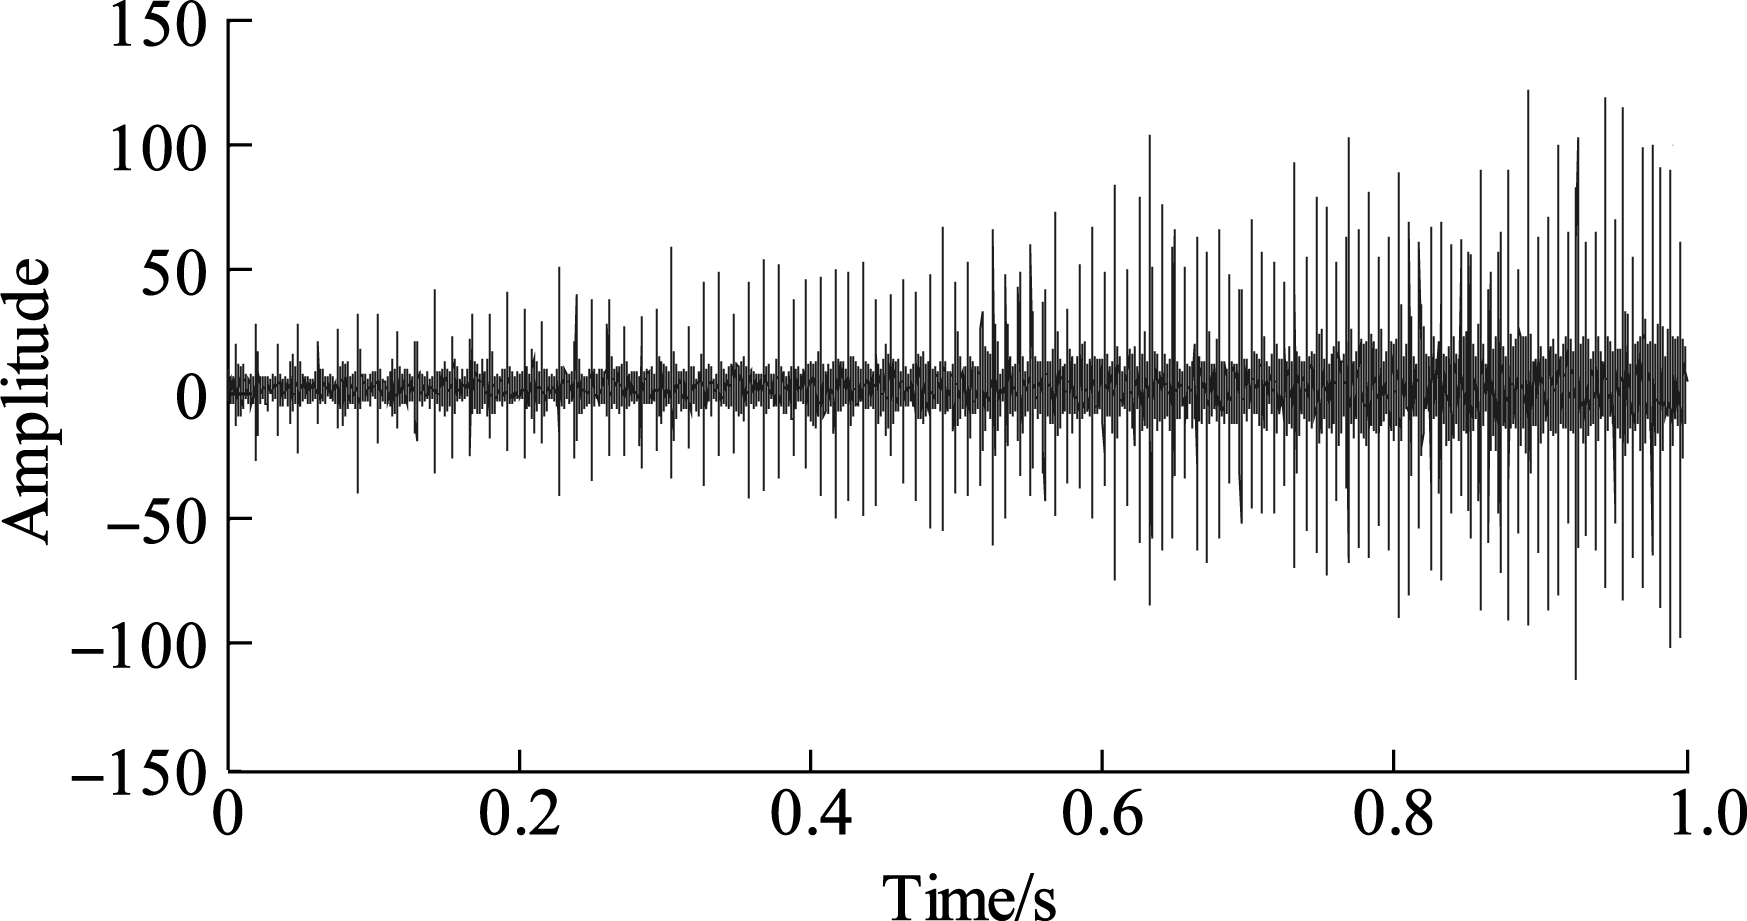
In this subsection, the performance of the proposed method is investigated by the speed-up signal of the rolling element bearing with an outer fault measured on the test rig. The rotating speed increases from 1 500 to 3 720 r/min following a nearly linear variation. The original vibration signal and its associated shaft rotational speed pulses are collected for 1 s, which are shown in Figs.6(a) and (b), respectively. Fig.6(a) shows that the amplitude of the vibration signal increases when the rotational speed increases.
(a)
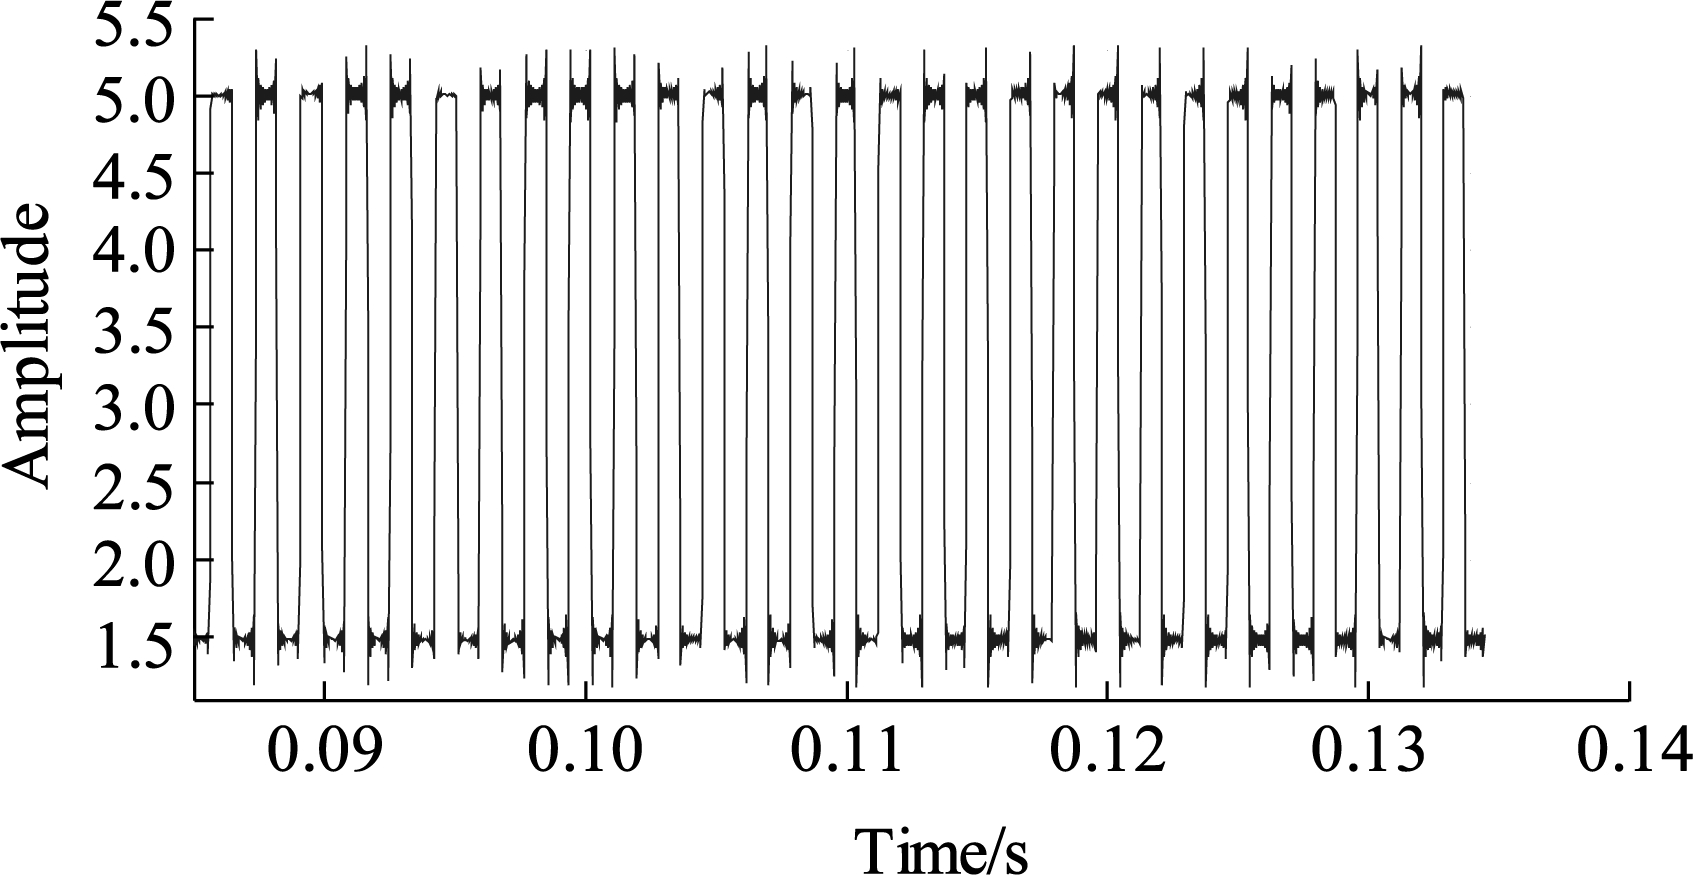
(b)
Fig.6 Measured signal under acceleration. (a) Bearing vibration signal; (b) Enlarged drawing of rotating speed pulses
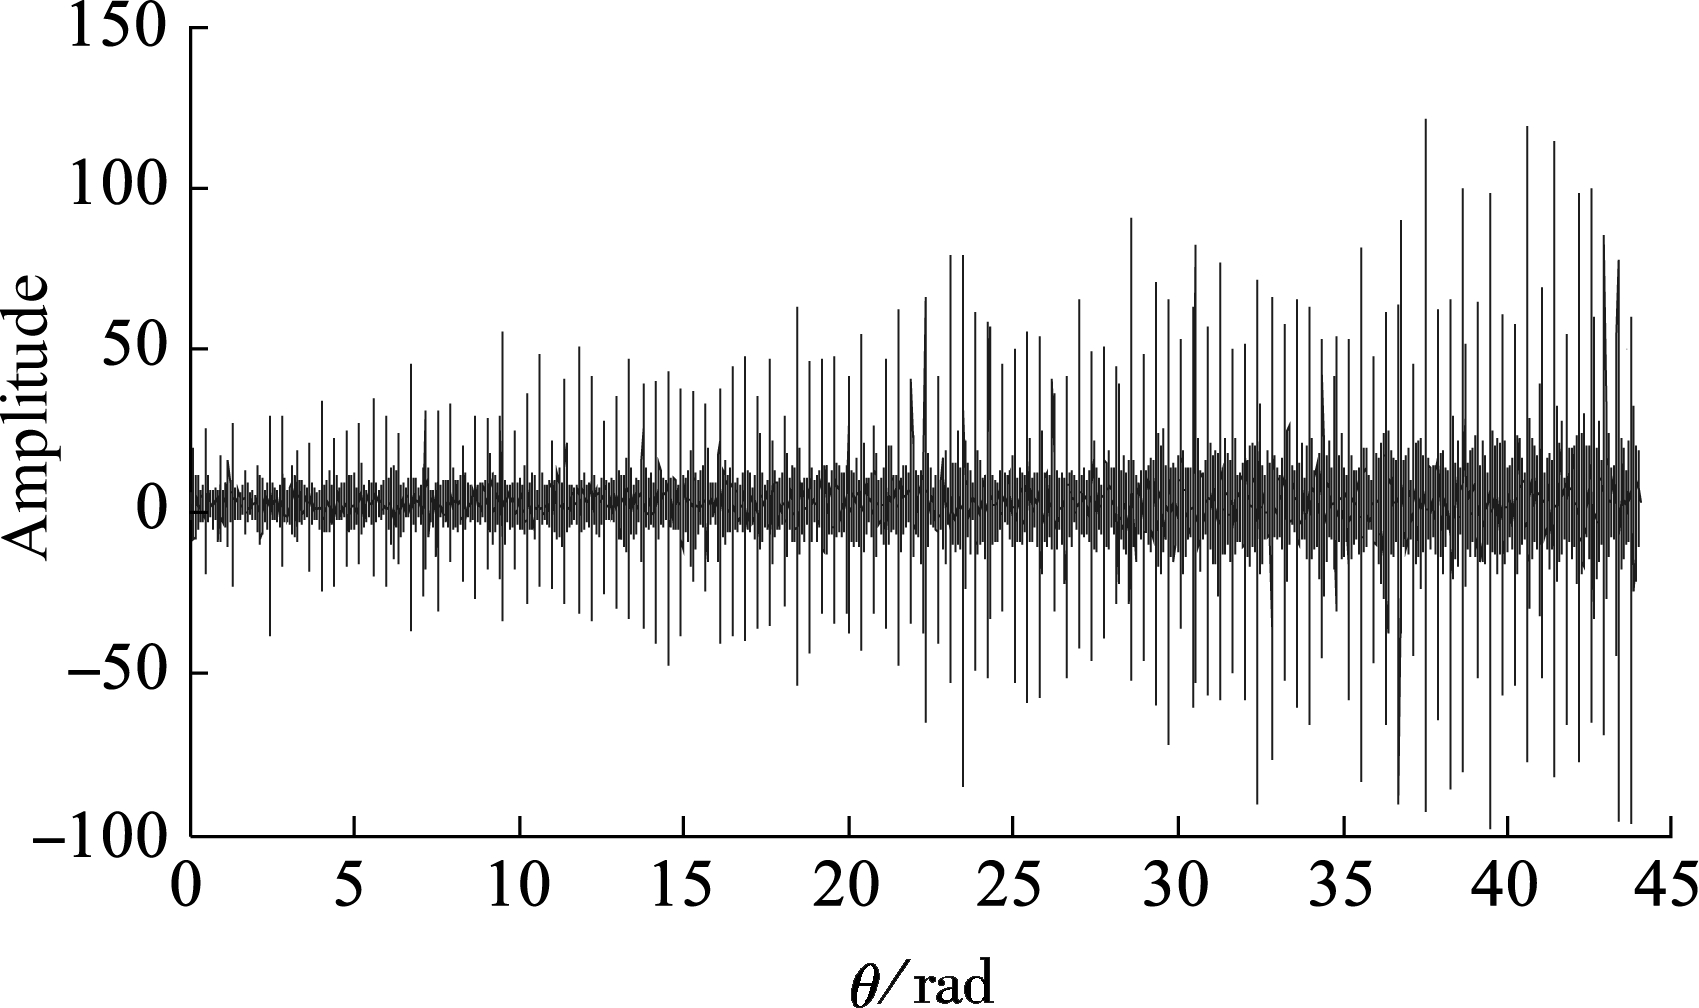
First, the time marks ti(i=1,2,…,k) of every rising edge of rotating speed pluses, and their corresponding amplitudes of vibration signal xi(i=1,2,…,k) are obtained. The second step is to calculate the time intervals of the adjacent rotate speed pulses and sampling rate in the angle domain. Then, we can determine the time marks ![]() in every adjacent rotate speed pulses and their corresponding amplitudes of vibration signal
in every adjacent rotate speed pulses and their corresponding amplitudes of vibration signal ![]() . Finally, an arranged and transformed set[θm,xm]is obtained, which is the resample signal as presented in Fig.7(a).
. Finally, an arranged and transformed set[θm,xm]is obtained, which is the resample signal as presented in Fig.7(a).
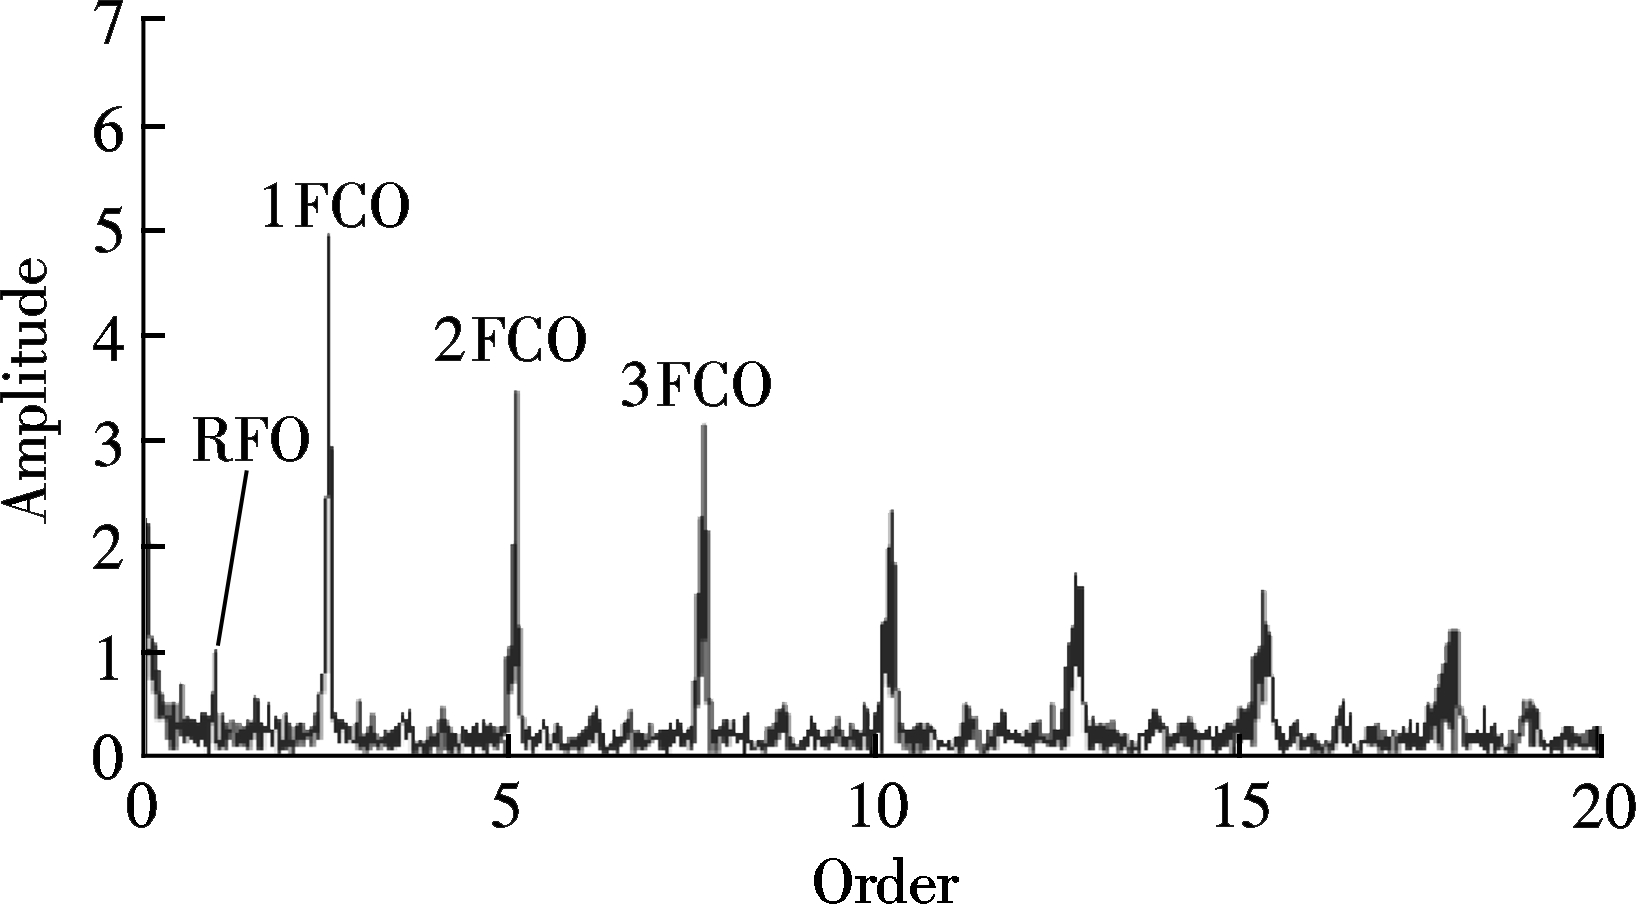
The envelope demodulation method is applied to the resampled signal for obtaining the envelope order spectrum, as shown in Fig.7(b). As displayed in the envelope order spectrum, the fault characteristic order (FCO) and its harmonics are easily identified. The rotational frequency order (RFO) of the bearing is also easily found. The values of the FCO and the RFO are 2.563 and 1, respectively. Hence, the fault characteristic coefficient is 2.563, and the actual value is 2.548. As a result, we can determine that the rolling element bearing has an outer race fault.
To further examine the advantages of the method in aspect of computational accuracy and efficiency, the original signal is processed by the competed order tracking and the IFCF-based resampling method, and the envelope order spectrums are shown in Figs.8(a) and (b), respectively. Compared with Fig.8, the peak values in Fig.7(b) are higher. The amplitude of each harmonic and the computation time obtained by different methods are listed in Tab.2. In order to make the changes easier to observe, we draw column graphs as shown in Fig.9 and Fig.10.
(a)
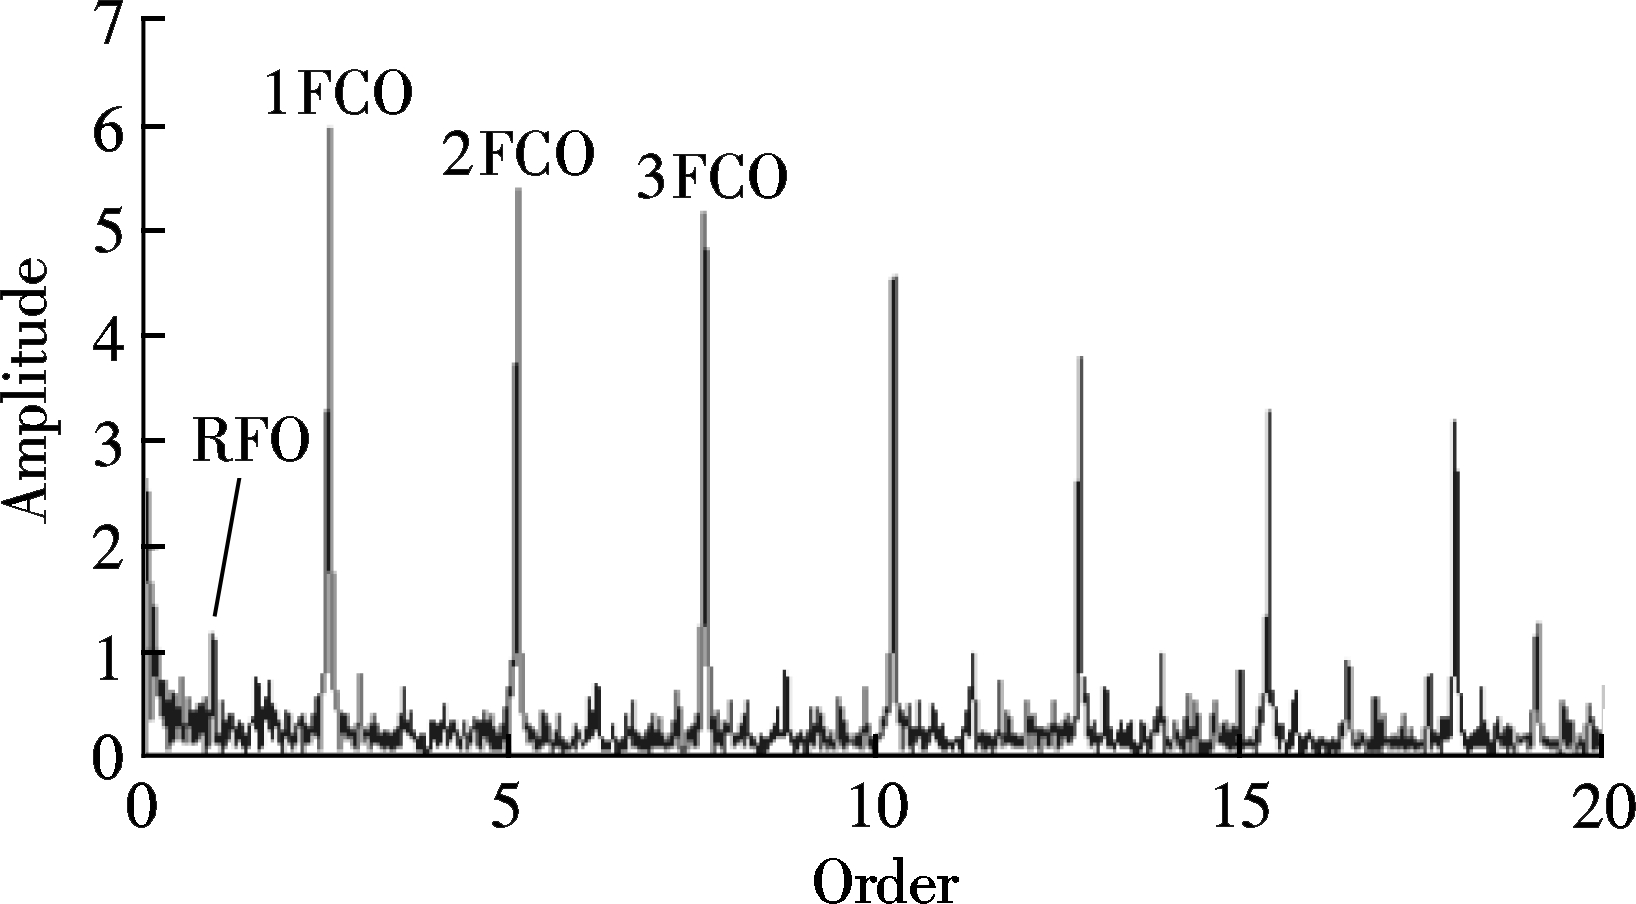
(b)
Fig.7 Analysis results using the proposed method. (a) Resampled signal; (b) Envelope order spectrum
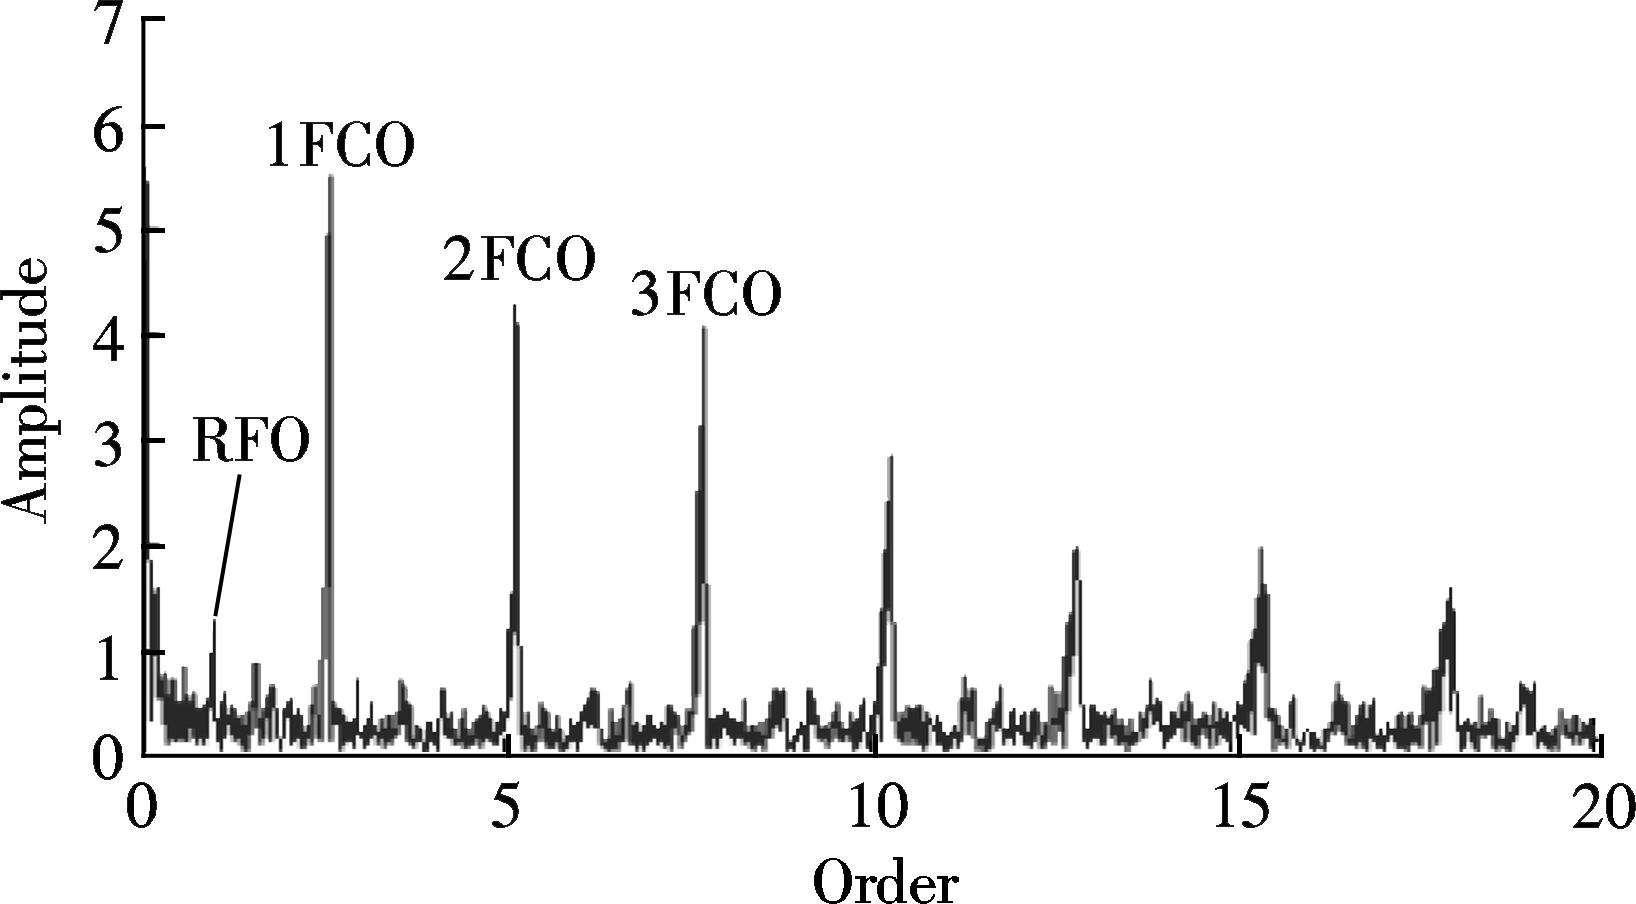
(a)
(b)
Fig.8 Envelope order spectrums under acceleration obtained by different algorithms. (a) Computed order tracking; (b) IFCF-based resampling algorithm
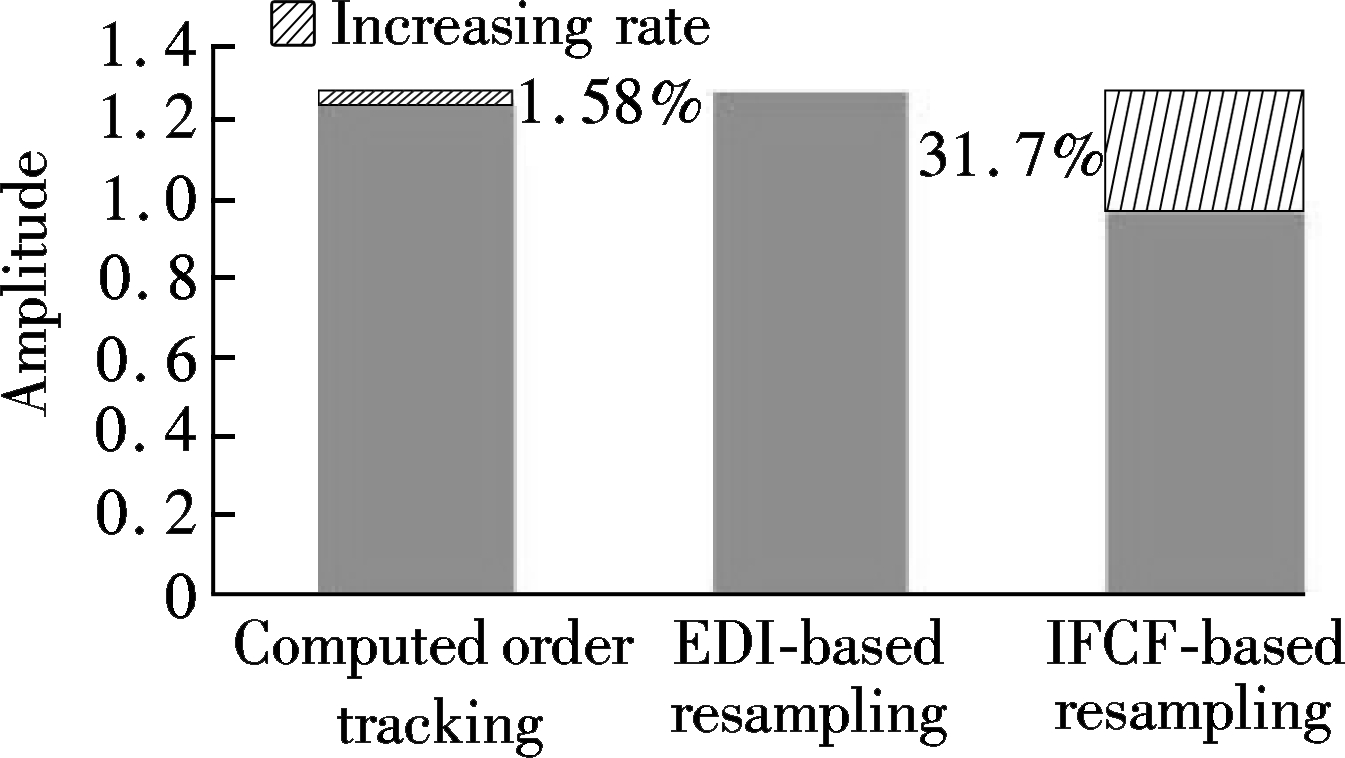
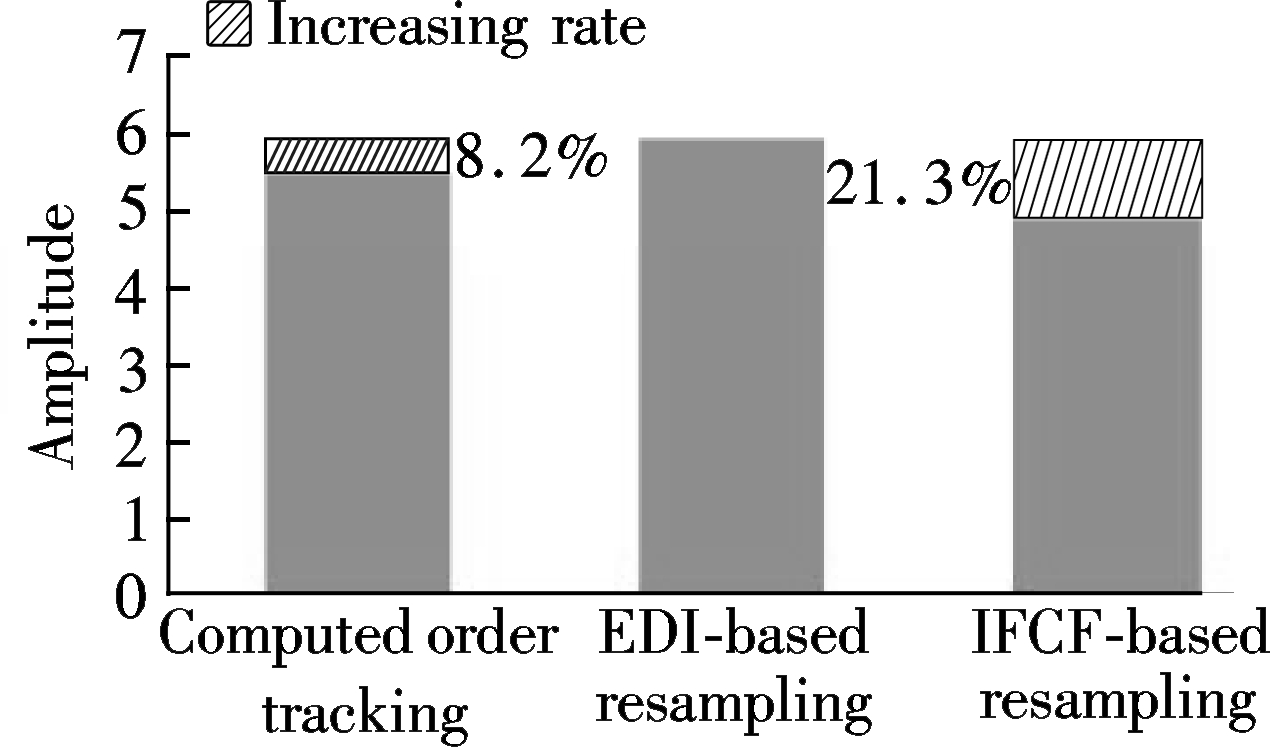
As shown in Fig.9(a), the amplitude of the RFO in the envelope order spectrum obtained by the proposed method is much higher than those obtained by the computed order tracking and the IFCF-based resampling method, and the increase rates are 1.58% and 31.7%, resp-ectively. Fig.9(b) is the comparison of the amplitude of the FCOs obtained by the above three methods, and the increase rates of the FCO obtained by the proposed method are 8.2% and 21.3%, respectively.
Tab.2 Order amplitude and computation time under acceleration
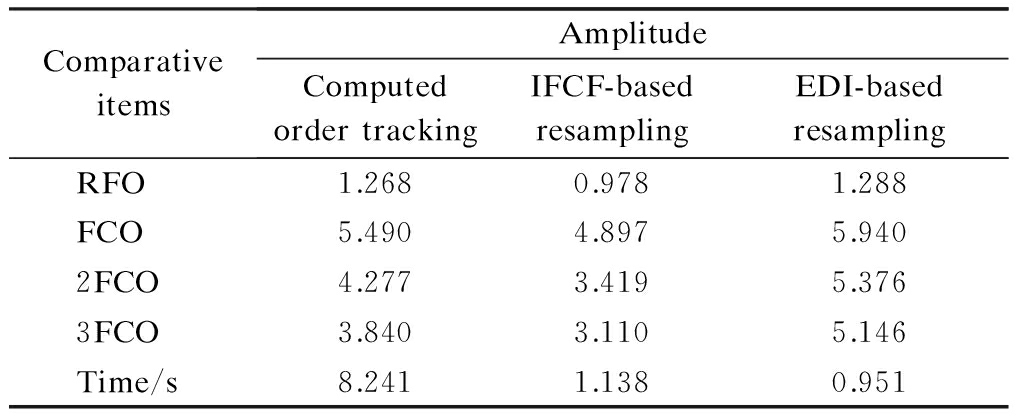
ComparativeitemsAmplitudeComputedordertrackingIFCF-basedresamplingEDI-basedresamplingRFO1.2680.9781.288FCO5.4904.8975.9402FCO4.2773.4195.3763FCO3.8403.1105.146Time/s8.2411.1380.951
(a)
(b)
Fig.9 Amplitude comparison under acceleration. (a) RFOs; (b) FCOs
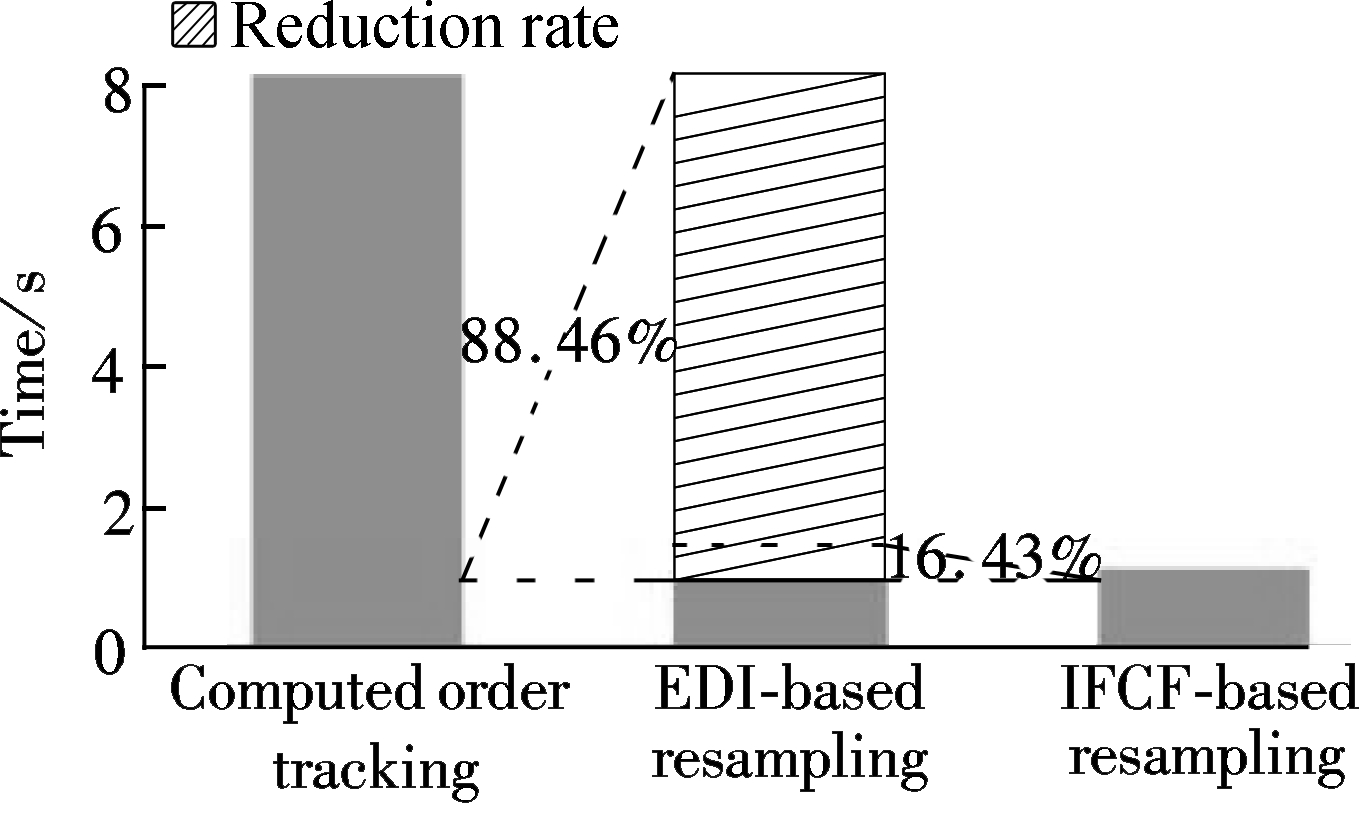
Fig.10 Comparison of computation time under acceleration
To verify the computational efficiency of the proposed method, the changes of computation time among the three methods are presented in Fig.10. The proposed method requires less computation time than the computed order tracking, and the reduction ratio is 88.46%. In addition, compared with the IFCF-based resampling method, the computation time of the proposed algorithm decreases by 16.43%.
Based on the above experimental studies, we can conclude that the proposed algorithm has obvious advantages in not only the computational accuracy, but also in the computational efficiency. Therefore, it is more suitable for bearing fault diagnosis under time-varying rotational speed conditions than other methods.
3.2 Experimental speed-down signal of rolling element bearings with an inner race fault
In this subsection, the speed-down signal of the rolling element bearing with an inner race fault is measured for verifying the effectiveness of the proposed method. The rotating speed goes down from 1 260 to 900 r/min following a nearly linear variation. The bearing signal is shown in Fig.11 and its corresponding rotational speed pulses are collected for 3 s.
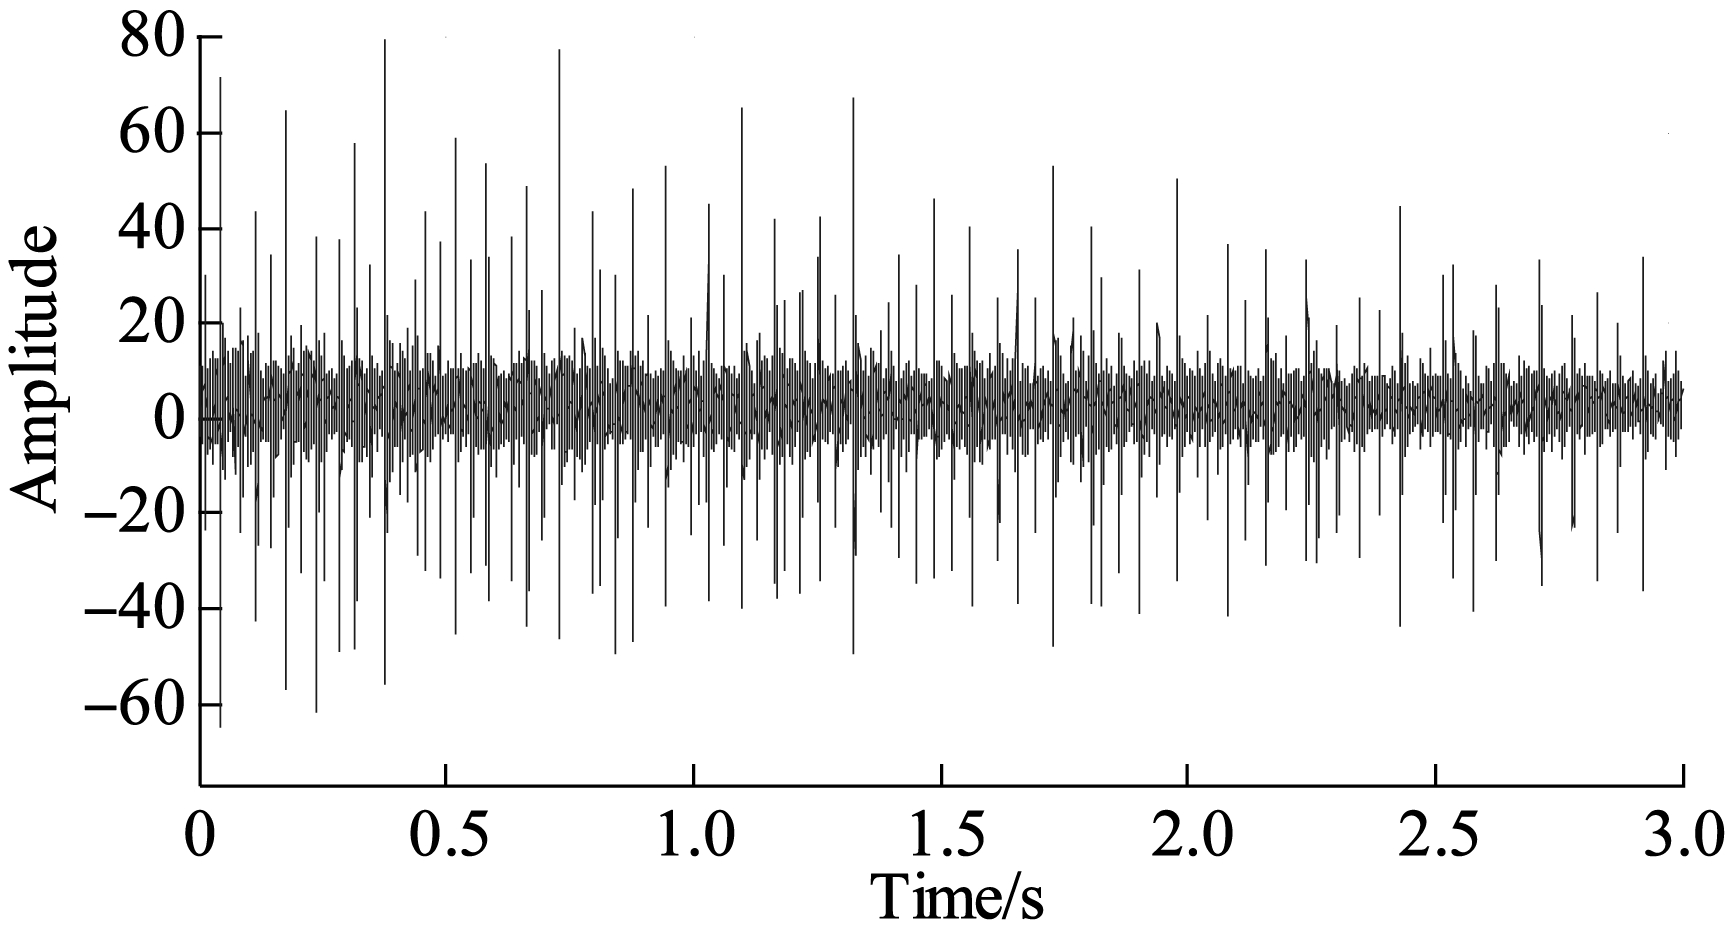
Fig.11 Bearing vibration signal under deceleration
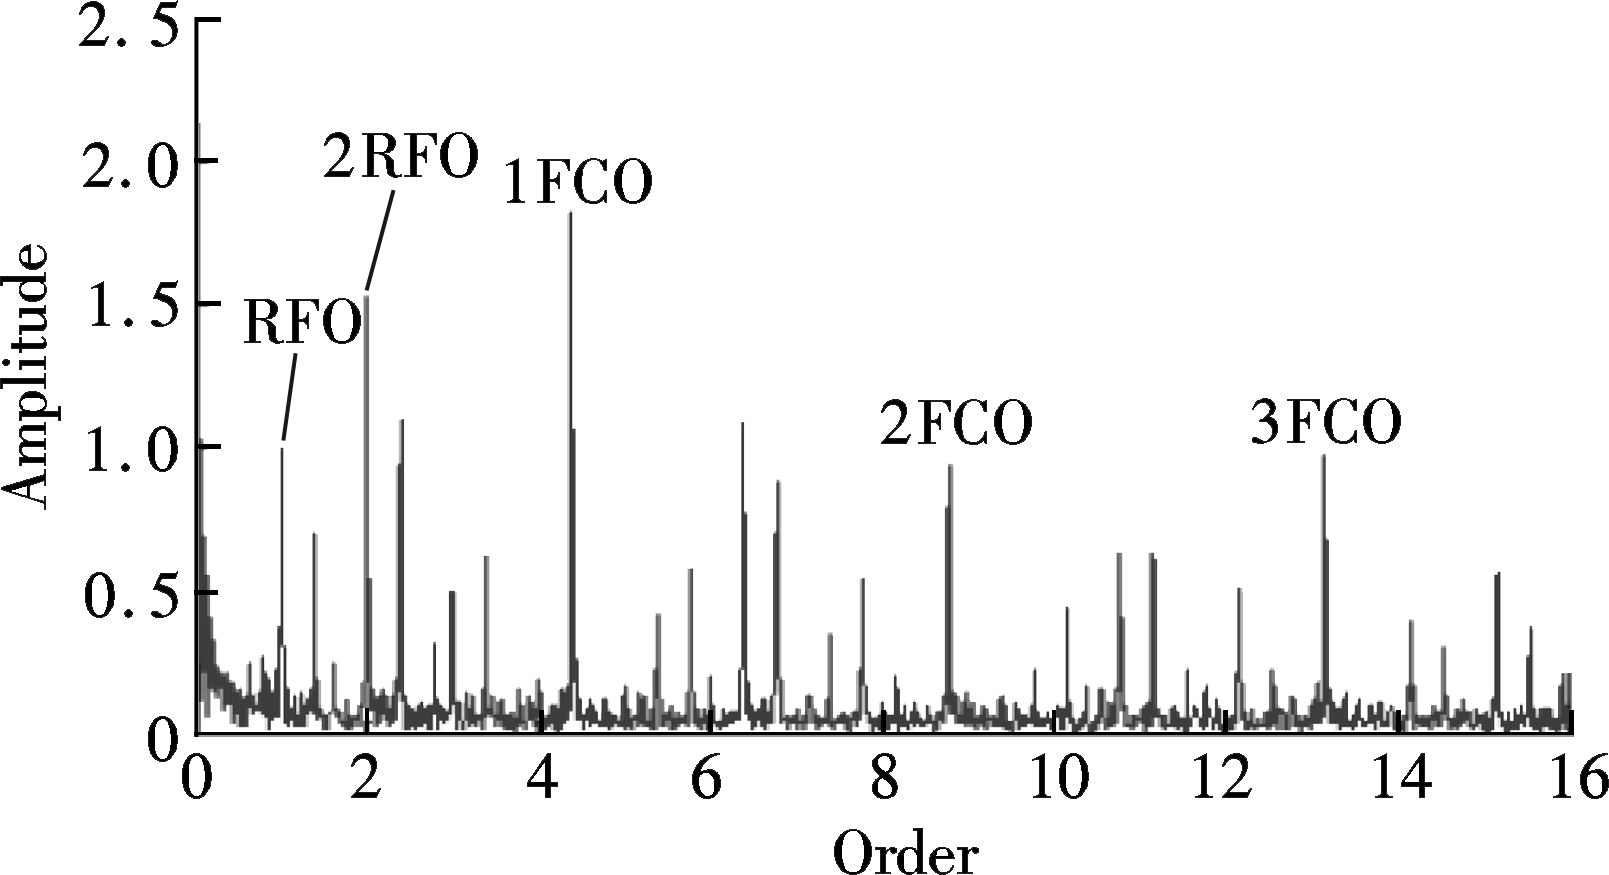
Based on the bearing signal and its corresponding rotating speed pulses signal, the resampling signal is obtained using the EDI-based resampling algorithm. Fig.12 is the envelope order spectrum of the resampled signal obtained by the envelope demodulation method. From this diagram, the RFO and its 2nd harmonic, the FCO and its 2nd, 3rd harmonics are clearly revealed. The values of the RFO and the FCO are 1 and 4.431, respectively, and the measured FCC is 4.431,which is practically identical to 4.452; i.e., the FCCi is listed in Tab.1. Hence, we can conclude that the rolling element bearing has an inner race fault.
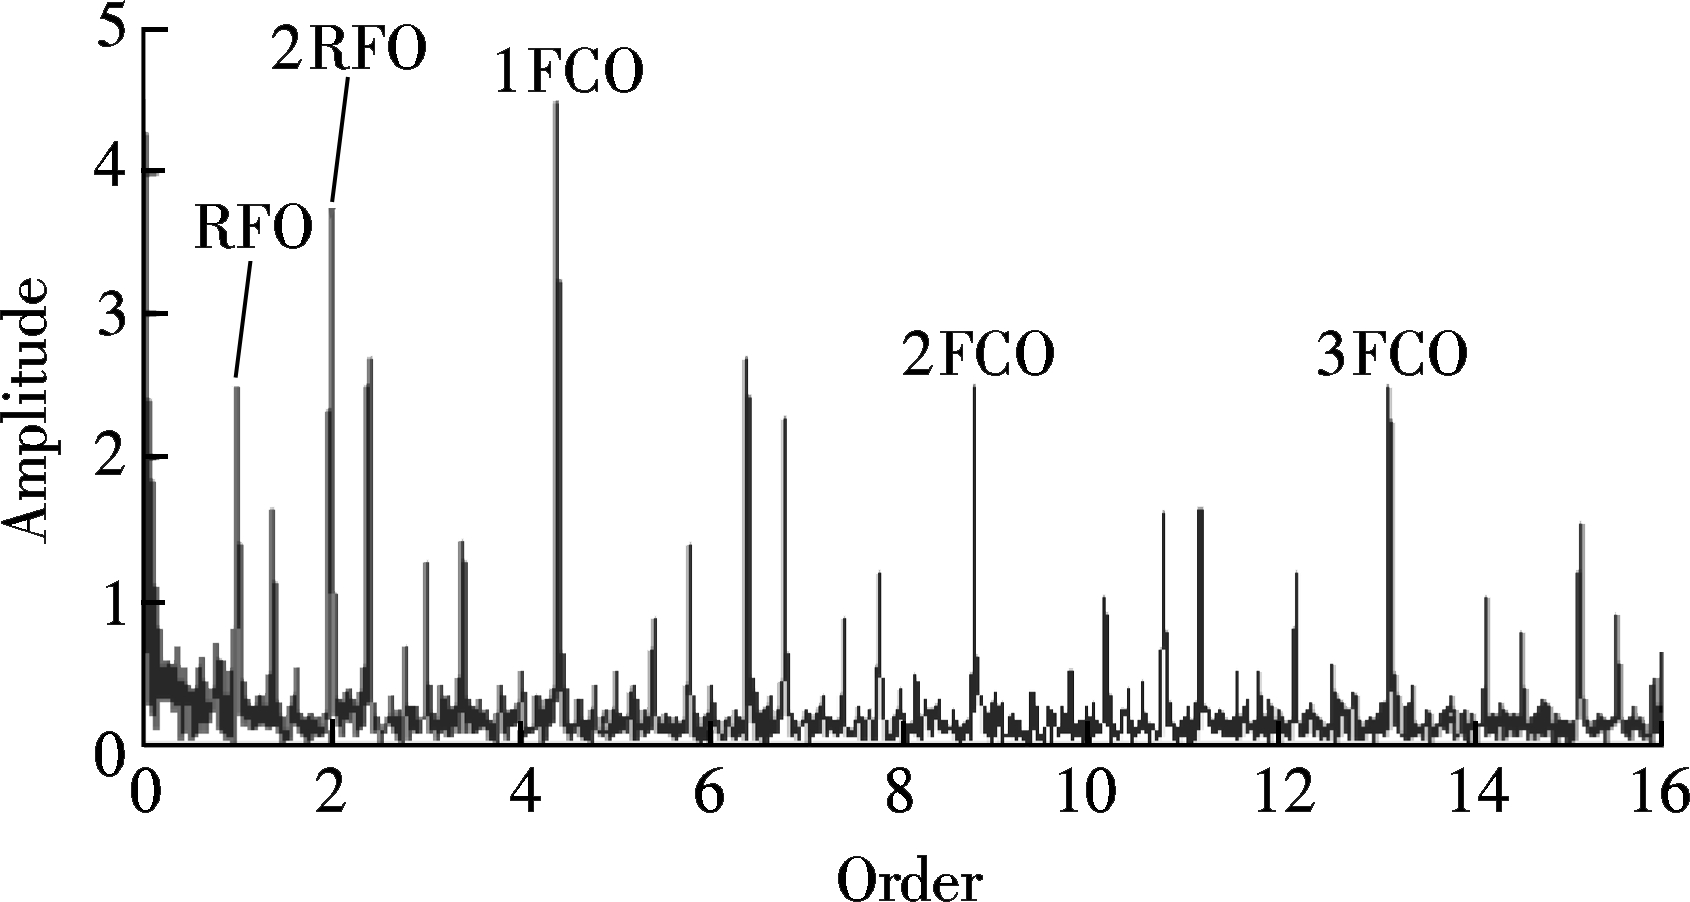
Fig.12 Envelope order spectrum under deceleration obtained by the proposed method
In order to verify the advantages of the proposed method in aspect of computational accuracy and efficiency, the target bearing signal is also analyzed by computed order tracking and IFCF-based resampling algorithms. The envelope order spectrums are presented in Figs.13(a) and (b), respectively. The amplitude of RFOs, FCOs and computation time obtained by the above three methods are listed in Tab.3. Column graphs are drawn based on Tab.3 for clearly showing the changes, as shown in Fig.14 and Fig.15.
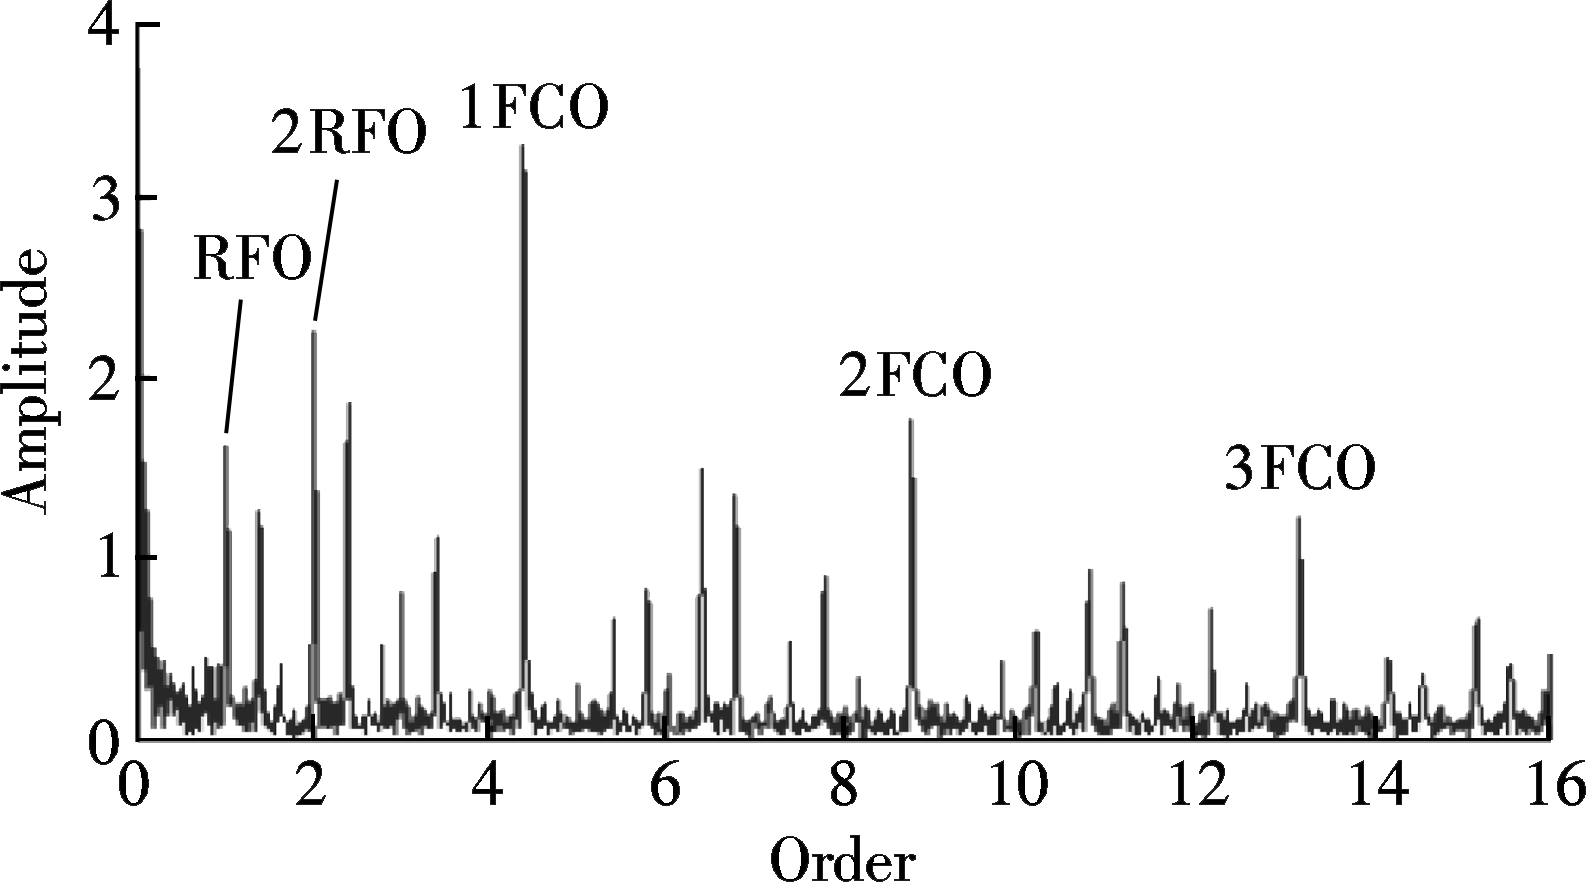
(a)
(b)
Fig.13 Envelope order spectrums under deceleration obtained by different algorithms. (a) Computed order tracking; (b) IFCF-based resampling algorithm
(a)
(b)
Fig.14 Amplitude comparison under deceleration. (a) RFOs; (b) FCOs
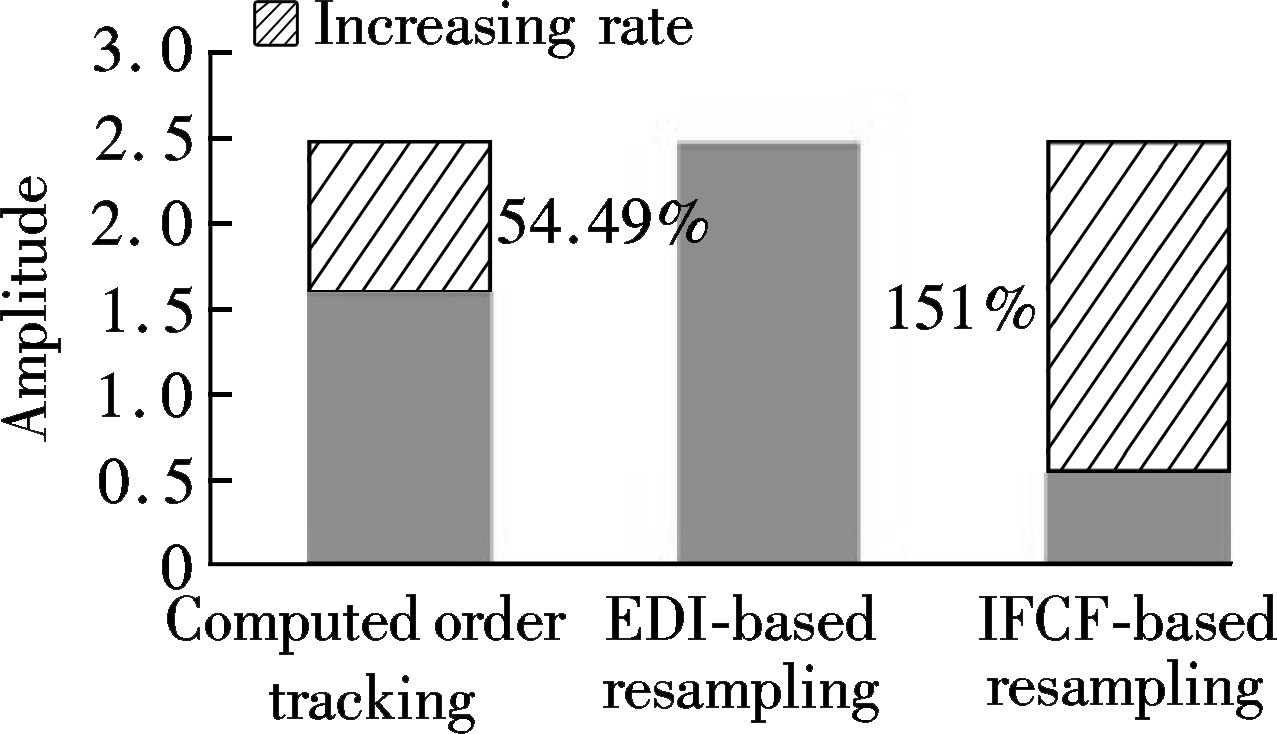
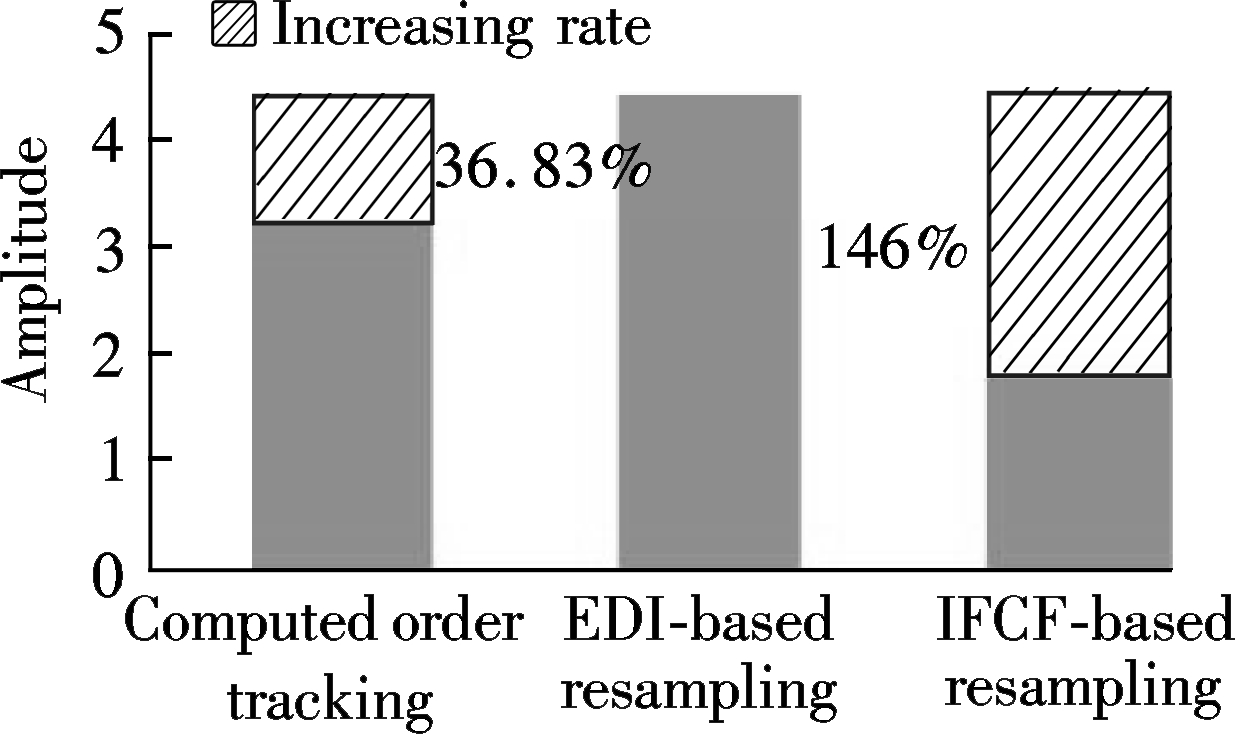
As shown in Fig.14(a), the amplitude of the RFO in the envelope order spectrum obtained by the proposed method is higher than those obtained by the computed order tracking and the IFCF-based resampling method, and the increase rates are 54.49% and 151%, respectively. Fig.14(b) are the comparisons of the amplitude of FCOs, and the increase rates are 36.83% and 146%, respectively. The comparative results of computation time among different methods are presented in Fig.15. The computed order tracking and the IFCF-based resampling are time-consuming. Compared with the above two methods, the computation time of the proposed method is reduced by 92.77% and 36.75%, respectively.
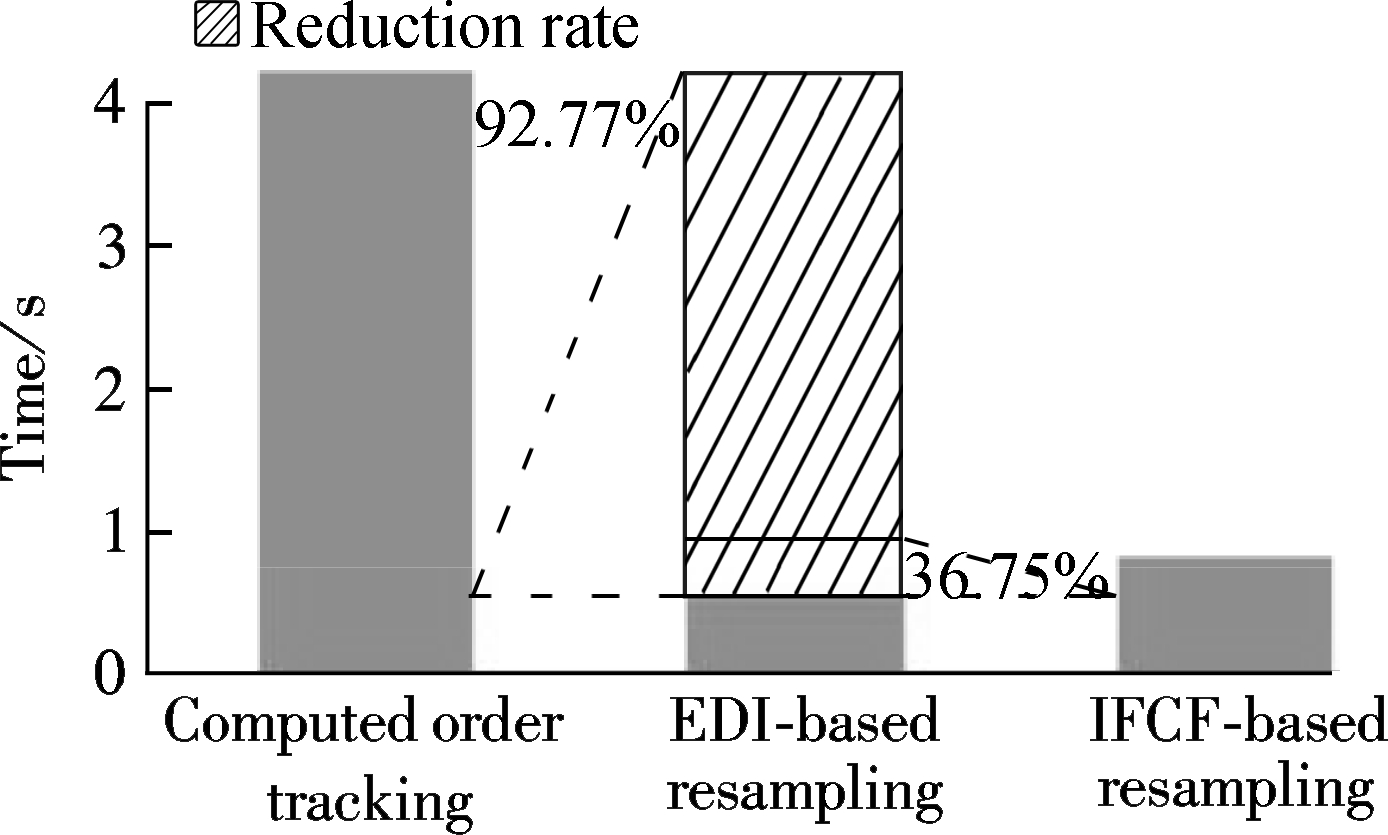
Fig.15 Comparison of computation time under deceleration
The above analysis results further verify that the proposed method has better performance in computational accuracy and efficiency, which can be effectively used to diagnose rolling element bearings operating under variable rotating speeds.
Tab.3 Order amplitude and computation time under deceleration
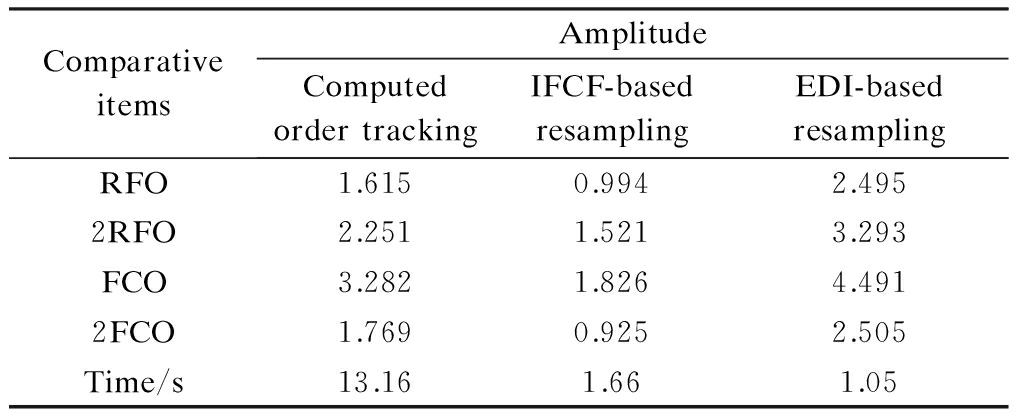
ComparativeitemsAmplitudeComputedordertrackingIFCF-basedresamplingEDI-basedresamplingRFO1.6150.9942.4952RFO2.2511.5213.293FCO3.2821.8264.4912FCO1.7690.9252.505Time/s13.161.661.05
Due to the shortcomings of the traditional order tracking methods, an improved resampling algorithm for rolling element bearing fault diagnosis under variable rotational speeds is developed. The main innovative features of the proposed algorithm are summarized as follows: 1) The proposed method is free of rotational frequency fitting, and it hence eliminates errors in the calculation of the frequency curve and errors caused by variable angular acceleration; 2) It is free of a large number of quadratic equations calculation, and hence it has higher computational efficiency. Experimental data of the faulty rolling element bearing is analyzed by the computed order tracking, the FCF-based resampling and the proposed algorithm for comparison. The contrasting results clearly demonstrate that the proposed method can produce higher accurate results in less computation time. As a result, it can be conveniently applied in engineering application due to its computational accuracy and efficiency.
[1]Zhang W, Jia M P, Zhu L. An adaptive Morlet wavelet filter method and its application in detecting early fault feature of ball bearings[J]. Journal of Southeast University: Natural Science Edition, 2016, 46(3):457-463. DOI:10.3969/j.issn.1001-0505.2016.03.001.(in Chinese)
[2]Ou L, Yu D J, Yang H J. A new rolling bearing fault diagnosis method based on GFT impulse component extraction[J]. Mechanical System and Signal Processing, 2016, 81:162-182.DOI:10.1016/j.ymssp.2016.03.009.
[3]Wen W G, Fan Z Y, Karg D, et al. Rolling element bearing fault diagnosis based on multiscale general fractal features [J]. Shock and Vibration, 2015, 2015:167902-1-167902-9. DOI:10.1155/2015/167902.
[4]Wang Y, Xu G, Zhang Q, et al. Rotating speed isolation and its application to rolling element bearing fault diagnosis under large speed variation conditions [J]. Journal of Sound and Vibration, 2015, 348:381-369. DOI:10.1016/j.jsv.2015.03.018.
[5]Ding X, He Q, Luo N. A fusion feature and its improvement based on locality preserving projections for rolling element bearing fault classification[J]. Journal of Sound and Vibration, 2015, 335:367-383. DOI:10.1016/j.jsv.2014.09.026.
[6]Saidi L, Ali J B, Fnaiech F. Bi-spectrum based-EMD applied to the non-stationary vibration signals for bearing faults diagnosis[J]. ISA Transactions, 2014, 53(5): 1650-1660. DOI:10.1016/j.isatra.2014.06.002.
[7]Zhao D Z, Li J Y, Cheng W D. Feature extraction of faulty rolling element bearing under variable rotational speed and gear interferences conditions[J]. Shock and Vibration, 2015, 2015:425989-1-425989-9. DOI:10.1155/2015/425989.
[8]Fyfe K R, Munck E D S. Analysis of computed order tracking[J]. Mechanical System and Signal Processing, 1997, 11(2):187-205. DOI:10.1006/mssp.1996.0056.
[9]Wang K S, Heyns P S. The combined use of order tracking techniques for enhanced Fourier analysis of order components[J]. Mechanical Systems and Signal Processing, 2011, 25(3): 803-811.DOI:10.1016/j.ymssp.2010.10.005.
[10]Bossley K M, Mckendrick R J, Harris C J, et al. Hybird computed order tracking [J]. Mechanical Systems and Signal Processing, 1999,13(4):627-641. DOI:10.1006/mssp.1999.1225.
[11]Gao Y, Guo Y, Chi Y L, et al. Order tracking based on robust peak search instantaneous frequency estimation [J]. Journal of Physics: Conference Series, 2006,48:479-484. DOI:10.1088/1742-6596/48/1/091.
[12]Coats M D, Randall R B. Order tracking with and without a tacho signal for gear fault diagnostics [C]//Proceedings of Acoustics. Fremantle, Australia, 2012:1-8.
[13]Tse P W, Peng Y H, Yan R. Wavelet analysis and envelope detection for rolling element bearing fault diagnosis—Their effectiveness and flexibilities [J]. Journal of Vibration and Acoustics,2001,123: 303-310.DOI: 10.1115/1.1379745.
[14]Brandt A, Lagö T, Ahlin K, et al. Main principles and limitations of current order tracking methods [J]. Sound and Vibration, 2005, 2005:19-22.
[15]Saavedra P N, Rodriguez C G. Accurate assessment of computed order tracking [J].Shock and Vibration, 2006,13(1):13-21.DOI:10.1155/2006/838097.
[16]Wang T, Ling M, Li J, et al. Rolling element bearing fault diagnosis via fault characteristic order (FCO) analysis [J]. Mechanical System and Signal Processing, 2014,45(1):139-153. DOI:10.1016/j.ymssp.2013.11.011.
[17]Randall R B, Antoni J. Rolling element bearing diagnostics—A tutorial [J].Mechanical Systems and Signal Processing,2011, 25(2):485-520. DOI:10.1016/j.ymssp.2010.07.017.
References:
摘要:为解决传统重采样算法在滚动轴承故障诊断中计算精度和计算效率方面的问题,提出了一种基于转速脉冲等分间隔的重采样算法.首先,确定每个转速脉冲上升沿的时间坐标及其对应的故障轴承信号幅值.其次,均分每个相邻脉冲间的时间间隔,获取均分时间坐标并利用上述均分时标对故障轴承信号进行插值以获取相应的故障轴承信号幅值.最后,将每个相邻脉冲间的时间点及幅值点按顺序排序,进一步将时间坐标转换成角域坐标从而得到故障轴承的重采样信号.对升速及降速下故障轴承信号的处理结果显示所提算法可以有效地应用于变转速条件下的滚动轴承故障诊断.此外,利用传统的计算阶比分析方法对上述实验信号进行分析,对比结果表明所提算法可在更短的时间内获得精度更高的结果.
关键词:滚动轴承;故障诊断;变转速;转速脉冲等分间隔重采样
中图分类号:TH113.1
Received:2016-10-16.
Foundation item:Fundamental Research Funds for the Central Universities (No.2016JBM051).
Citation::Zhao Dezun, Li Jianyong, Cheng Weidong, et al. An improved resampling algorithm for rolling element bearing fault diagnosis under variable rotational speeds[J].Journal of Southeast University (English Edition),2017,33(2):150-158.
DOI:10.3969/j.issn.1003-7985.2017.02.005.
DOI:10.3969/j.issn.1003-7985.2017.02.005
Biographies:Zhao Dezun(1990—), male,graduate; Cheng Weidong (corresponding author), male, doctor, professor, wdcheng@bjtu.edu.cn.