(a)
Abstract:The model of ion transportation through graphene nanochannels is established by the molecular dynamics simulation method. Statistics of the electric potential and charge distribution are made, respectively, on both sides of graphene nanopore with various diameters. Then, their changing relationship with respect to the nanopore diameter is determined. When applying a uniform electric field, polar water molecules are rearranged so that the corresponding relationship between the polarized degree of these molecules and the nanopore diameter can be created. Based on the theoretical model of ion transportation through nanochannels, the changing relationship between the concentration of anions/cations in nanochannels and bulk solution concentration is quantitatively analyzed. The results show that the increase of potential drop and charge accumulation, as well as a more obvious water polarization, will occur with the decrease of nanopore diameter. In addition,hydrogen ion concentration has a large proportion in nanochannels with a sodium chloride (NaCl) solution at a relative low concentration. As the NaCl concentration increases, the concentration appreciation of sodium ions tends to be far greater than the concentration drop of chloride ions. Therefore, sodium ion concentration makes more contribution to ionic conductance.
Key words:molecular dynamics simulation; ion transportation; graphene nanochannels; ionic conductance
In biological systems, ion channels commonly exist and are essential to ensure ion selectivity in an extraordinarily fast flow[1]. For instance, the transportation of K+ is favored in potassium channels instead of Na+ despite their similar size, achieving the selective permeability called gating[2]. Additionally, the nuclear membrane pores control the passage of messenger RNA from the cell nucleus into the cytosol[3]. Thus, it can be seen that biological channels have significant functions in the biomass. With the development of nanotechnology, combining life sciences with physical science and nanoscience has made the nanoscale regime increasingly attractive. By mimicking the functions of biological channels, a nanopore is constructed in an impermeable membrane which separates two chambers filled with electrolyte solution[4]. For example, the utility of the α-hemolys or MspA nanopore can be used as biological sensors[5]; chemical and biochemical reactions can also be monitored at a single-molecule level[6]. The bio-inspired batteries can be formatted to transfer or store energy[7]; and protein nanopores offer an inexpensive, label-free method of analyzing single oligonucleotides[8], etc.
However, despite the heterogeneity and remarkable characteristics of biological channels, there are some disadvantages. For instance, the sensitivity of the channels is vulnerable to some experimental parameters, such as pH, temperature and salt concentration[9]; the integration of biological systems into large-scale arrays is difficult[10]; and the mechanical stability of biological channels is not guaranteed. Therefore, solid-state nanopores have become substitutes for biological channels in their experiments owing to their advantages like robustness and mechanical stability, easily manufactured and integrated, and so on[11]. Undoubtedly, solid-state nanochannels have a wide range of applications, such as biological molecules information sequencing, water desalination, treatment of exhausted gases, energy storage, ionic current rectification[12], etc. Among these applications, nanofludic is defined as the study and application of fluid flow in and around nanometer-sized objects with the characteristic length less than 100 nm[13].
The discovery of graphene, a single layer of carbon atoms arranged in a 2D hexagonal lattice, provides new opportunities and attracts wide attention[14]. Graphene has a series of unique properties, such as being atomically thin[15], highly flexible[16], stretchable, and transparent[17]. It is also impenetrable to ions, and is an excellent thermal and electrical conductor[18]. Additionally, it has been applied in nanodevices for nanofluidics, ion transportation and biological molecule detection, etc[19]. Therefore, graphene nanochannel is chosen in this paper to study ion transportation.
With the development of various experimental methods, the ion transportation through nanochannels can be studied gradually. Specially, hydrophobic graphene nanochannels with smooth surface offer a unique system to study molecular transport and nanofluicis[20]. Although experimental observations are intuitive and effective, the specific parameters of ion transport cannot be accurately quantified in the nanochannels[21]. Molecular dynamics (MD) simulation, which offers an effective tool to study the ion transportation through nanochannels[22], is a computational method that allows the microscopic dynamics of a molecular system to be investigated. In this work, we conducted MD simulation on nanopores with different diameters to explore the potential and charge distribution, and the water flow under an applied electric field. Furthermore, we simulated ion transportation through nanochannels with different diameter-to-length ratios.
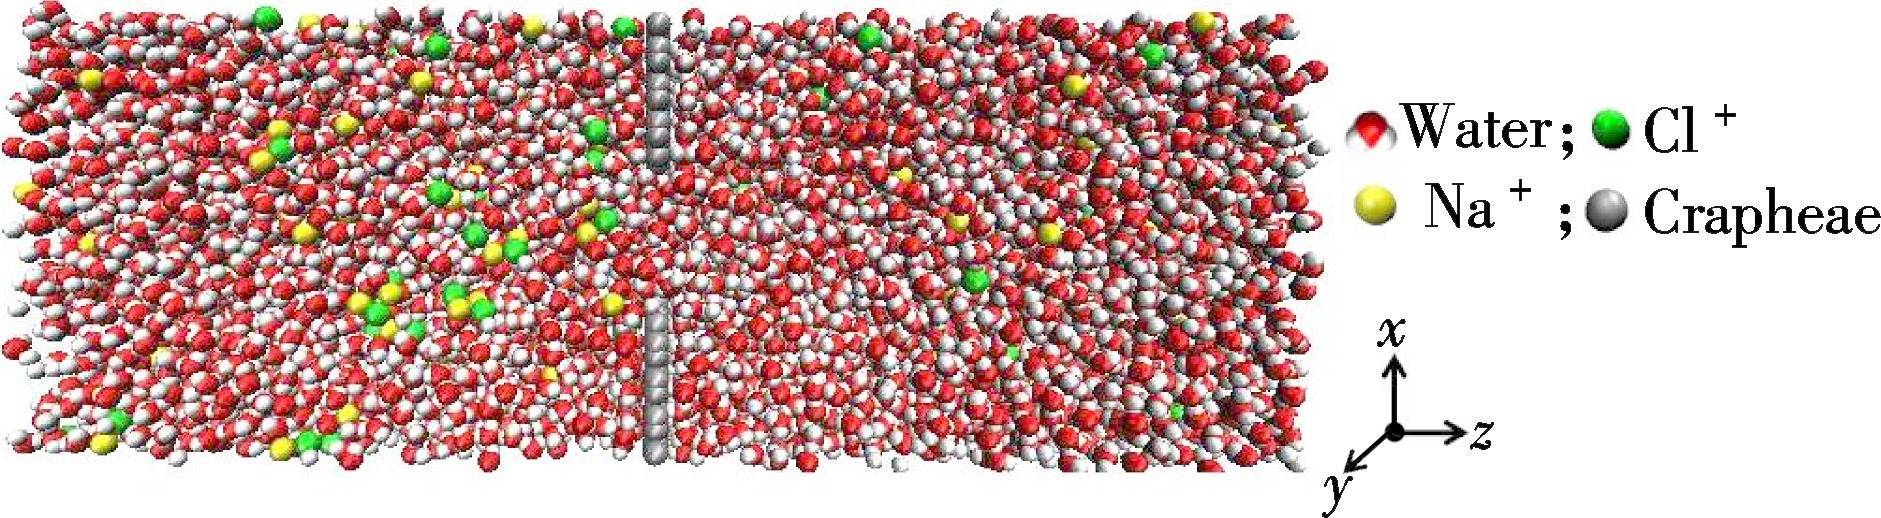
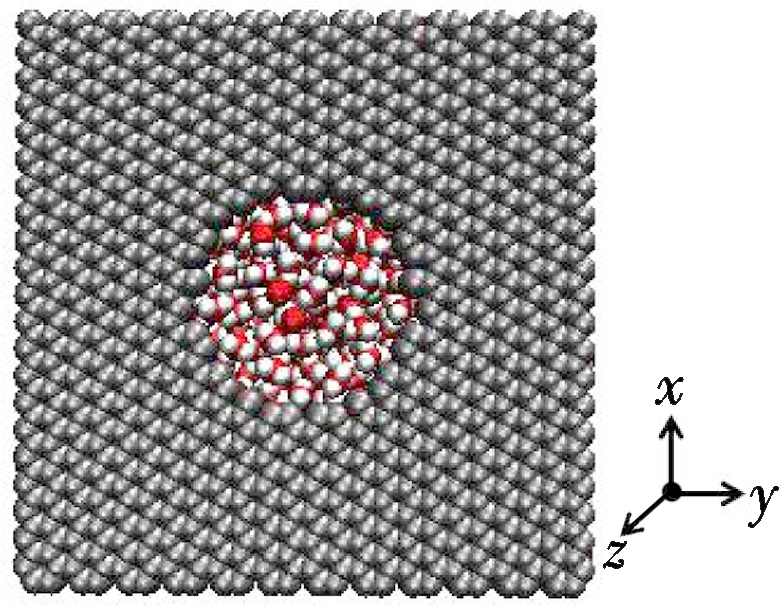
MD simulations were performed by utilizing GROMACS 4.65. The schematic diagram of the model used in the simulation is exhibited in Fig.1, which is assumed to be infinite in all directions using periodic boundary conditions. The force field used was OPLS-AA. Graphene nanotubes, with diameters in the nanometer range and atomically smooth surfaces, can enhance fluid flow due to hydrophobic interaction[20]. We then took graphene nanopores to conduct MD simulations with the diameter of nanopores of 2, 3 and 4 nm. Therein, the model dimension was 6.7 nm×6.7 nm×15 nm with a solid wall in the middle of z-direction. The wall was consisted of one layer of 6.5 nm×6.5 nm graphene atoms with a nanopore in the center. In addition, both sides of the graphene layer were filled with 1 mol/L sodium chloride solution. The wall atoms were fixed to their original posit-ions during the simulation. The water molecule was proved to be rigid by using the SPC/E model. Hydrogen and oxygen atoms were modeled as point charges[23]. To keep the electrical neutrality of the model, the number of Na+ and Cl- were both 405.
(a)
(b)
Fig.1 Photograph of a MD simulation of ion transportation through a graphene nanopore. (a) Overhead view of the simulation box; (b) Side view of the simulation box
Moreover, the electrostatic interactions between water molecules and ions were modeled using the Ewald summation algorithm, which was used to process the summation of Lennard-Jones potential and electrostatic potential. The cut-off radius was 1.0 nm. Newton’s equation of motion was integrated using the velocity Verlet algorithm with a time step of 2 fs. A Berendsen thermostat was used to maintain the temperature at 300 K. Meanwhile, the flow was modeled under the applied electric field of 0.07 V/nm in the positive z-direction. In total, the entire simulation took 10 ns after energy minimization and temperature coupling.
2.1 Potential distribution across the nanopore
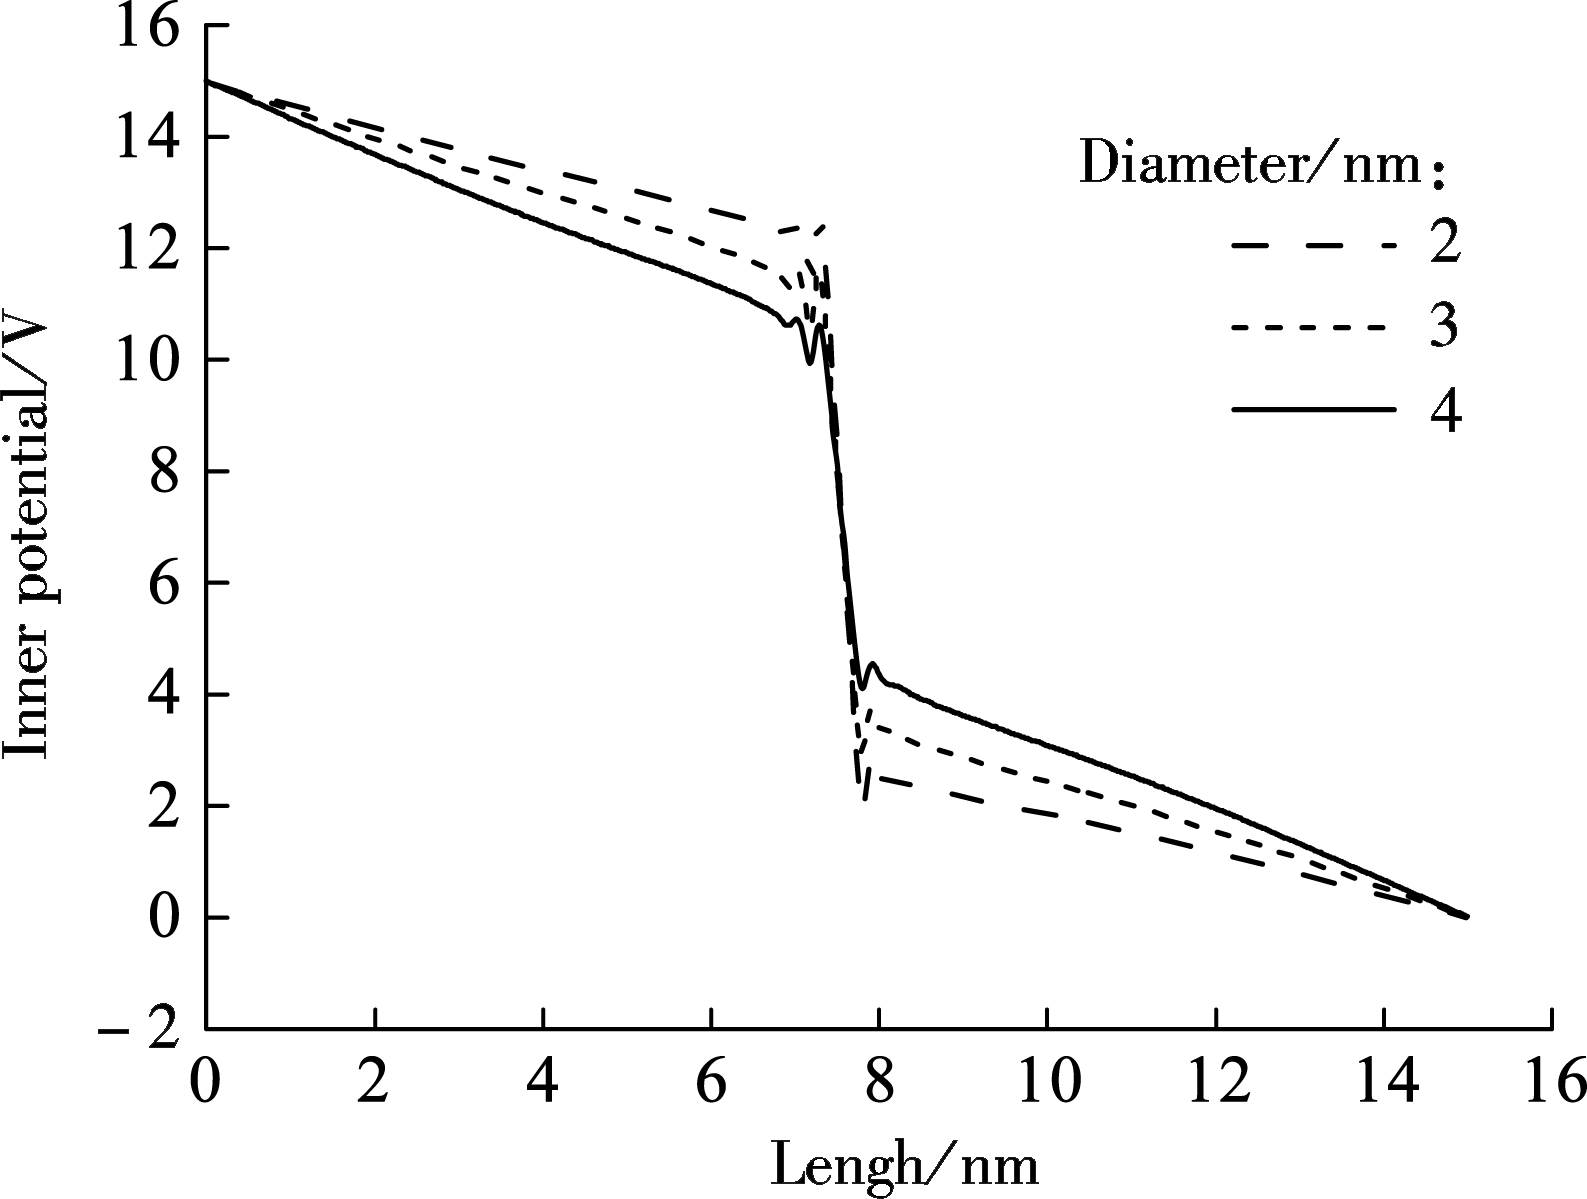
As the electric field is applied to the electrolyte, ions will be electrophoretically driven through graphene nanopores[24], forming the ionic current. In this simulation, we set the diameter of the nanopores to be 2, 3 and 4 nm. In order to show the electrical potential distribution as a function of position along the pore axis, we have not taken the periodic boundaries into account and the reference of potential is taken to be the left boundary of the box.
The potential distribution is calculated by dividing the box into a thousand slices along the z-direction first and then the charges per slice are summed up[25]. As shown in Fig.2(a), the inner potential drop mainly occurs near the region of the nanopore due to its high resistance and it increases with the decrease in nanopore diameters. As a result, an increase in the driven force on ions is observed. Particularly, the ion transportation velocity in smaller nanopores is faster, which is in accord with the previous experimental results[26]. Meanwhile, when the electric fields applied to the system is considered, the total potential distribution along z axis is shown in Fig.2(b). One of the main challenges of DNA sequencing is to control the DNA velocity, and therefore the potential distribution across different nanopores can be instructive to achieving DNA sequencing accurately and timely[26].
2.2 Charge distribution across the nanopore
The charge distribution is also studied here. There are anions and cations in the electrolyte solution and the applied electric field drives them to move in opposite directions. Clearly, the ion transportation through nanopores with the diameter of 2, 3 and 4 nm can be seen in Fig.3. The sodium cations move in the same direction as the applied electric field. However, the nanopore is too narrow to allow many ions to transport through it simultaneously. Consequently, some cations accumulate at one side of the graphene layer. Meanwhile, the accumulated cations can attract surrounding chloride ions due to the electrostatic force. As a result, the charge density fluctuates until it nearly becomes neutral when the position selected is far away from the graphene due to the systematic electric neutrality. Similarly, on the other side of the graphene, chloride anions accumulate and attract sodium cations. As a result, when decreasing the diameter of the nanopores, more sodium cations accumulate on the one side of the wall (see Fig.1) as well as more chloride anions aggregate on the other side due to the size restriction to ion transportation[27].

(a)
(b)
Fig.2 MD results of inner potential distribution. (a) Total potential distribution; (b) Along z-direction
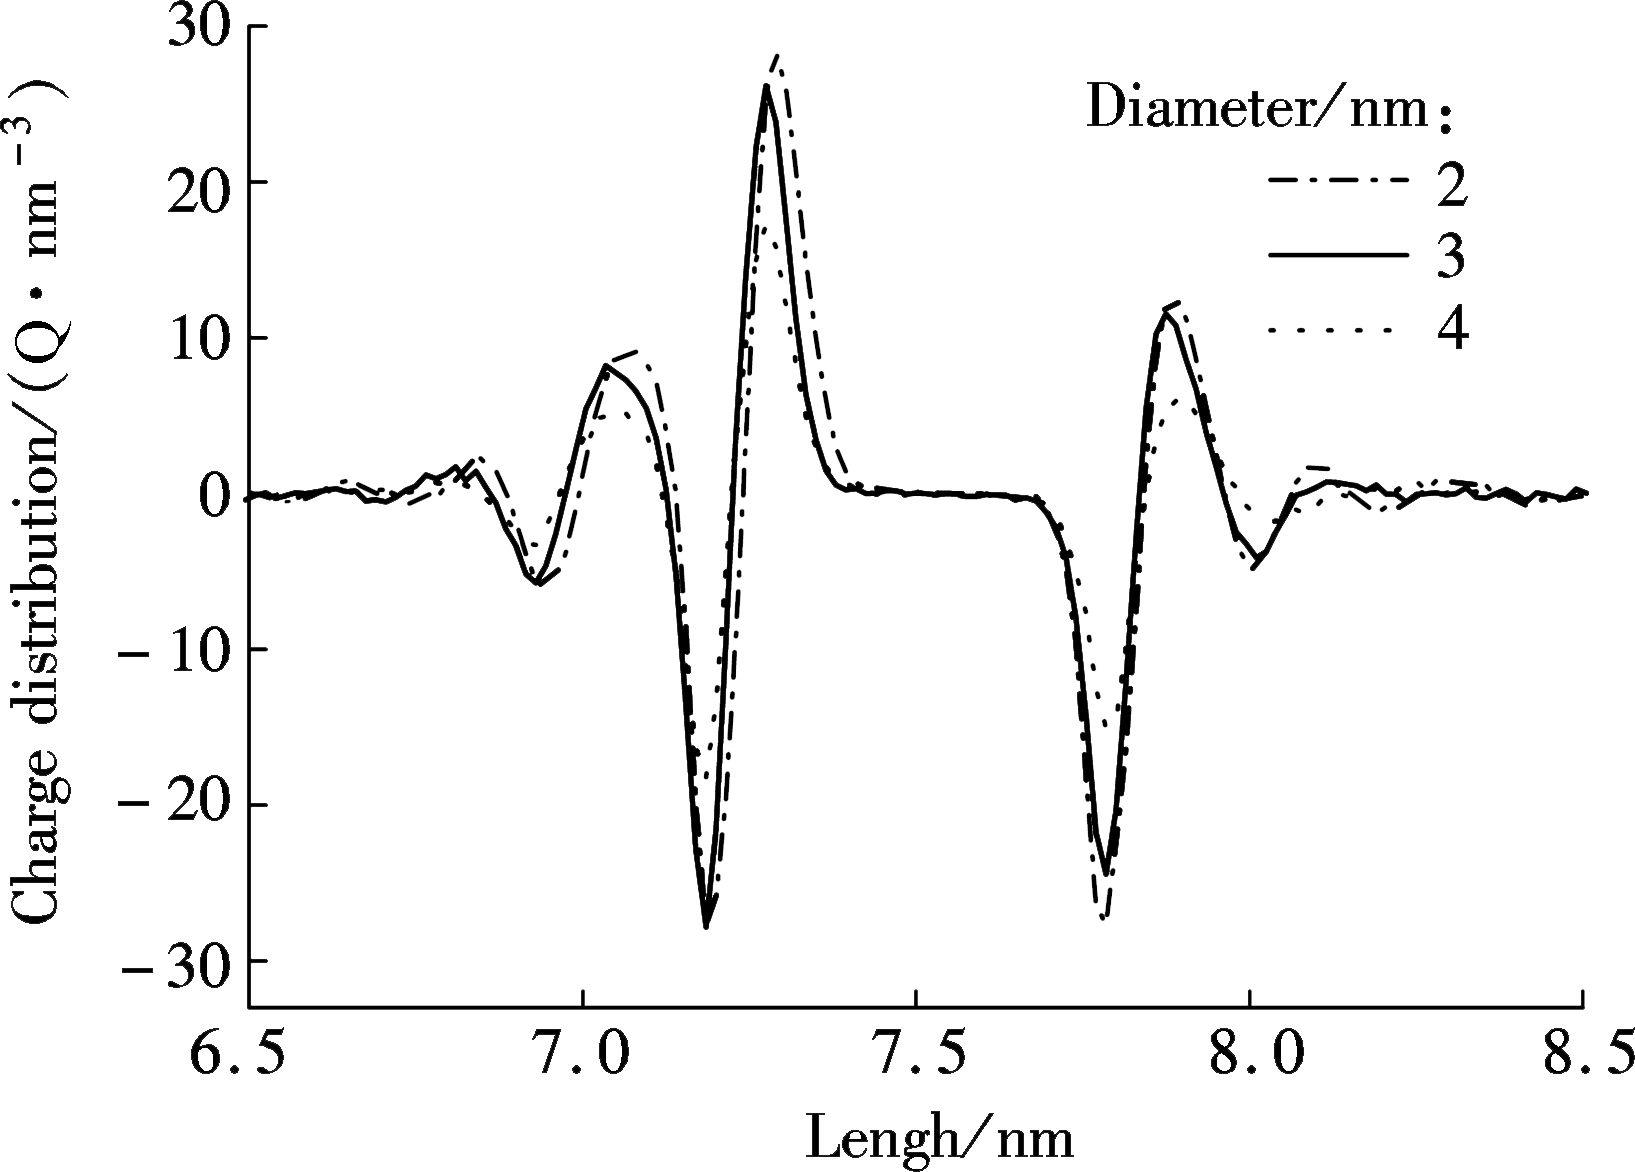
Fig.3 Charge distribution along z-direction for ions transportation through nanopores with various diameters
2.3 Water polarization
In order to analyze the ion transportation, nanochannels comprised of five graphene layers are built to assess the water polarization, as shown in Fig.4. Therein, the box length along z-direction is 10 nm. It is widely known that a molecule of water has two hydrogen atoms covalently bonded to a single oxygen atom. Whereas the water molecule is not linear and the oxygen atom has a higher electronegativity than hydrogen atoms so that it carries negative charges, the hydrogen atoms are slightly positive[28]. As a result, water is a polar molecule with an electric dipole moment. A huge difference exists between the bulkwater flow and the flow in nanochannels. Therefore, the water flow will become directional under the 0.01 V/nm electric field when moving through graphene nanochannels with the varying diameters of 2, 3 and 4 nm. Obviously, the MD simulation shows that water molecules are polarized as the oxygen atoms are arranged in the opposite direction of the electric field while hydrogen atoms face the same direction as the electric field. Finally, a potential drop appears shown in Fig.4. This drop is so-called water polarization, and it influences ion transportation through nanochannels[29-30].
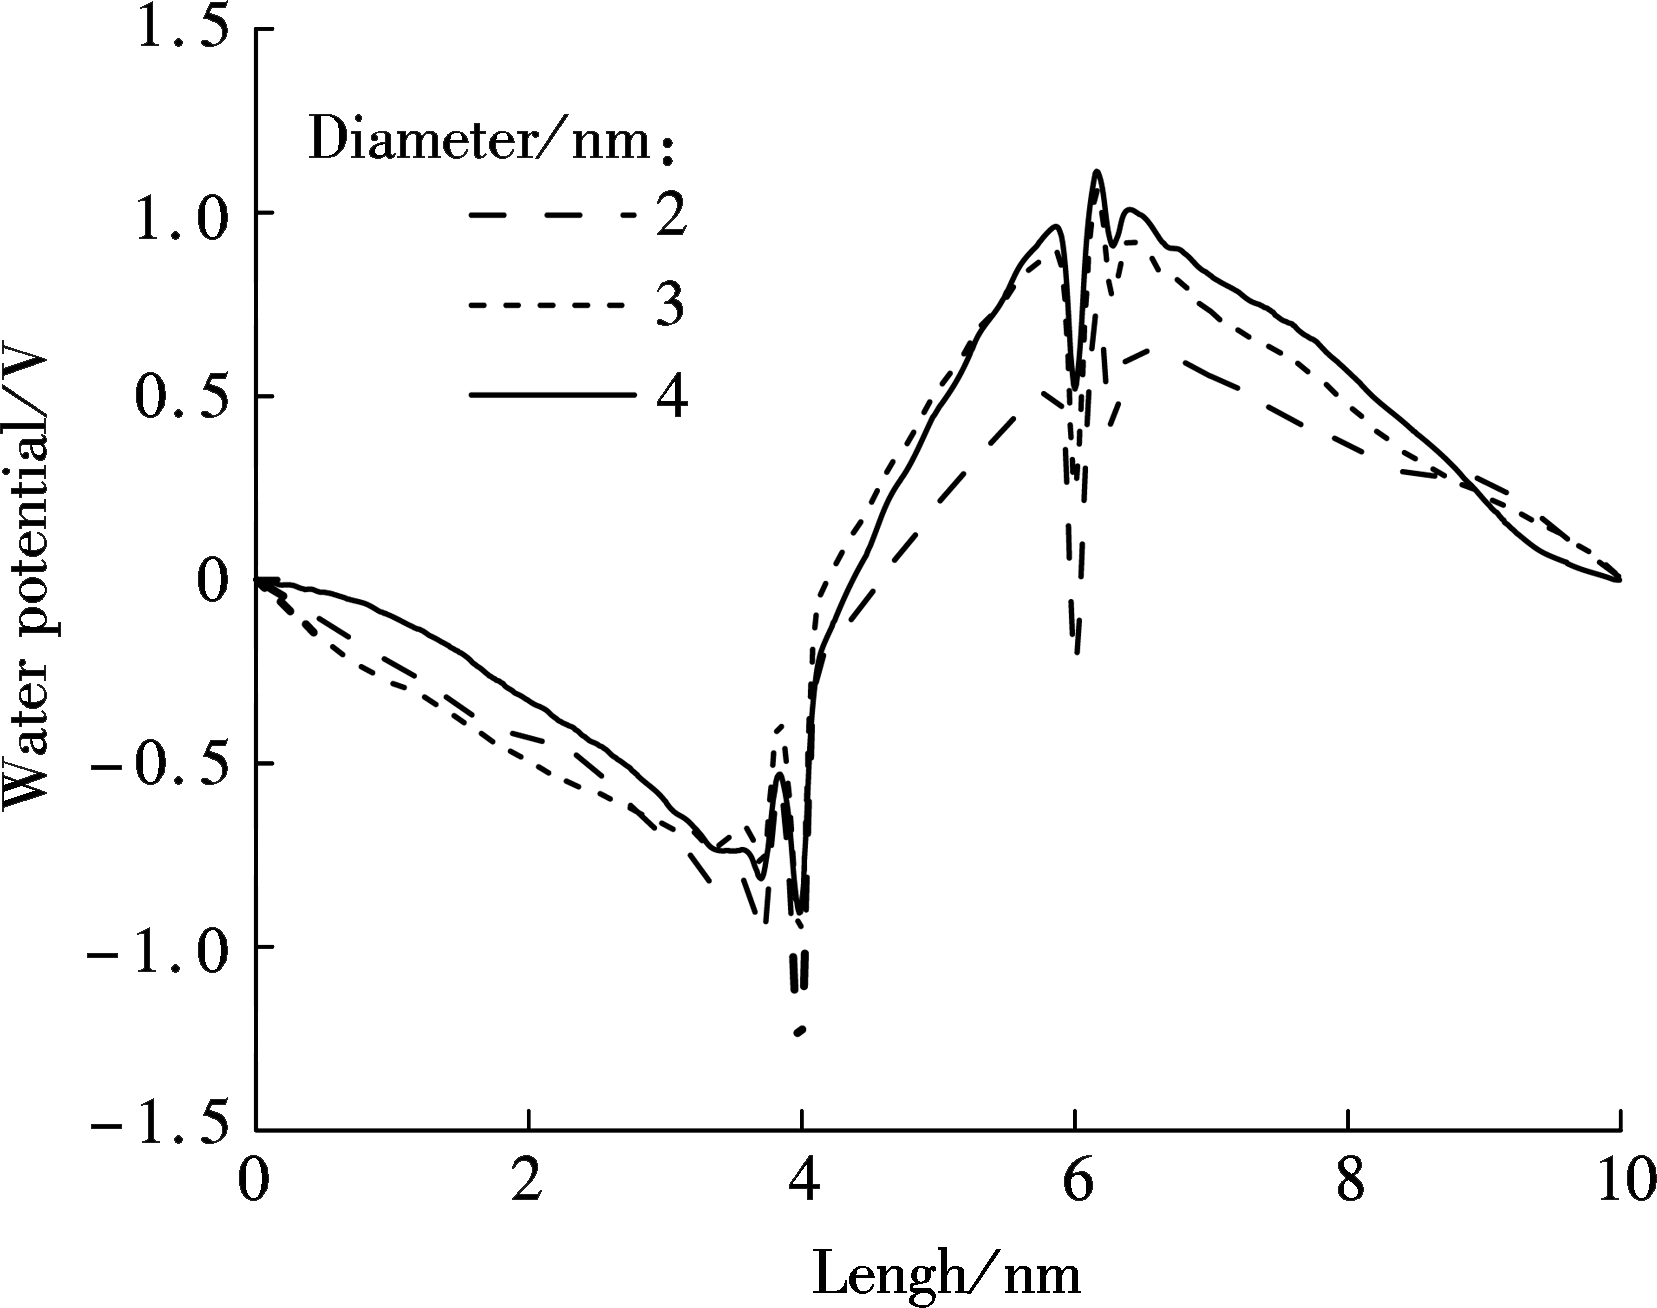
Fig.4 Relationship between water potential and box length for ions transportation through nanopores with various diameters
2.4 Ion transport through nanochannels
Considering the experiments conducted for the anomalous ion transportation through nanochannels[31], some theoretical calculations have been made for verification. During the calculations, the radius-to-length ratio of nanochannels has been changed under different concentrations of sodium chloride. The value of the surface charge density σ can be determined as
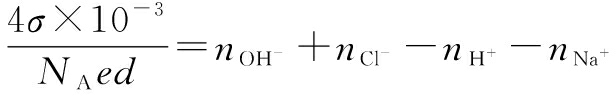
(1)
where nOH-,nCl-,nH+,nNa+ represent the ion concentration of OH-, Cl-, H+and Na+ inside the nanochannel, respectively; d is the diameter;NA is the Avogadro constant; and e is the elementary charge.
Moreover, the definition of σ can be expressed as
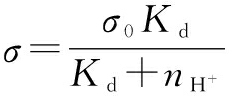
(2)
where σ0 is the largest value of the surface charge density, equal to -1.28 C/m2; Kd is the equilibrium constant and its value is 10-6 mol/L. Additionally, the distribution of both the cation concentrations and the anion concentrations inside the nanochannel complies with the Boltzmann distribution[32]

(3)
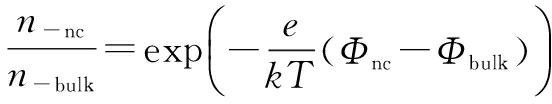
(4)
where n+nc and n-nc(n+bulk and n-bulk) stand for the cation and anion concentrations inside the nanochannel (bulk solution); Φncand Φbulkrefer to the electric potential in the nanochannel and bulk, respectively[33].
Besides, there is an assumption that the ratio between the concentrations of hydrogen and sodium is constant either inside the nanochannel or in the bulk.
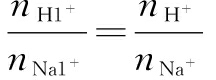
(5)
where ![]() and
and ![]() (nH+and nNa+) stand for hydrogen and sodium concentrations inside the nanochannel (bulk solution).
(nH+and nNa+) stand for hydrogen and sodium concentrations inside the nanochannel (bulk solution).
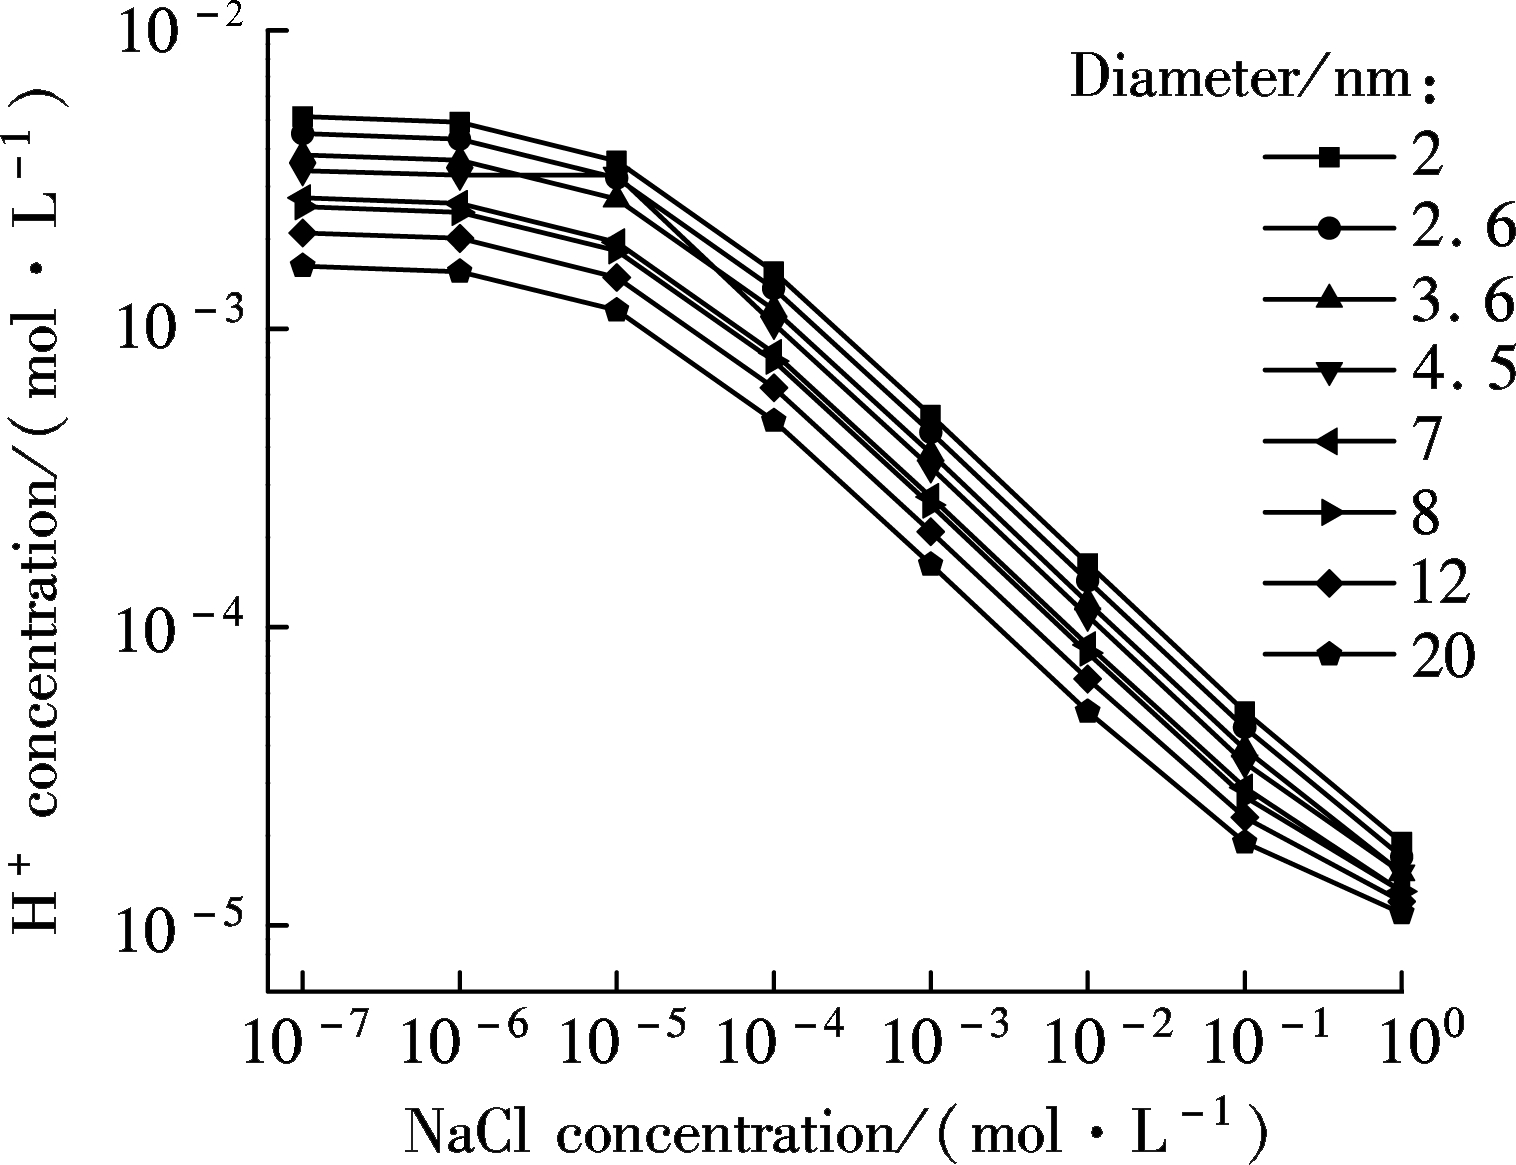
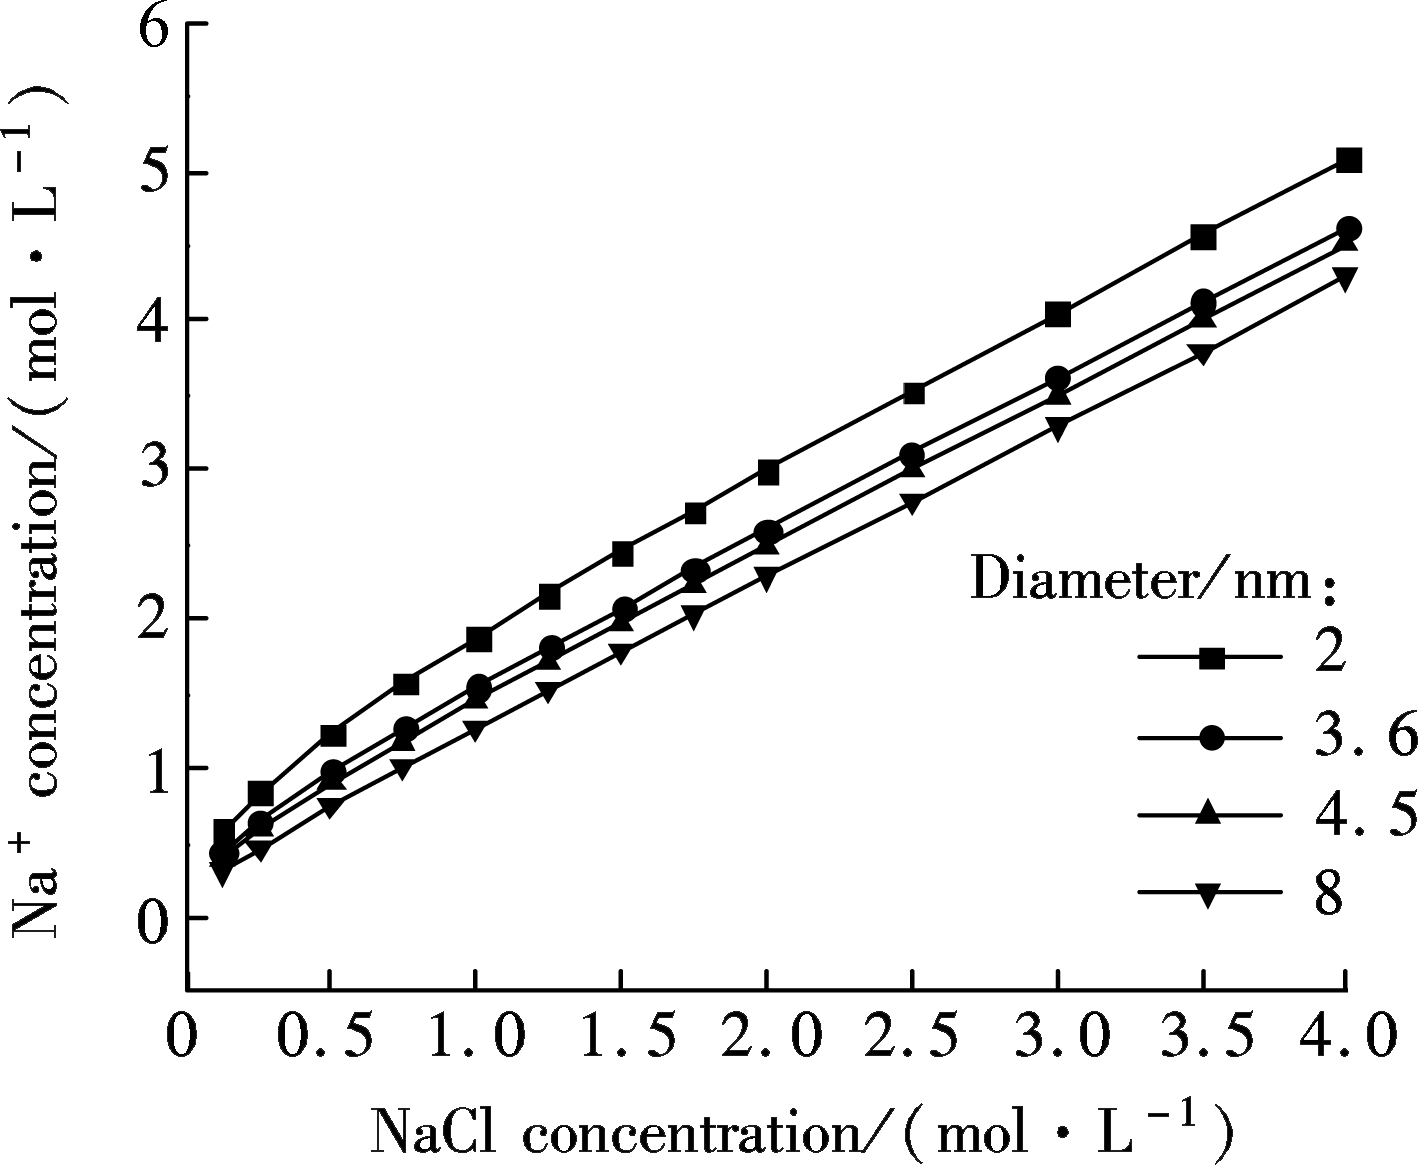
On the basis of calculations above, some counterintuitive results are shown in Figs.5(a) and (b), which are in accord with previous analysis reported[31]. In Fig.5(a), with the increase of the concentration of sodium chloride, the hydrogen concentration inside the nanochannel decreases with its diameter changing from 2 to 20 nm. When the NaCl solution is lower than 10-5mol/L, the concentration of protons inside nanochannel is greater than that of Na+[32]. With the increase of NaCl concentration[34], the concentration of Na+ inside the nanochannel increases linearly with its diameter changing from 2 to 8 nm when the bulk concentration is above 10-5 mol/L, reflecting that the initial H+ inside nanochannel is replaced by Na+ in the bulk, which can be seen clearly in Fig.5(b). Particularly, it also shows that at a high ionic concentration, the conductance is determined by the nanochannel geometry and bulk ionic concentration. In other words, Na+ has completely replaced H+ inside the nanochannel at this occurrence and thus becomes dominant, which makes a greater contribution to ionic conductance[35].
(a)
(b)
Fig.5 Relationship between the calculated hydrogen concentration and NaCl bulk concentration in nanochannels with variours diameters. (a) Hydrogen concentration; (b) Sodium concentration
The ion transportation through graphene nanochannels is studied by using MD simulation. When ions transport under the applied electric field, the smaller the diameter of the nanopore, the higher the value of the potential drop. As a consequence, the velocity of ion transportation becomes faster. Meanwhile, charge distribution can be influenced by the size resistance. In other words, cations accumulate at one side of the nanopore while anions aggregate on the other side. Additionally, water polarization is still shown due to the fact that water is polar molecule. The results further reveal that the calculations of ion transportation through nanochannels with various diameters show some counterintuitive phenomenons. For instance, protons are dominant ions at the very first beginning in nanochannels at low bulk concentrations. However, when the bulk concentration increases, protons are gradually replaced by other cations. This phenomenon tends to be more clear as the diameter of the nanochannel shrinks. These results shown above shed light on the influence of potential and charge distribution as well as water polarization on ion transportation in nanochannels. Moreover, these findings can also have implications in nanotechnology, including a guidance of the construction of nanofluidic systems and even more complicated devices, which may have a great significance in various scientific and engineering applications.
[1]Thomas M, Corry B, Hilder T A. What have we learnt about the mechanisms of rapid water transport, ion rejection and selectivity in nanopores from molecular simulation?[J]. Small, 2014, 10(8): 1453-1465. DOI:10.1002/smll.201302968.
[2]Fornasiero F, Park H G, Holt J K, et al. Ion exclusion by sub-2-nm carbon nanotube pores [J]. Proceedings of the National Academy of Sciences, 2008, 105(45): 17250-17255. DOI:10.1073/pnas.0710437105.
[3]Stevens B J, Swift H. RNA transport from nucleus to cytoplasm in Chironomus salivary glands [J]. The Journal of Cell Biology, 1966, 31(1): 55-77. DOI:10.1083/jcb.31.1.55.
[4]Ying Y L, Zhang J, Gao R, et al. Nanopore-based sequencing and detection of nucleic acids [J]. Angewandte Chemie International Edition, 2013, 52(50): 13154-13161. DOI:10.1002/anie.201303529.
[5]Aksimentiev A. Deciphering ionic current signatures of DNA transport through a nanopore [J]. Nanoscale, 2010, 2(4): 468-483. DOI:10.1039/b9nr00275h.
[6]Bustamante C, Smith S B, Liphardt J, et al. Single-molecule studies of DNA mechanics [J]. Current Opinion in Structural Biology, 2000, 10(3): 279-285. DOI:10.1016/s0959-440x(00)00085-3.
[7]Cao R, Thapa R, Kim H, et al. Promotion of oxygen reduction by a bio-inspired tethered iron phthalocyanine carbon nanotube-based catalyst [J]. Nature Communications, 2013, 4: 2076. DOI:10.1038/ncomms3076.
[8]Zhu F, Schulten K. Water and proton conduction through carbon nanotubes as models for biological channels [J]. BiophysicalJournal, 2003, 85(1): 236-244. DOI:10.1016/S0006-3495(03)74469-5.
[9]Cao C, Ying Y L, Hu Z L, et al. Discrimination of oligonucleotides of different lengths with a wild-type aerolysin nanopore [J]. Nature Nanotechnology, 2016, 11(8): 713-718. DOI:10.1038/nnano.2016.66.
[10]de la Escosura-Mu iz A, Merkoçi A. Nanochannels preparation and application in biosensing [J]. ACS Nano, 2012, 6(9): 7556-7583. DOI:10.1021/nn301368z.
[11]Fologea D, Gershow M, Ledden B, et al. Detecting single stranded DNA with a solid state nanopore [J]. Nano Letters, 2005, 5(10): 1905-1909. DOI:10.1021/nl051199m.
[12]Gamble T, Decker K, Plett T S, et al. Rectification of ion current in nanopores depends on the type of monovalent cations: experiments and modeling [J]. The Journal of Physical Chemistry C, 2014, 118(18): 9809-9819. DOI:10.1021/jp501492g.
[13]Schoch R B, Han J, Renaud P. Transport phenomena in nanofluidics [J]. Reviews of Modern Physics, 2008, 80(3): 839-883. DOI:10.1103/revmodphys.80.839.
[14]Novoselov K S, Geim A K, Morozov S V, et al. Electric field effect in atomically thin carbon films[J]. Science, 2004, 306(5696): 666-669. DOI:10.1126/science.1102896.
[15]Lee C, Wei X, Kysar J W, et al. Measurement of the elastic properties and intrinsic strength of monolayer graphene [J]. Science, 2008, 321: 385-388. DOI:10.1126/science.1157996.
[16]Schedin F, Geim A K, Morozov S V, et al. Detection of individual gas molecules adsorbed on graphene [J]. Nature Materials, 2007, 6(9): 652-655. DOI:10.1038/nmat1967.
[17]Nair R R, Blake P, Grigorenko A N, et al. Fine structure constant defines visual transparency of graphene[J].Science, 2008, 320(5881): 1308. DOI:10.1126/science.1156965.
[18]Balandin A A, Ghosh S, Bao W, et al. Superior thermal conductivity of single-layer graphene [J]. Nano Letters, 2008, 8(3): 902-907. DOI:10.1021/nl0731872.
[19]Ferrari A C, Bonaccorso F, Fal’ko V, et al. Science and technology roadmap for graphene, related two-dimensional crystals, and hybrid systems [J]. Nanoscale, 2015, 7(11): 4598-4810. DOI:10.1039/c4nr01600a.
[20]Holt J K, Park H G, Wang Y, et al. Fast mass transport through sub-2-nanometer carbon nanotubes [J]. Science, 2006, 312(5776): 1034-1037. DOI:10.1126/science.1126298.
[21]Plecis A, Schoch R B, Renaud P. Ionic transport phenomena in nanofluidics: Experimental and theoretical study of the exclusion-enrichment effect on a chip [J]. Nano Letters, 2005, 5(6):1147-1155. DOI:10.1021/nl050265h.
[22]Aksimentiev A, Schulten K. Imaging α-hemolysin with molecular dynamics: Ionic conductance, osmotic permeability, and the electrostatic potential map [J]. Biophysical Journal, 2005, 88(6): 3745-3761. DOI:10.1529/biophysj.104.058727.
[23]Mark P, Nilsson L. Structure and dynamics of the TIP3P, SPC, and SPC/E water models at 298K [J]. The Journal of Physical Chemistry A, 2001, 105(43): 9954-9960. DOI:10.1021/jp003020w.
[24]Smeets R M M, Keyser U F, Krapf D, et al. Salt dependence of ion transport and DNA translocation through solid-state nanopores [J]. Nano Letters, 2006, 6(1): 89-95. DOI:10.1021/nl052107w.
[25]Si W, Sha J J, Liu L, et al. Effect of nanopore size on poly (dt) 30 translocation through silicon nitride membrane [J]. Science China Technological Sciences, 2013, 56(10): 2398-2402. DOI:10.1007/s11431-013-5330-2.
[26]Ashkenasy N, S nchez-Quesada J, Bayley H, et al. Recognizing a single base in an individual DNA strand: A step toward DNA sequencing in nanopores [J]. Angewandte Chemie, 2005, 117(9): 1425-1428. DOI: 10.1002/ange.200462114.
[27]Parsegian A. Energy of an ion crossing a low dielectric membrane: Solutions to four relevant electrostatic problems [J]. Nature, 1969, 221(5183): 844-846. DOI:10.1038/221844a0.
[28]Israelachvili J, Wennerström H. Role of hydration and water structure in biological and colloidal interactions[J]. Nature, 1996, 379(6562): 219-225. DOI:10.1038/379219a0.
[29]Sabbah S, Lerner A, Erlick C, et al. Under water polarization vision—A physical examination [J]. Recent Research Developments in Experimental and Theoretical Biology, 2005, 1: 123-176.
[30]Pal S K, Zhao L, Zewail A H. Water at DNA surfaces: Ultrafast dynamics in minor groove recognition [J]. Proceedings of the National Academy of Sciences, 2003, 100(14): 8113-8118. DOI:10.1073/pnas.1433066100.
[31]Duan C, Majumdar A. Anomalous ion transport in 2-nm hydrophilic nanochannels[J]. Nature Nanotechnology, 2010, 5(12): 848-852. DOI:10.1038/nnano.2010.233.
[32]Hunter R J. Zeta potential in colloid science: Principles and applications[M]. San Diego, CA,USA:Academic Press, 2013.
[33]Baldessari F. Santiago J G. Electrokinetics in nanochannels: Part Ⅰ. Electric double layer overlap and channel-to-well equilibrium[J]. Journal of Colloid and Interface Science, 2008, 325(2): 526-538. DOI:10.1016/j.jcis.2008.06.007.
[34]Stein D, Kruithof M, Dekker C. Surface-charge-governed ion transport in nanofluidic channels[J]. Physical Review Letters, 2004, 93(3): 035901. DOI:10.1103/PhysRevLett.93.035901.
[35]Karnik R, Fan R, Yue M, et al. Electrostatic control of ions and molecules in nanofluidic transistors[J]. Nano Letters, 2005, 5(5): 943-948. DOI:10.1021/nl050493b.
References:
陈 辰1,2 陈云飞1,2 沙菁 1,2 伍根生3 马 建1,2 李 堃1,2 纪安平1,2
摘要:采用分子动力学模拟方法建立了石墨烯纳通道中离子输运的模型,统计了不同直径石墨烯纳米孔两侧的电势和电荷分布,确立了电势和电荷分布随纳米孔直径的变化关系.通过施加匀强电场使极性水分子在石墨烯纳通道中重新排列,总结出水分子的极化程度与纳通道直径的对应关系.利用建立的纳通道中离子输运的理论模型,定量分析了不同直径纳通道中的阴、阳离子浓度与体态溶液浓度的变化关系.结果表明,纳米孔径的减小会导致孔两侧电势降的增大、聚集电荷的增多,并且水的极化程度也更加明显.此外,在较低浓度的NaCl溶液下,纳通道中氢离子浓度占的比重大.随着NaCl溶液浓度的增加,通道中钠离子的浓度上升值远大于氢离子的浓度减小值,因此,钠离子浓度对于离子电导的贡献更大.
关键词:分子动力学模拟;离子输运;石墨烯纳通道;离子电导
中图分类号:TB383
Received:2016-10-24.
Foundation item:s:The National Basic Research Program of China(973 Program) (No.2011CB707600), the National Natural Science Foundation of China (No.51435003, 51375092), the Natural Science Foundation of Jiangsu Province (No.BK20160935), the Natural Science Foundation of Higher Education Institutions of Jiangsu Province (No.16KJB460015).
Citation::Chen Chen, Chen Yunfei, Sha Jingjie, et al.Molecular dynamics simulation of ion transportation through graphene nanochannels[J].Journal of Southeast University (English Edition),2017,33(2):171-176.
DOI:10.3969/j.issn.1003-7985.2017.02.008.
DOI:10.3969/j.issn.1003-7985.2017.02.008
Biographies:Chen Chen (1991—),male,graduate; Chen Yunfei (corresponding author), male, doctor, professor, yunfeichen@seu.edu.cn.