
Abstract:To integrate different renewable energy resources effectively in a microgrid, a configuration optimization model of a multi-energy distributed generation (DG) system and its auxiliary equipment is proposed. The model mainly consists of two parts, the determination of initial configuration schemes according to user preference and the selection of the optimal scheme. The comprehensive evaluation index (CEI), which is acquired through the analytic hierarchy process (AHP) weight calculation method, is adopted as the evaluation criterion to rank the initial schemes. The optimal scheme is obtained according to the ranking results. The proposed model takes the diversity of different equipment parameters and investment cost into consideration and can give relatively suitable and economical suggestions for system configuration. Additionally, unlike Homer Pro, the proposed model considers the complementation of different renewable energy resources, and thus the rationality of the multi-energy DG system is improved compared with the single evaluation criterion method which only considers the total cost.
Key words:multi-energy complementation; distributed generation (DG); optimal configuration; energy management; comprehensive evaluation index (CEI); analytic hierarchy process (AHP)
With the continuous development of micro-grid technology, research on multi-energy generation systems have some foundation. As to the capacity allocation, scholars at home and abroad have carried out research. In order to improve the reliability and economy of the generation system, the capacity of the stand-alone renewable energy generation system was configured according to regional environmental conditions[1]. The loss power supply probability (LPSP) was used to calculate the energy storage capacity and the quantity of photovoltaic panels based on meteorological data[2]. In Refs.[3-5], the genetic algorithm (GA) was adopted to optimize the capacity of the hybrid power system and it performed better than the dynamic programming (DP) algorithm in the simulation. In Ref.[6], the evolutionary programming method was used to optimize the allocation of the wind/solar hybrid system. Overall, there is little research taking complementation among different natural resources into consideration.
Regarding the evaluation of multi-energy power generation, various criteria have been proposed. Quantitative analysis of different indicators was conducted[7]. The programming model for the distributed generation system was optimized according to the cost-benefit analysis[8]. The position and capacity of the distributed generation system were optimized to minimize the costs of investment and operation[9-11]. Overall, the evaluation indices of the multi-energy generation system are relatively unitary[7-11], which do not comprehensively cater to the preference of planners.
Additionally, a number of laboratories abroad have developed some software, such as HOMER and Hybrid2. However, HOMER carries out the simulation mainly based on specific equipment types and the quantity set by users[12]. Hence, the complementation among renewable energy generations lacks of consideration.
In this paper, a configuration optimization model of the multi-energy distributed generation system and its auxiliary equipment is proposed. The model mainly consists of two parts, the determination of initial configuration schemes and the selection of the optimal scheme.
1.1 Optimization of allocation ratios
Due to the fluctuation and uncertainty of renewable energy output power, it is necessary for a stand-alone microgrid to allocate auxiliary equipment, such as energy storage and diesel generators. Since the latter consumes primary energy and causes pollution, energy storage is given priority to compensate for the power shortfall.
In this section, based on the diesel generator capacity proportion estimated according to the planning requirement, the minimization of energy storage capacity is taken as the objective function of initial optimization. Generally, the cost of energy storage accounts for a higher proportion of the total cost of microgrid construction. Hence, the minimization of energy storage capacity is taken as the initial target. The complementation of renewable energy resources is considered in this section as well. In addition, to avoid the energy storage oversizing in some extreme cases, here storage configuration is considered to meet the electricity demand for a predetermined time period.
First, the hourly mismatch power is calculated. It is not difficult to discover that energy storage charges if Δ(t)>0 and discharges if Δ(t)<0.
Δ(t)=λ[aPS(t)+bPH(t)+(1-a-b)PW(t)]+PD-L(t)
(1)
where λ is the ratio coefficient of the distributed generation capacity to the load capacity; a, b and 1-a-b are the proportions of photovoltaic power, hydro power and wind power, respectively; PW, PS, PH and L are the standardized data of wind power, PV power, hydro power and load demand, respectively.
Traditional allocation models of energy storage capacity[13] tend to differ in the maximum and minimum values of the electricity stored in the device during the entire time segment as the rated capacity. Under this condition, the rated capacity is considerable and will increase as time passes. Thus, the traditional configuration capacity expression is redefined as
(2)
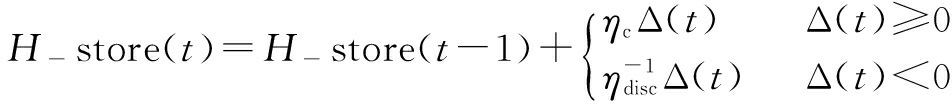
(3)
where β is the maximum depth of discharging; ηc and ηdisc are charging and discharging efficiency values, respectively; H-store(t) is the energy stored in device at time t. The difference in Eq.(2) represents the total release energy after time t. Eq.(2) ensures that the energy stored in device will not become negative at any time during the predetermined time period.
Here, a and b are taken as optimization variables and the minimization of energy storage capacity is taken as the objective function. Additionally, the limited SOC range is taken as the constraint. Then, the genetic algorithm is used to solve the problem.
After optimization, the optimal allocation ratios of the renewable energy resources and the corresponding energy storage capacity are obtained. Then, the initial optimal capacity of each generating set is acquired.
1.2 Determination of initial schemes
Although the ideal renewable energy capacity is achieved above, it is still difficult to select one type of generator directly due to the diversity of equipment parameters and investment cost of different types. Therefore, in this section, the ideal capacity obtained above will be taken as the standard value and be extended by the extended coefficient matrix to obtain different power allocation schemes. Additionally, only a single type is adopted in each group for convenience. The detailed steps are as follows:
Step 1 The ideal capacity of renewable energy and the corresponding energy storage equipment are obtained according to a and b as mentioned in Section 1.1.
Step 2 The ideal capacity values are multiplied by the extended coefficient matrix T to obtain the extended matrix A of the wind output power, extended matrix B of PV output power, extended matrix C of hydro output power and extended matrix D of energy storage capacity.
Step 3 Equipment type selecting principles are determined. A suitable type from the equipment type list is chosen and the corresponding quantity of generators is calculated to form the equipment selection list of the wind turbine, PV panel, hydro turbine and energy storage. Equipment type selecting principles include the common principle and the non-common principle. The former requires that the difference between the actual capacity and the ideal one is minimum. The latter requires that the maximum wind speed should not exceed the rated wind speed if the type of wind turbine is chosen and the rated capacity and power both need to be matched if the type of energy storage is chosen.
Step 4 The initial schemes are obtained through permutation and combination according to the equipment selection list.
Based on the historical meteorological data and load data, the simulation of the hybrid generation system is carried out under the guidance of energy management strategies. Then, each evaluation index from the different initial schemes is obtained. In addition, the quantity of diesel units is modified during this stage.
2.1 Energy management strategies
The main idea of energy management is to consume the output power of wind turbine, photovoltaic panel and hydro turbine first and then the energy storage to compensate for insufficient power. Diesel units are the last backup to call. The energy management process is shown in Fig.1
The main energy management strategies of the multi-energy power system concern energy storage and the diesel units.
2.1.1 Strategies for energy storage
Whenever the number of the working days reaches the predetermined time period value, the state of charge should be reset to 1.
As for charging strategies, when the total output power of the hybrid generation system is larger than load power Pload(t), the surplus energy usually charges the energy storage until one of the following two situations occurs: 1) The value of SOC Sb reaches the upper limit value Smax; 2) The output power of renewable energy hybrid power generation is less than or equal to the load power.
As for discharging strategies, when the total output power of the hybrid generation system is less than the load power, energy storage is used to compensate for the load gap. Energy storage discharges until one of the following two situations occurs: 1) The value of SOC Sb reaches the lower limit value Smin; 2) The total output power of the hybrid generation system meets the load demand.
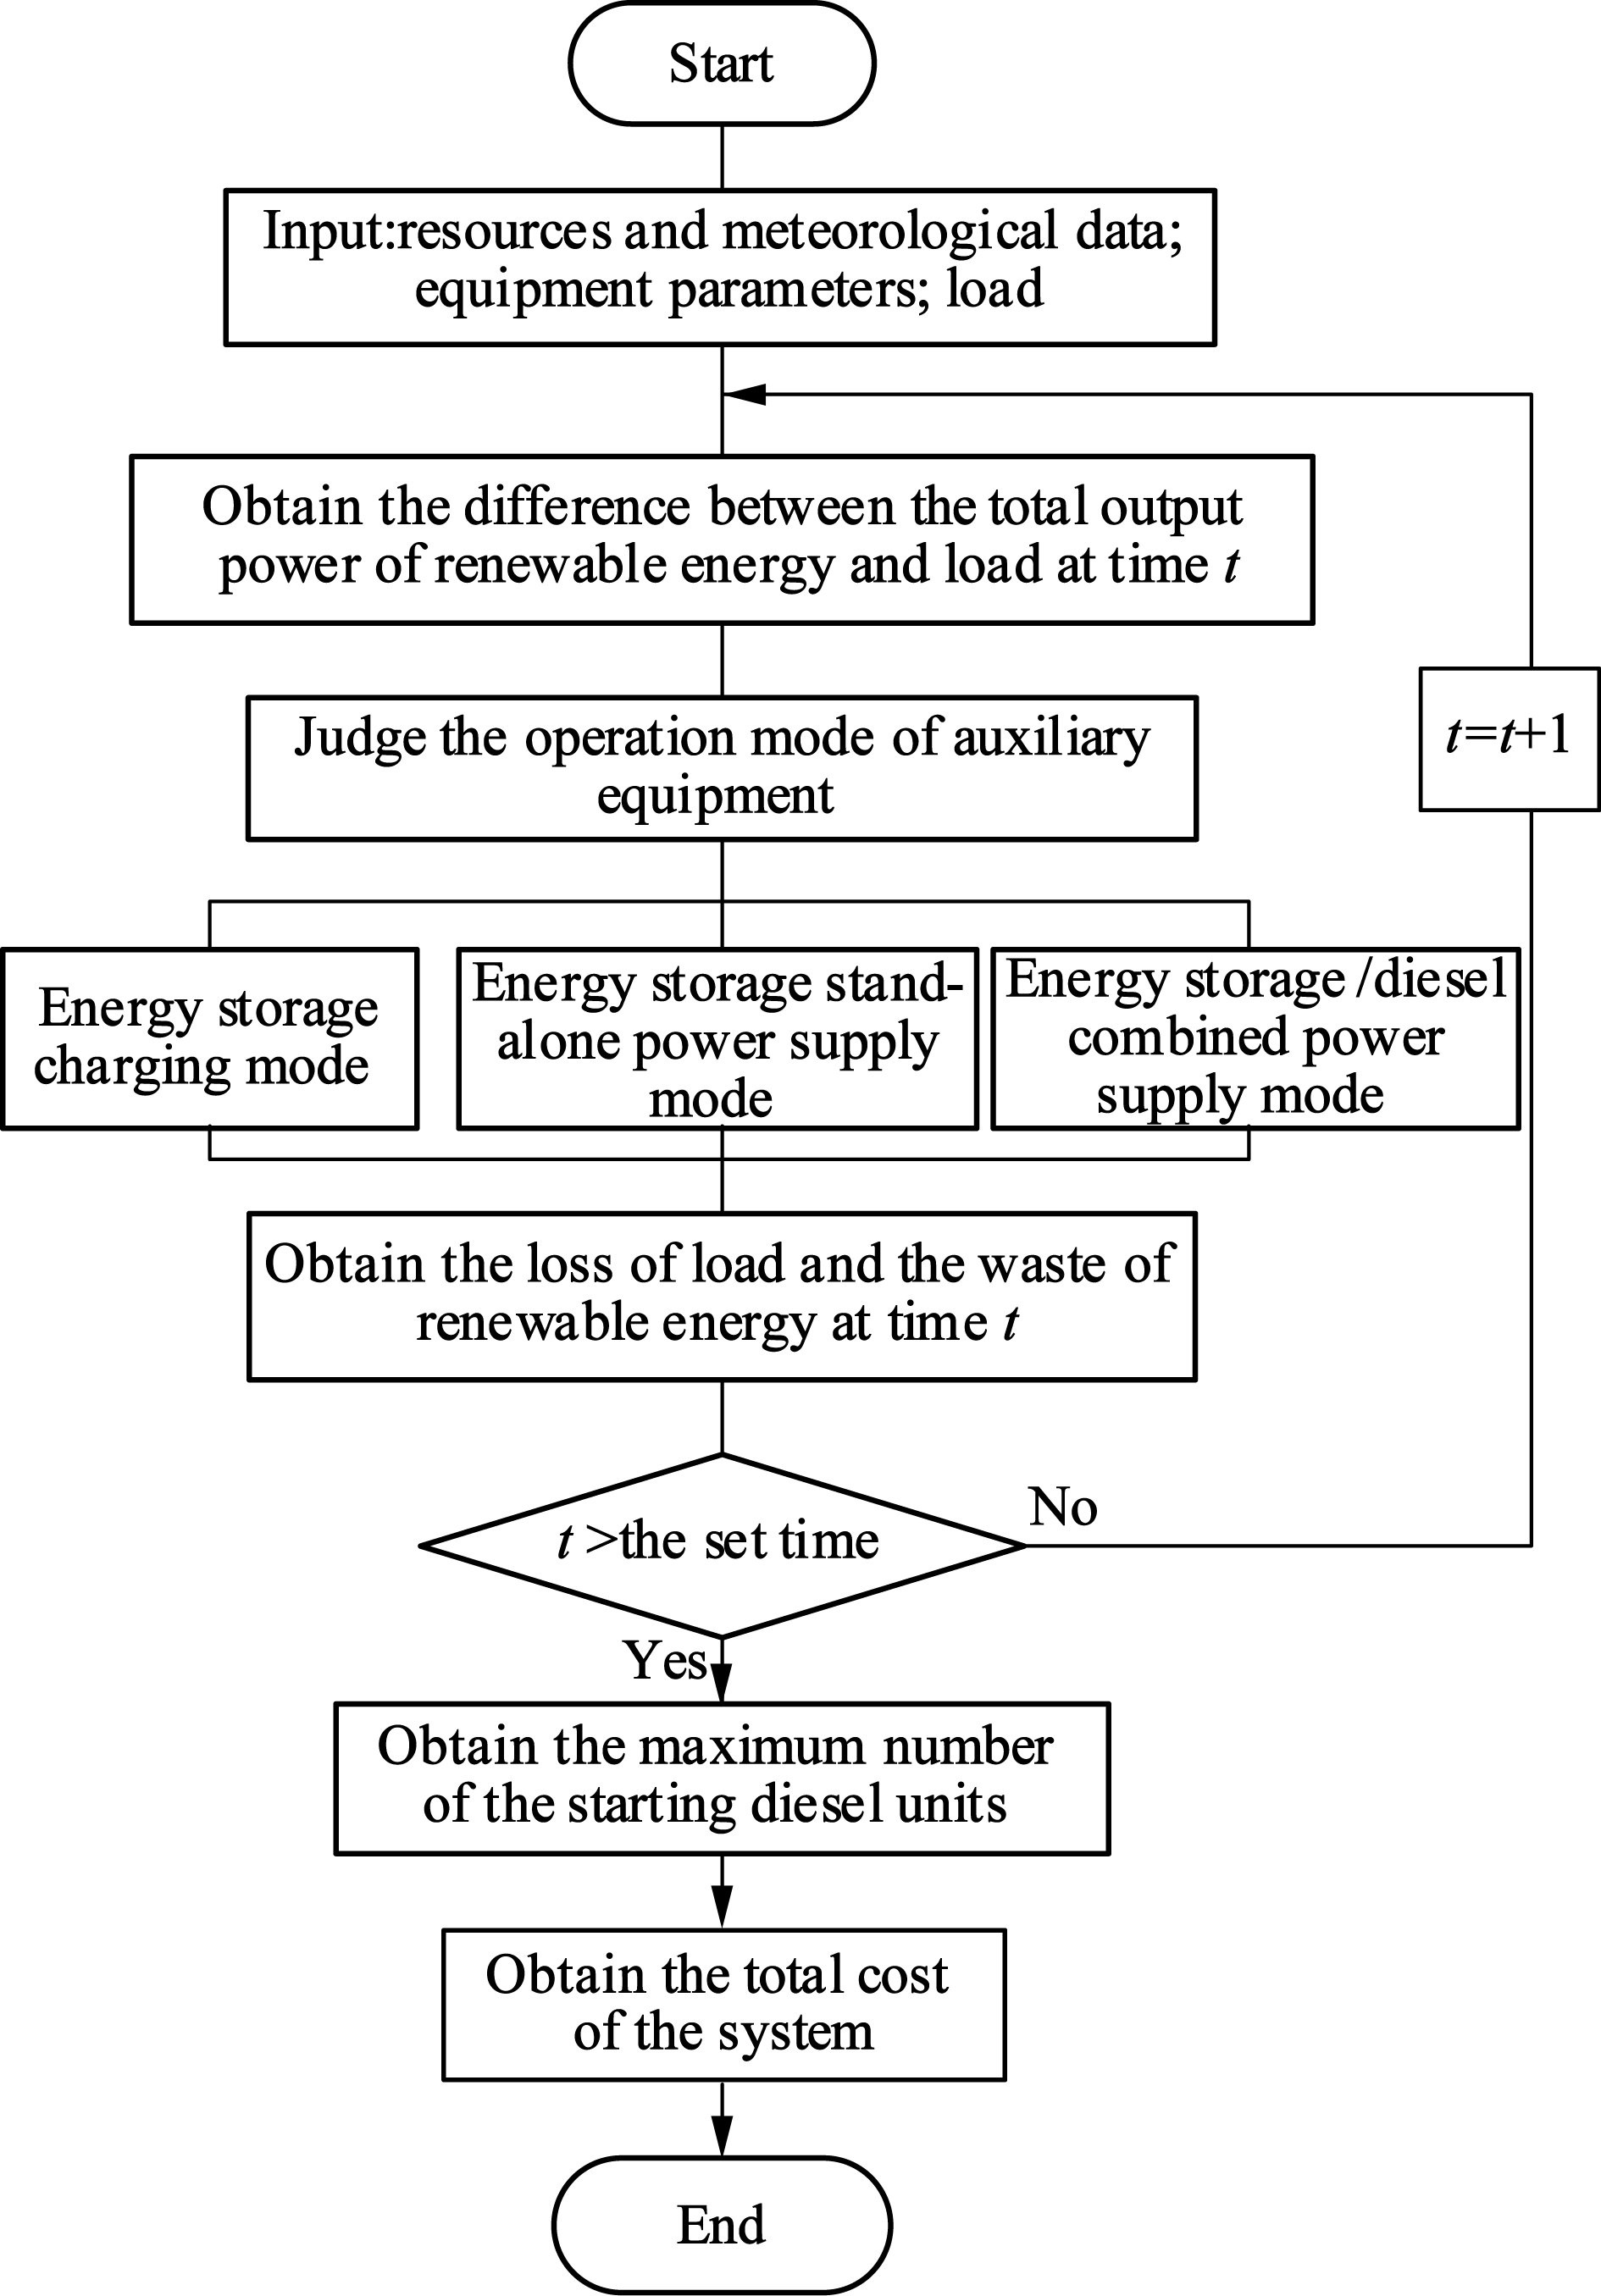
Fig.1 Flowchart of energy management
2.1.2 Strategies for diesel generators
If the power supply cannot be satisfied merely by energy storage, the diesel generator will be started at the same time. When the required power is greater than the minimum starting power Pdmin of the diesel generator, the diesel generators should be started one by one in order to ensure the economic operation. The minimum running time should be set to decrease the energy consumption caused by frequent startup and shutdown of generators. If the minimum running time is not reached, the operation state of the diesel generator will not switch.
Therefore, there are three operation modes of the auxiliary equipment, as shown in Fig.1. They are the energy storage charging mode, energy storage stand-alone power supply mode and energy storage/diesel combined power supply mode.
When one of the following two power shortage situations occurs, the energy storage works in the stand-alone power supply mode: 1) The insufficient power Pb is not greater than the maximum output power of the energy storage Prbat and after energy storage continuously discharges for per unit time period with Pb, Sb is not less than Smin. 2) Pb is greater than Prbat, but-PbPrbat is less than Pdmin.
When the other power shortage situations occur, energy storage works in the energy storage/diesel combined power supply mode. The output power of energy storage Pbatis calculated by
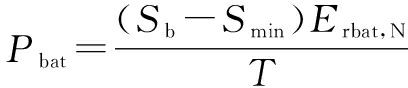
(4)
where Erbat,N is the rated capacity of energy storage; T is the unit time period. The diesel output power Pd is calculated by
Pd=-Pb-Pbat
(5)
When power is surplus and SOC does not reach the upper limit, energy storage works in the charge mode until SOC reaches the upper limit and wastes the excess power.
2.2 Evaluation indices of initial schemes
The system total cost (STC), loss of clean energy probability (LOEP) and loss of load probability (LOLP) are three main evaluation indices of the hybrid generation system. Here, the linear weighting method is adopted to integrate the above three indices. The weight coefficients are determined by the AHP method and then the comprehensive evaluation index (CEI) is obtained. First of all, the values of STC, LOEP and LOLP are obtained through loop computing. Assuming that the planning working period of the micro grid is Y years, the value of STC is obtained as
ESTC=cost(numWT,numPV,numHT,numES,numdiesel)=
costWT+costPV+costHT+costES+costdiesel=
numWT(CWT+MWT,Y)+numPV(CPV+MPV,Y)+
numHT(CHT+MHT,Y)+numES(CES+MES,Y)+
[numdiesel(Cdiesel+Mdiesel,Y)+Cfuel]
(6)
where
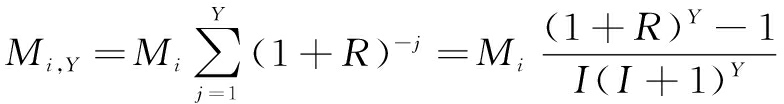
(7)
In Eq.(6), costi and Ci are the total cost and investment cost of generating set i, respectively. Mi,Y is the cost of operation and maintenance (O& M) of generating set i for Y years. Mi is the cost of O& M at present numi is the quantity of generators in generating set i. Here, i can represent WT (wind turbine set), PV (photovoltaic panel set), HT (hydro turbine set), ES (energy storage set) and diesel (diesel generator set)
The value of LOEP is calculated as follows:
W(t)=EES(t-1)+(EW(t)+ES(t)+EH(t)-QL(t))ηc
(8)
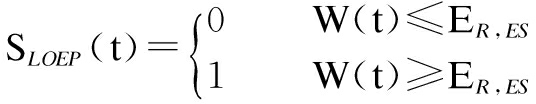
(9)
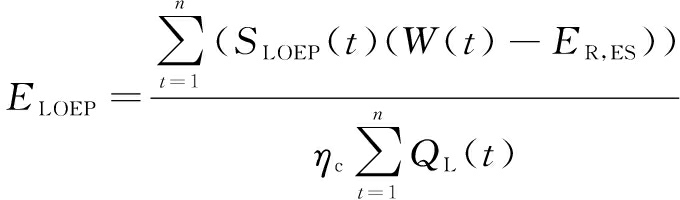
(10)
where EES(t-1) is the remaining energy of energy storage at time t-1; EW(t), ES(t) and EH(t) are the output energy of wind turbines, PV panels and hydro turbines, respectively, at time t; ER,ES is the rated capacity of energy storage and QL(t) is the load demand at time t; ELOEP is the value of LOEP.
The value of LOLP is calculated as follows:
W(t)=Eag(t)+EW(t)+ES(t)+EH(t)-QL(t)
(11)
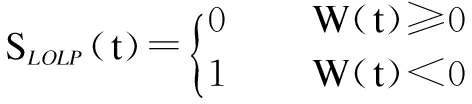
(12)
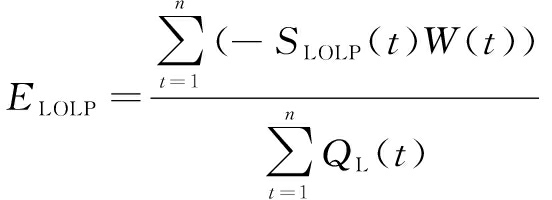
(13)
where Eag(i) is the output energy of auxiliary equipment at time i; ELOLP is the value of LOLP.
To make the above three indices comparable, indices should be normalized by
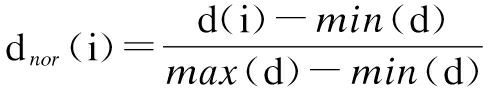
(14)
where d is the data to be normalized.
The value of CEI is obtained as follows:
ECEI=ωSTCESTCnor+ωLOEPELOEPnor+ωLOLPELOLPnor
(15)
where ωSTC, ωLOEP and ωLOLP are the weight coefficients determined by the AHP weight calculation method according to the importance ranking of STC, LOEP and LOLP, respectively; ECEI is the value of CEI.
In this section, a case study is given based on the meteorological data of an area in Jiangxi Province. The final configuration scheme will be compared with the results under similar circumstances by HOMER Pro software.
In this case, assume that the diesel can support 10% of the load power supply. The equipment type list for the selection is shown in Tabs.1 to 3. Assume that λ=1.1, ηc=0.8 and ηdisc=0.8. The influence of allocation ratios of the wind power and PV power on energy storage capacity is shown in Fig.2 by mesh graph.
Tab.1 Equipment type list of diesel generators, PV panels and hydro turbine

SetTypeRatedpower/kWCost/yuanO&M/(yuan·year-1)DieselD184500800D21060001000PVpanelPV10.31590010PV20.2607808PV30.1955505PV41300020HydroturbineH16300080H22025000250H316.5500001000H418011000011000
Tab.2 Equipment type list of batteries
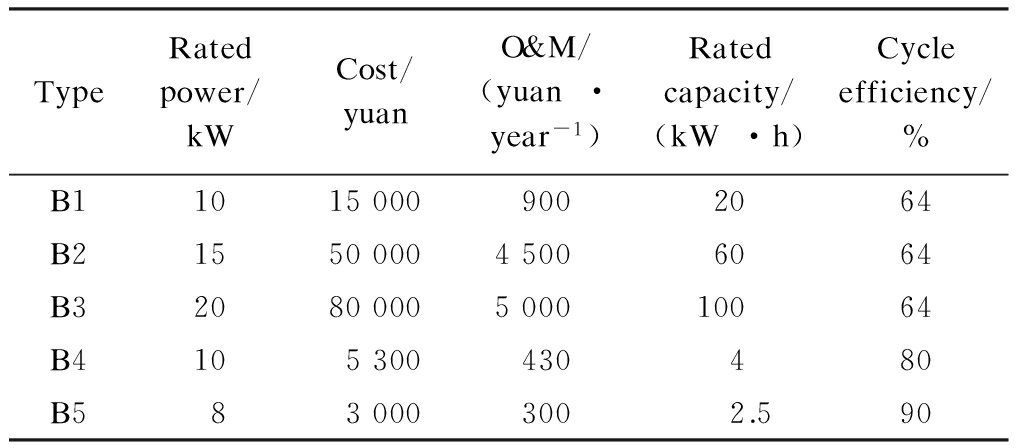
TypeRatedpower/kWCost/yuanO&M/(yuan·year-1)Ratedcapacity/(kW·h)Cycleefficiency/%B110150009002064B2155000045006064B32080000500010064B4105300430480B5830003002.590
Tab.3 Equipment type list of wind turbines
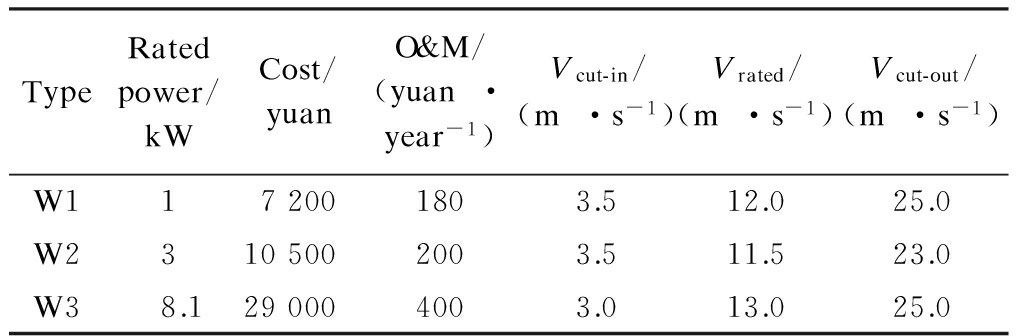
TypeRatedpower/kWCost/yuanO&M/(yuan·year-1)Vcut-in/(m·s-1)Vrated/(m·s-1)Vcut-out/(m·s-1)W1172001803.512.025.0W23105002003.511.523.0W38.1290004003.013.025.0
Note: Vcut-in, Vrated and Vcut-out are the cut-in wind speed, rated wind speed and cut-out wind speed, respectively.
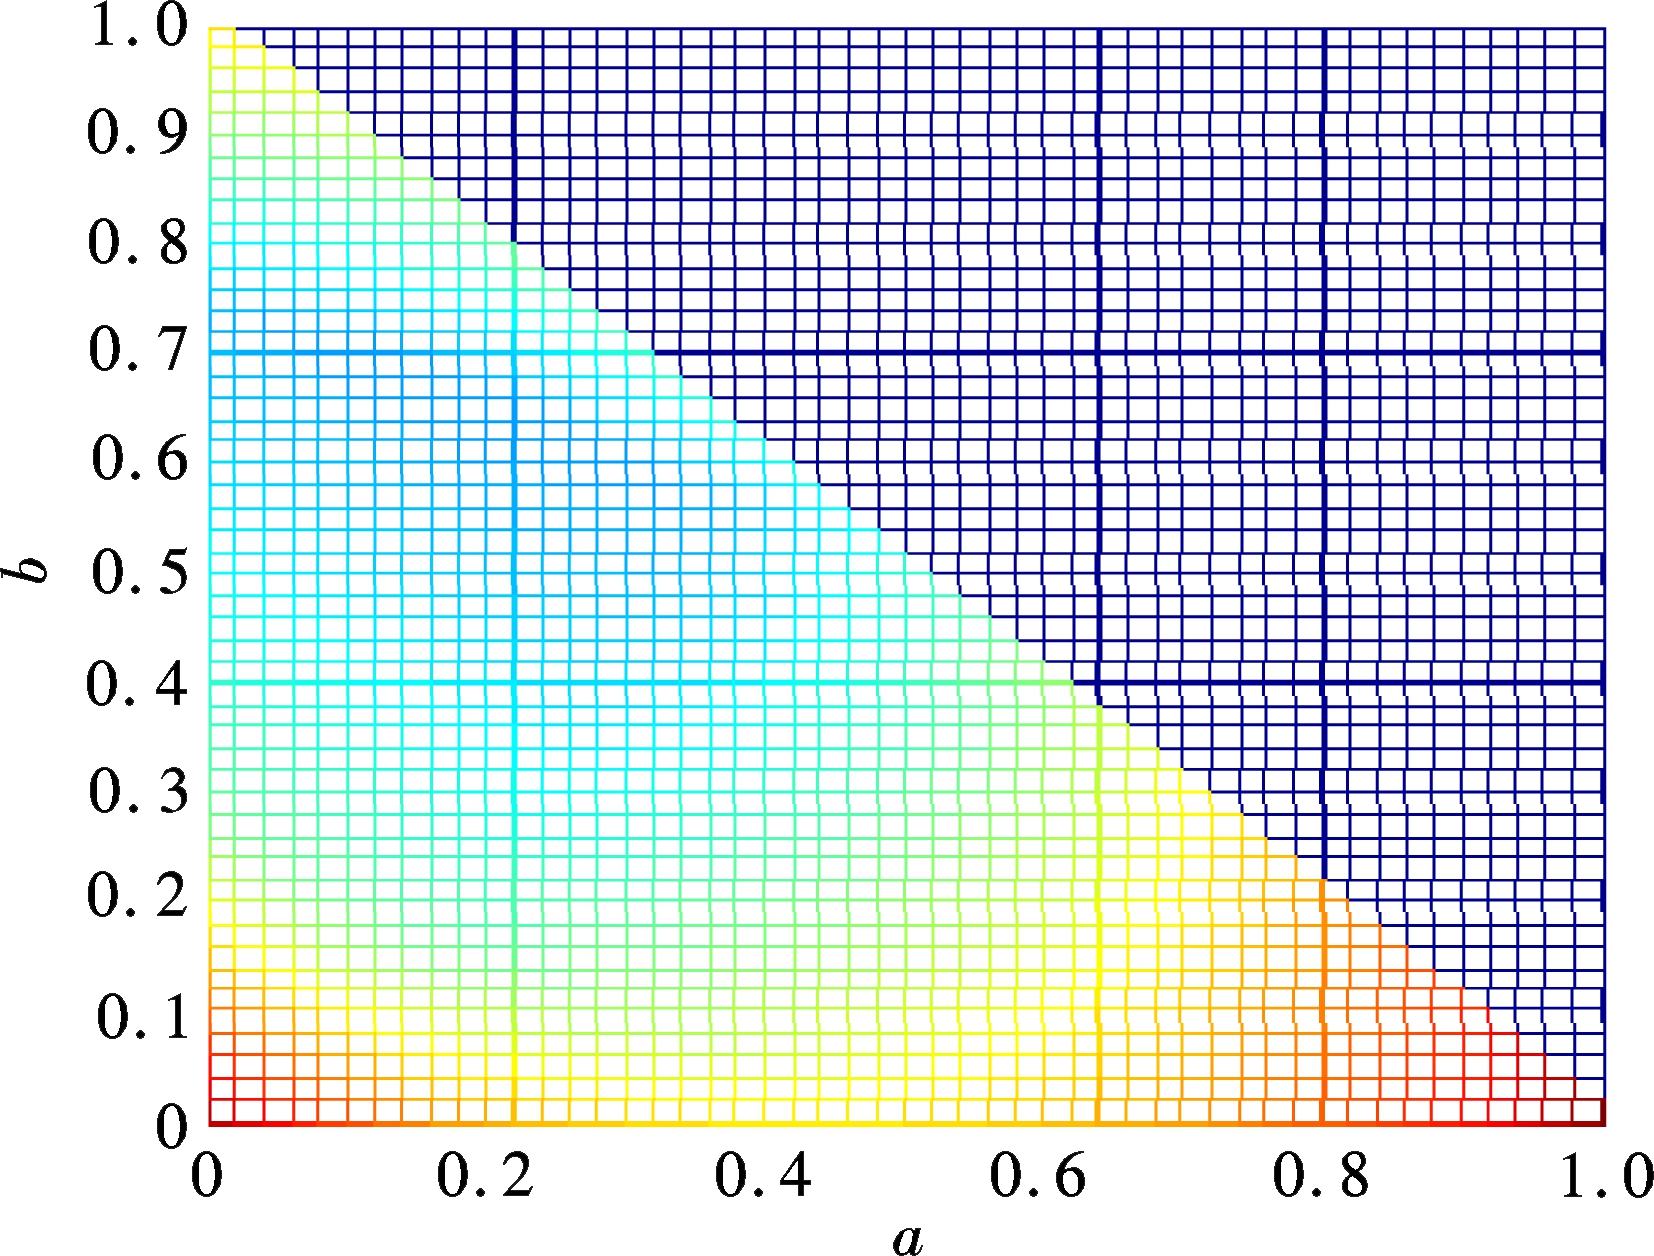
Fig.2 Influence of renewable energy allocation ratios on energy storage capacity
As shown in Fig.2, the lower left region is feasible. The capacity of energy storage decreases as the color deepens. Optimal allocation ratios of renewable energy resources are obtained by the genetic algorithm. After 50 iterations, the solution is relatively stable and the ratios of PV power, hydro power and wind power are 16.77%, 60.79% and 22.44%, respectively. The corresponding energy storage capacity is 0.004 3. Hence, the installed capacity values of wind turbines, PV panels and hydro turbines are 4.0, 3.0 and 10.9 kW. Assuming that the energy storage can guarantee power supply reliability for at least a quarter of a year, the value of corresponding storage capacity is 165.8 kW·h.
Assuming that the extended coefficient matrix T=[0.8, 1, 1.2], the extended matrix of wind power, PV power and hydro power are, respectively, A=[3.2, 4.0, 4.8], B=[2.4 3 3.6] and C=[8.7, 10.9, 13.1]. The extended matrix of energy storage capacity is D=[132.6, 165.8, 199.0]. We select the suitable type from Tab.1 to Tab.3 and calculate the quantity of wind turbines, photovoltaic panels, hydro turbines and energy storage according to the equipment selection principles mentioned in section 1.2. 144 groups of initial schemes are obtained after permutation and combination.
Then, the operation of the hybrid power system is simulated according to the energy management strategies and the indices of LOLP and LOEP are obtained. Assuming that the importance ranking are LOLP> STC> LOEP, the weight of the three indices is 0.64, 0.26 and 0.10, respectively, by the AHP method. In this section, two scenarios with different weight coefficients are considered.
3.1 Results
Scenario 1 The weights of LOLP, LOEP and STC are 0.64, 0.1 and 0.26, respectively.
Scenario 2 The weights of LOLP, LOEP and STC are 0, 0, and 1, respectively.
The value of CEI is calculated by Eq.(15). 144 groups of initial schemes are sorted by the value of CEI. The results are shown in Tabs.4 and 5.
Tab.4 Results of ranking schemes when ωLOLP=0.64, ωLOEP=0.1, ωSTC=0.26 (only top 5 are given)
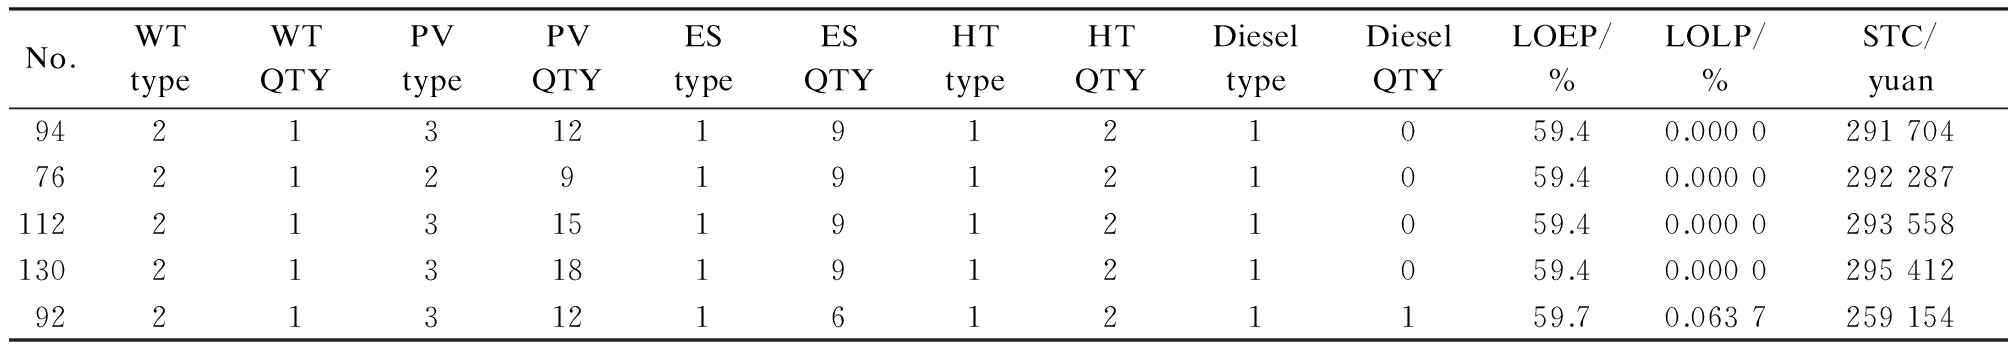
No.WTtypeWTQTYPVtypePVQTYEStypeESQTYHTtypeHTQTYDieseltypeDieselQTYLOEP/%LOLP/%STC/yuan942131219121059.40.000029170476212919121059.40.00002922871122131519121059.40.00002935581302131819121059.40.0000295412922131216121159.70.0637259154
Tab.5 Results of ranking schemes when ωLOLP=0, ωLOEP=0, ωSTC=1 (only top 5 are given)
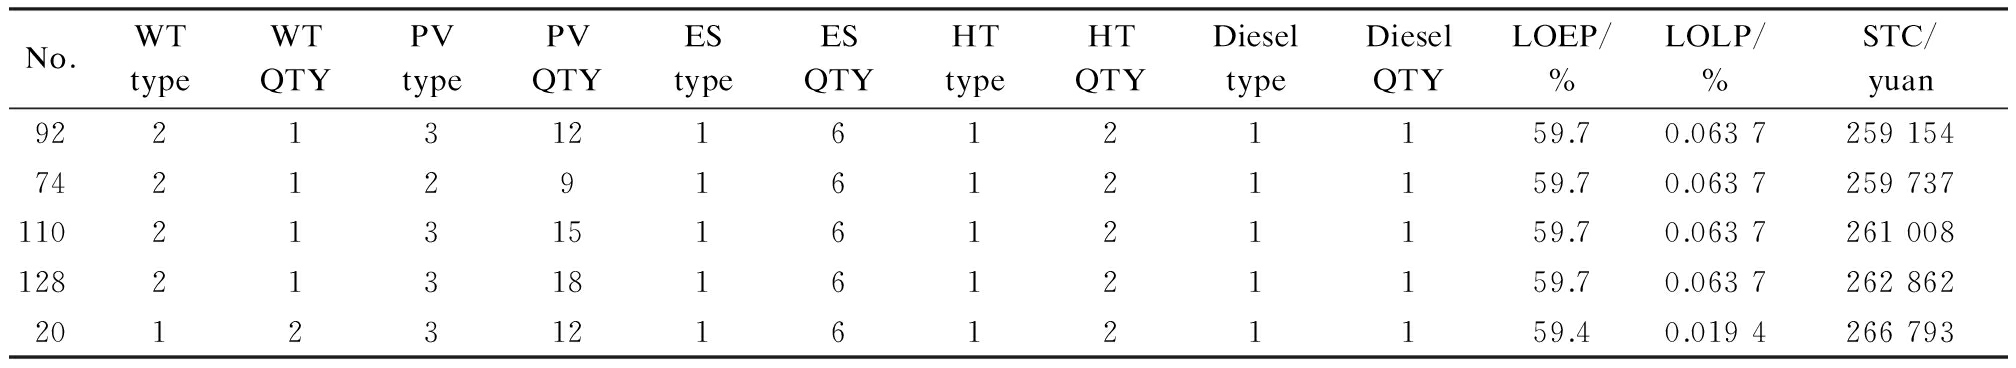
No.WTtypeWTQTYPVtypePVQTYEStypeESQTYHTtypeHTQTYDieseltypeDieselQTYLOEP/%LOLP/%STC/yuan922131216121159.70.063725915474212916121159.70.06372597371102131516121159.70.06372610081282131816121159.70.0637262862201231216121159.40.0194266793
3.2 Analysis
3.2.1 Complementary analysis
We calculate the index values of the loss of load probability k, the maximum ratio of output power α, the minimum ratio of output power β and the capacity ratio of energy storage ε[14] under the optimal proportion and non-optimal proportion of renewable energy resources.
Index values under optimal proportion: k=0.345 0; α=0.273 3; β=0.954 3; ε=0.033 6.
Index values under non-optimal proportion (45% wind power, 25% PV power, 30% hydro power): k=0.406 4; α=0.338 0; β=0.504 7; ε=0.139 2.
According to the above results, it is clear that better complementation is achieved with optimal ratios of renewable energy. The loss of load probability is decreased and the power supply reliability of the stand-alone microgrid is enhanced under this circumstance.
3.2.2 Schemes comparison
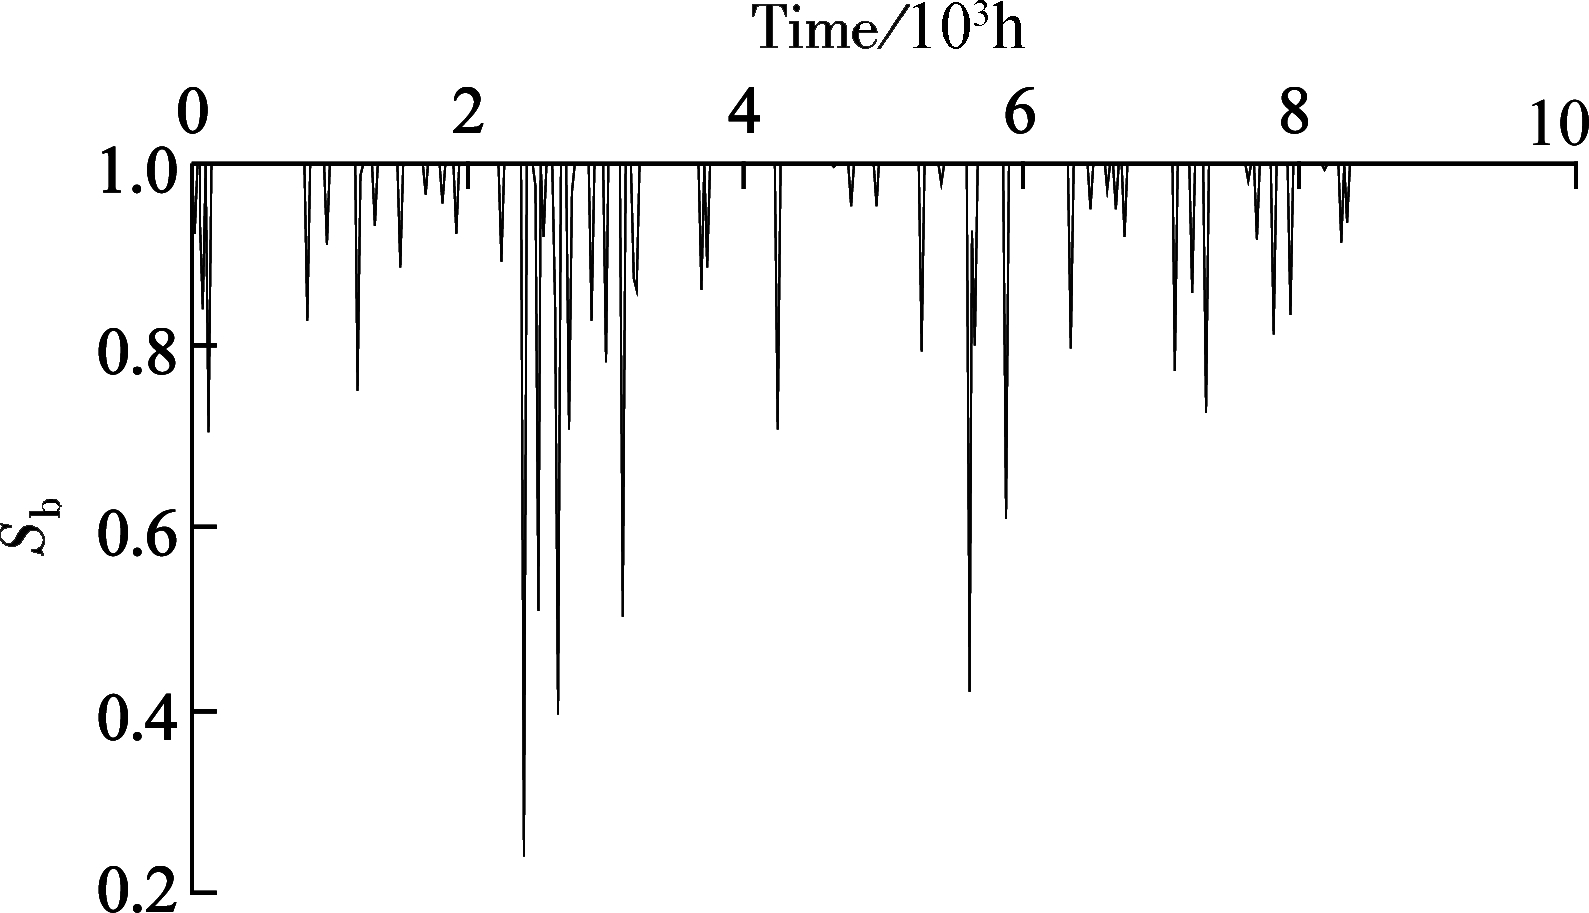
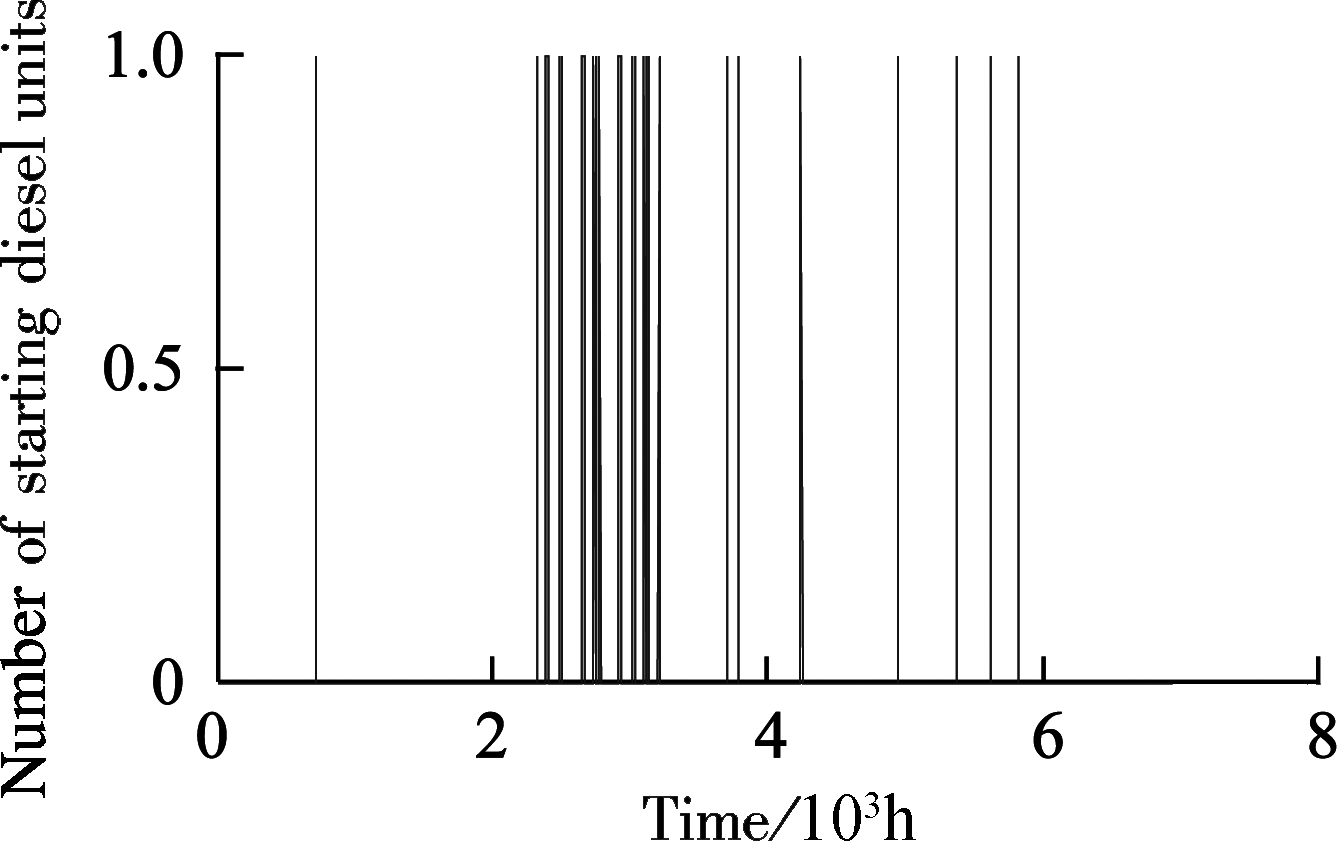
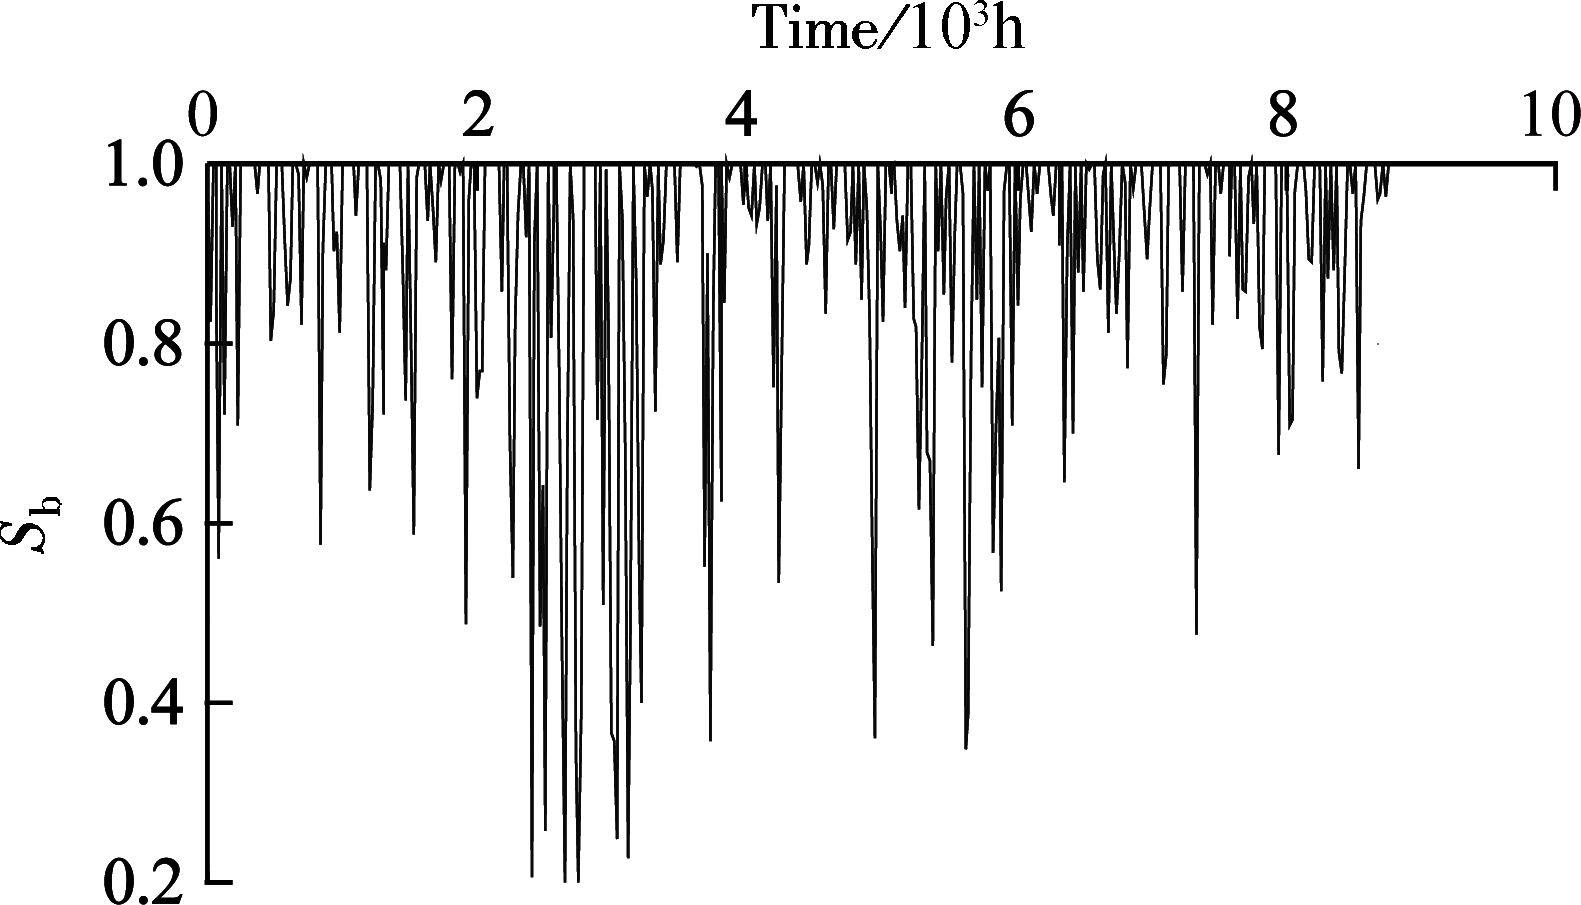
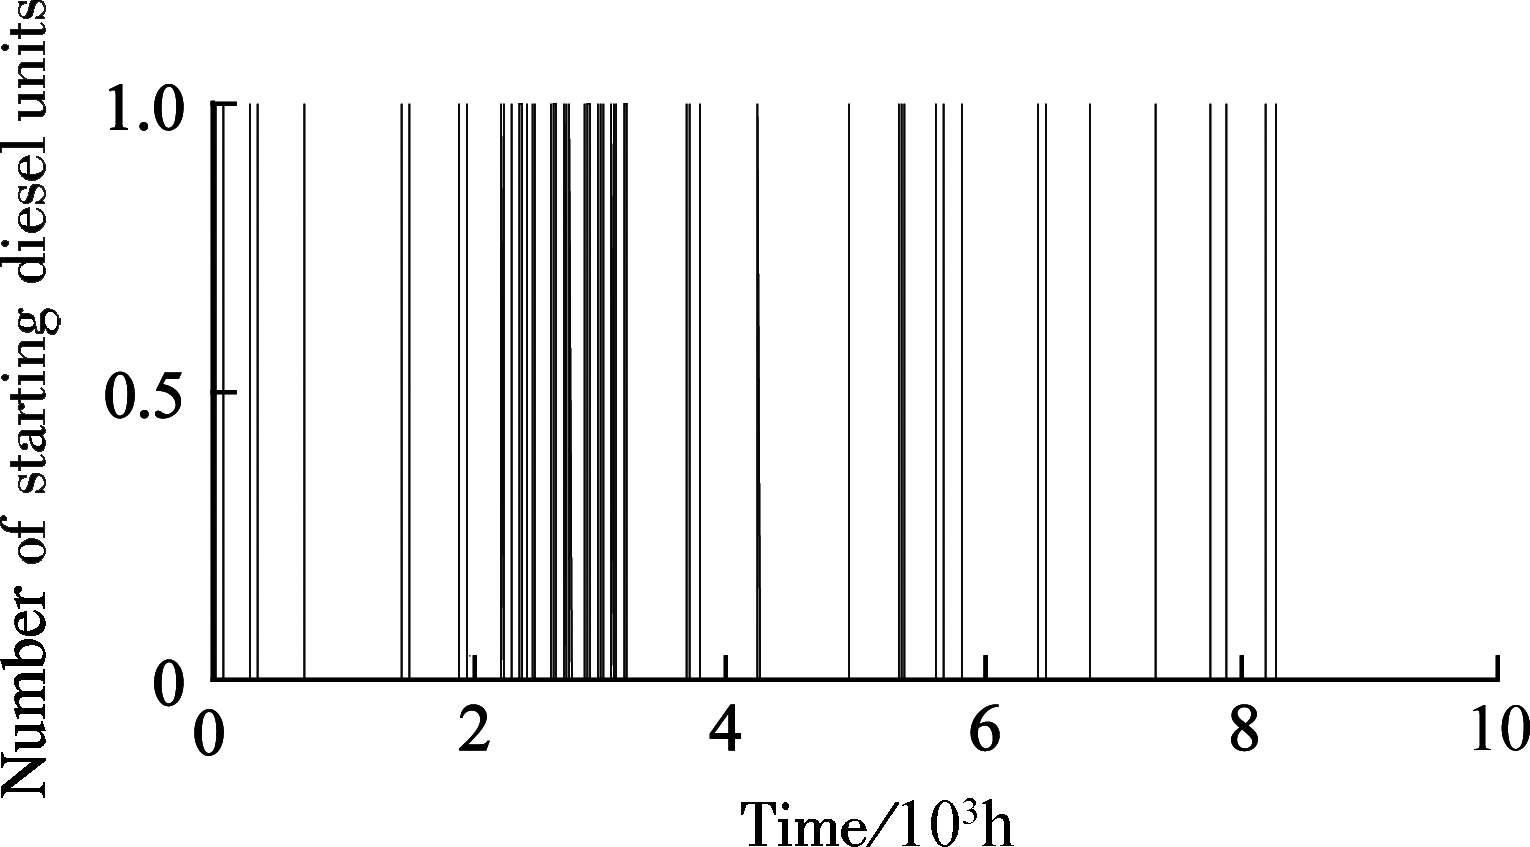
Scenario 1 is taken as an example. We compare the initial scheme No.94 with No.130. The fluctuation of SOC and the quantity of starting diesel generators at each hour are shown in Fig.3 and Fig.4. The fluctuation of SOC in No.130 is more dramatic than that in No.94 and there are more frequent switches between startup and shutdown of diesel generators in No.130, which is unfavorable to equipment.
3.2.3 Cost verification
Here, HOMER Pro is adopted for comparison with the model in this paper. As HOMER Pro can only solve the model with user setting types and probable number of equipment, it lacks the consideration of the complementation among the renewable energy resources.
The scheme No.92 is taken as an example to construct a project in HOMER Pro and the same meteorological resource data is input. The simulation results are shown in Tab.6.
Notice that the results in HOMER Pro can only be sorted by STC. That is to say, this condition is equal to Scenario 2. As shown in Tab.5 and Fig.6, the costs obtained by the two methods are almost equal. Hence, the cost calculation by this algorithm is relatively rational.
(a)
(b)
Fig.3 Profiles of SOC and the number of diesel units in use at each hour (No.94). (a) Fluctuation curve of SOC; (b) Number of starting diesel generators at each hour
(a)
(b)
Fig.4 Profiles of SOC and the number of diesel units in use at each hour (No.130). (a) Fluctuation curve of SOC; (b) Number of starting diesel generators at each hour
Tab.6 Configuration results by HOMER Pro
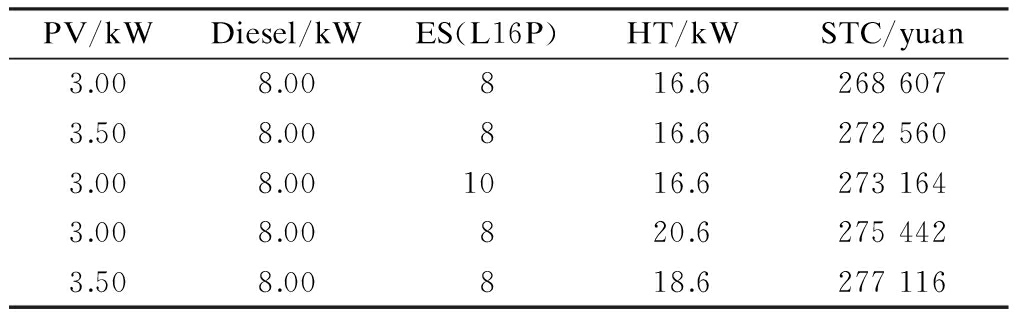
PV/kWDiesel/kWES(L16P)HT/kWSTC/yuan3.008.00816.62686073.508.00816.62725603.008.001016.62731643.008.00820.62754423.508.00818.6277116
In this paper, a novel configuration optimization model for a multi-energy generation system and its auxiliary equipment are proposed. Compared with the traditional method only based on the intelligent algorithm, this model can not only take the diversity of different equipment parameters and investment cost into consideration; but also easily be developed into configuration software for planning the distributed power generation system due to its practicality and easy realization. Additionally, unlike HOMER Pro, it considers the complementation of different renewable energy resources and the rationality of the multi-energy DG system is improved compared with the single evaluation method which only considers the total cost.
[1]Karki R, Billinton R. Reliability/cost implications of PV and wind energy utilization in small isolated power systems[J]. IEEE Transactions on Energy Conversion, 2011, 16(4): 368-373. DOI:10.1109/60.969477.
[2]Borowy B S, Salameh Z M. Methodology for optimally sizing the combination of a battery bank and PV array in a wind/PV hybrid system[J]. IEEE Transactions on Energy Conversion, 1996, 11(2): 367-373. DOI:10.1109/60.507648.
[3]Xu Q S, Zang H X, Bian H H. Establishment and feasibility researches of practical solar radiation model[J]. Acta Engergiae Solaris Sinica, 2011, 32(8): 1180-1185.(in Chinese)
[4]Ma Y W, Yang P, Guo H X,et al.Power source planning of wind-PV-biogas renewable energy distributed generation system[J].Power System Technology, 2012, 32(9): 9-14. (in Chinese)
[5]Koutroulis E, Kolokotsa D, Potirakis A, et al. Methodology for optimal sizing of stand-alone photovoltaic/wind-generator systems using genetic algorithms[J]. Solar Energy, 2006, 80(9): 1072-1088. DOI:10.1016/j.solener.2005.11.002.
[6]Li H, Zang C, Zeng P, et al. A genetic algorithm-based hybrid optimization approach for microgrid energy management[C]//IEEE International Conference on Cyber Technology in Automation, Control, and Intelligent Systems. Shenyang, China, 2015: 1474-1478. DOI:10.1109/cyber.2015.7288162.
[7]Dufo-López R, Bernal-Agustín J L. Design and control strategies of PV-Diesel systems using genetic algorithms[J]. Solar Energy, 2015, 79(1): 33-46. DOI:10.1016/j.solener.2004.10.004.
[8]Khatod D K, Pant V, Sharma J. Evolutionary programming based optimal placement of renewable distributed generators[J]. IEEE Transactions on Power Systems, 2013, 28(2): 683-695. DOI:10.1109/tpwrs.2012.2211044.
[9]Li C B, Chang H, Feng X, et al. Expansion planning of wind-thermal co-generation system in microgrid[J]. Electric Power Automation Equipment, 2014, 34(3): 47-51. (in Chinese)
[10]Dursun B, Gokcol C, Umut I, et al. Techno-economic evaluation of a hybrid PV-wind power generation system[J]. International Journal of Green Energy, 2013, 10(2): 117-136. DOI:10.1080/15435075.2011.641192.
[11]Yang Q, Ma S Y, Tang X J, et al. Evaluation index system construction and application of microgrid planning[J]. Automation of Electric Power Systems, 2012, 36(9): 13-17. (in Chinese)
[12]Xiao J, Bai L Q, Wang C S, et al.Method and software for planning and designing of microgrid[J].Proceedings of the CSEE, 2012, 32(25): 149-157. (in Chinese)
[13]Chen H. Optimum capacity determination of stand-alone hybrid generation system considering cost and reliability[J]. Applied Energy, 2013, 103: 155-164. DOI:10.1016/j.apenergy.2012.09.022.
[14]Zhong Y. Energy complementary evaluation index and its application[D].Changsha: College of Electrical and Information Engineering, Hunan University, 2013. (in Chinese)
References:
摘要:为了有效整合微电网中不同新能源发电设备,提出了一种面向多能互补分布式新能源发电系统及其辅助设备的电源配置优化模型.该模型首先确定电源配置的初始方案,然后根据用户偏好对初始方案进行优选.通过层次分析指标权重计算方法得到各初始方案的综合评估指标值,并对初始方案进行排序.针对不同型号设备参数多样性及投资成本的差异,该方法可以给出相对合适、经济的电源配置方案建议.此外,较之目前主流Homer Pro,所提出的规划方法考虑了多种新能源之间互补性,相比仅考虑综合成本的单一评价方式,提高了多能源微网配置的合理性.
关键词:多能互补;分布式发电;配置优化;能量管理;综合评价指标;层次分析
中图分类号:TM744
Received:2016-09-12.
Foundation item:s:The National Natural Science Foundation of China (No.51377021), the Science and Technology Project of State Grid Corporation of China (No.SGTJDK00DWJS1600014).
Citation::Xu Qingshan, Xu Minjiao, Li Guodong, et al. Configuration optimization model of multi-energy distributed generation system[J].Journal of Southeast University (English Edition),2017,33(2):182-188.
DOI:10.3969/j.issn.1003-7985.2017.02.010.
DOI:10.3969/j.issn.1003-7985.2017.02.010
Biography:Xu Qingshan (1979—), male, doctor, professor, xuqing-shan@seu.edu.cn.