Evaluation of fatigue property of asphalt mixtures based on digital image correlation method
Jiang Jiwang Ni Fujian
(School of Transportation, Southeast University, Nanjing 210096, China)
Abstract:In order to evaluate the accumulative of tensile strain in the process of fatigue failure, the digital image correlation (DIC) method was utilized to characterize the tensile strain development of asphalt mixtures in the indirect tensile (IDT) fatigue test. Three typical hot mix asphalt (HMA) mixtures with varying nominal maximum aggregate sizes were tested at four stress levels. During the tests, a digital camera was mounted to capture the displacement/strain fields on the surface of the specimen by recording the real-time change of speckle position. The results indicate that the vertical deformation curve can barely evaluate the fatigue performance accurately due to the non-negligible local deflection near the loading point. However, based on the analysis of strain fields, the optimal fatigue cracking zone is determined as a 40 mm×40 mm rectangle in the middle of the specimens. Also, a reasonable fatigue model based on the tensile strain curves calculated by DIC is proposed to predict the fatigue lives of asphalt mixtures.
Key words:asphalt mixtures; fatigue behavior; digital image correlation; indirect tensile fatigue test
Fatigue cracking due to the application of repeated traffic load and severe environment conditions is a significant distress found in asphalt pavement[1-2]. The development and propagation of fatigue cracking in asphalt mixtures can be divided into two phases as pre-localization and post-localization[3]. The initiation and propagation of micro-cracks are categorized into the pre-localization stage while the formation and development of macro-fractures are termed as the post-localization stage. To uncover the rule of fatigue failure for asphalt mixtures, much research has been conducted by different laboratory tests, such as the four point beam fatigue test, semicircular bending fatigue test, single edge notch beam fatigue test, direct tensile fatigue test and indirect tensile fatigue test[4-8]. However, none of them was considered to be a standard fatigue test protocol for asphalt mixtures. The loading condition for these laboratory tests can be classified into two types: controlled stress and controlled strain[9]. The strain-controlled mode is employed for asphalt mixtures utilized in thin pavements since the strain level remains almost constant at the bottom of a thin layer. For a thick layer, the stress level remains constant at the bottom, so the stress-controlled mode is applied for mixtures used in thick pavement. The fatigue process is divided into two phases and the fatigue criteria is determined by defining the beginning of post-localization as the fatigue failure point based on the change of modulus, phase angle or dissipated energy[10-11]. As a result, the definitions of the fatigue life of mixtures are not uniform. The widely accepted fatigue failure is defined at the cycle when the mixture reaches 50% of its initial flexural stiffness[12]. The 50% reduction of the initial stiffness was determined arbitrary which can barely explain the development and propagation of the fatigue fractures. A non-contact measurement technology, called the digital image correlation (DIC) technique, was applied in this study to explore the fatigue cracking behavior and displacement/strain field of asphalt mixtures[13]. DIC was proposed to determine the reasonable gauge length of the indirect tension test by measuring the displacement/strain field of specimens. In addition, this method provides the possibility to calculate the displacement/strain value of any location in the specimen by comparing it with the traditional strain gauge or LVDTs. It is also observed that the errors between DIC results and strain gauge data are within 200 micro-strains[14]. Therefore, it is feasible to measure the fatigue behavior of asphalt mixtures by the DIC system.
The main objective of this study is to evaluate the fatigue performance of hot mix asphalt (HMA) mixtures based on the IDT fatigue test with DIC technique. First, the accuracy of the DIC system was verified by comparing the vertical deformation results from both the LVDTs and the DIC system. Then, to explain the local deformation near the loading point, the displacements of several points between two loading points were also calculated by the DIC system. The tensile strains of HMA mixtures during the fatigue cracking in the horizontal direction with varying gauge lengths were also investigated to determine the optimal gauge length. Finally, based on the full field fatigue deformation observation, the fatigue curves of tensile strain and life prediction were verified in the IDT fatigue test.
1 Materials and Mixture Designs
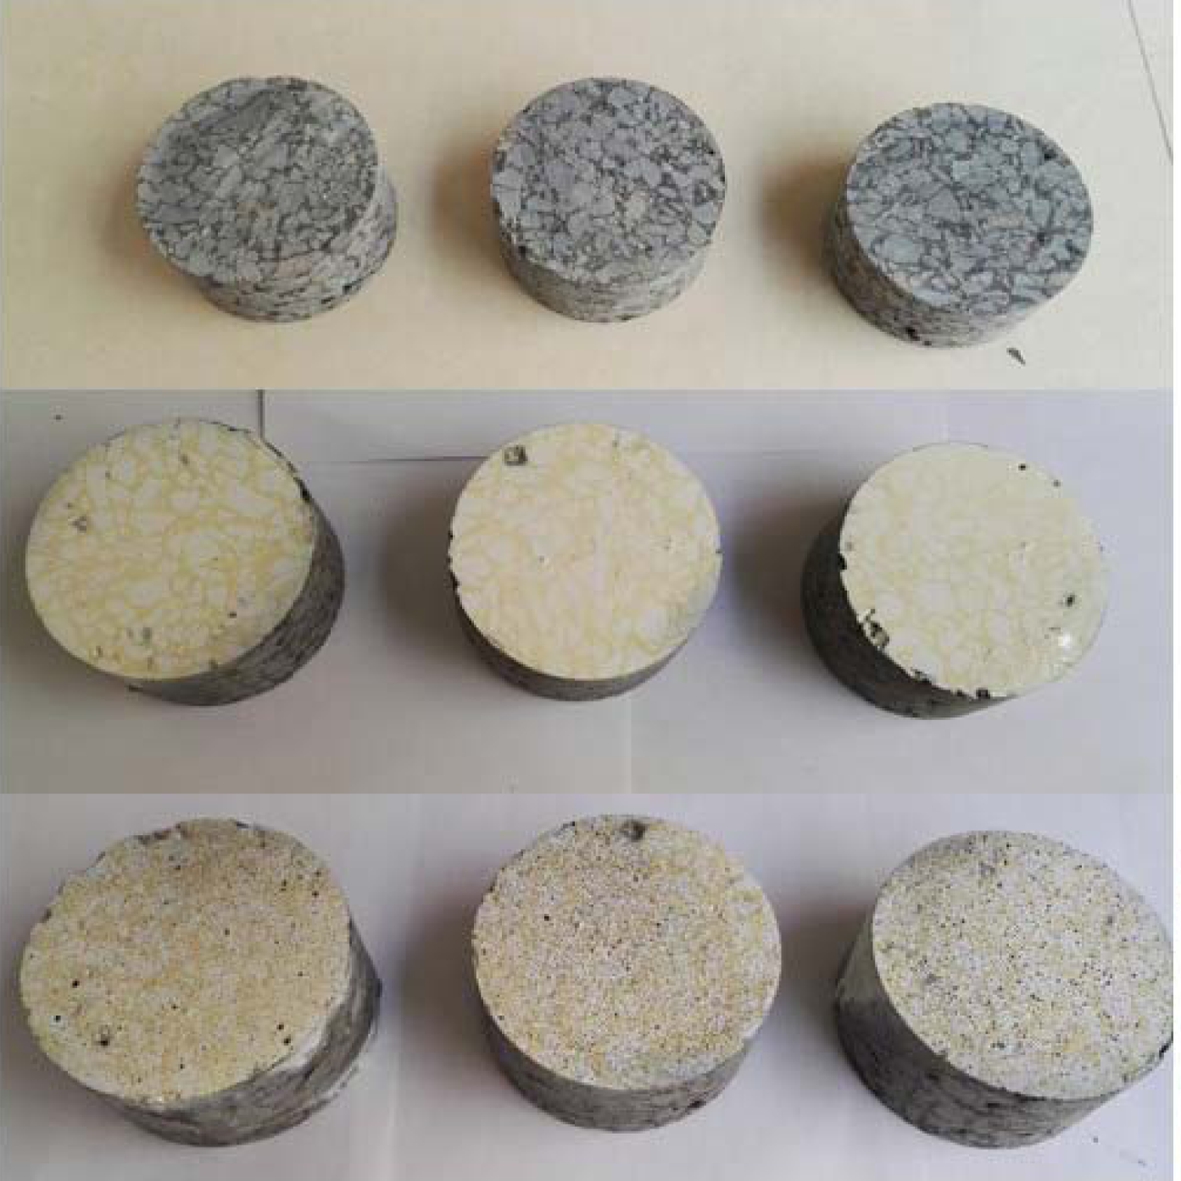
In order to apply the DIC system to fatigue evaluation of asphalt mixtures by the IDT fatigue test, three typical dense graded asphalt content mixtures with varying nominal maximum aggregate sizes (NMAS) of 13.2, 19 and 26.5 mm (named as AC-13, AC-20 and AC-25), respectively, were selected for this study. A styrene-butadiene-styrene (SBS) modified asphalt binder of PG64-22 was used for these three mixtures. The optimal asphalt content was determined to be 4.5% by the weight of AC-13, 4.1% for AC-20 and 3.9% for AC-25. The aggregate gradations of these three mixtures are designed as shown in Tab.1.
Tab.1 Aggregate gradations and mix design results
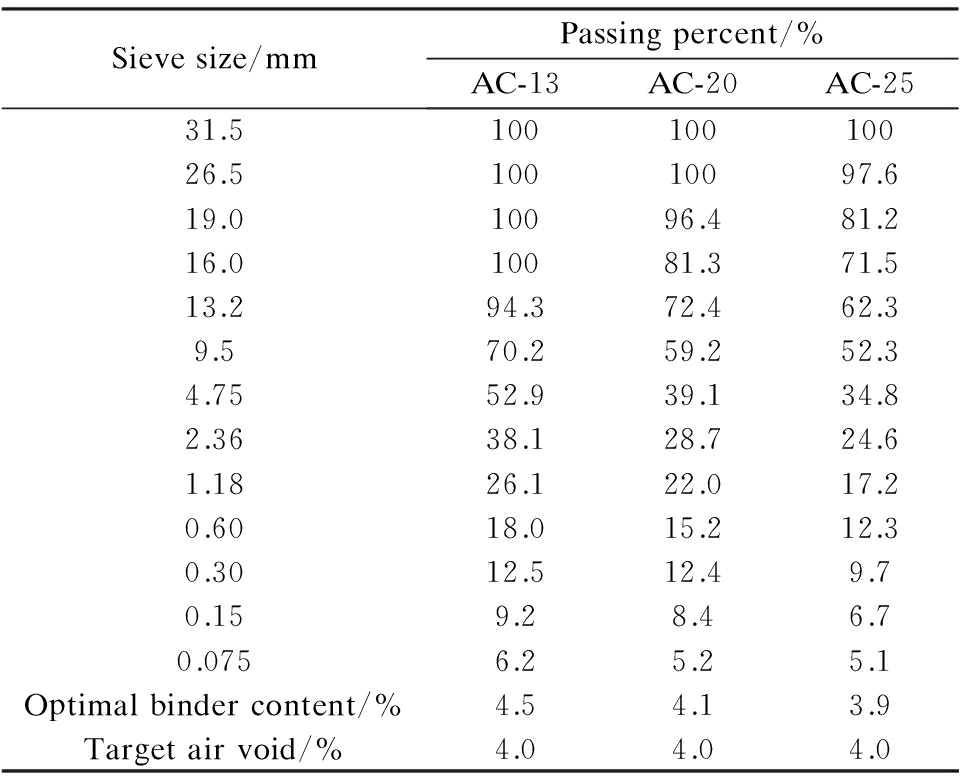
Sievesize/mmPassingpercent/%AC-13AC-20AC-2531.510010010026.510010097.619.010096.481.216.010081.371.513.294.372.462.39.570.259.252.34.7552.939.134.82.3638.128.724.61.1826.122.017.20.6018.015.212.30.3012.512.49.70.159.28.46.70.0756.25.25.1Optimalbindercontent/%4.54.13.9Targetairvoid/%4.04.04.0
All specimens tested in this experimental work were fabricated by a superpave gyratory compactor (SGC). For the IDT fatigue test, the SGC samples with 180 mm in height and 150 mm in diameter were produced first. Then the samples were cored and cut to obtain three replicated samples with the target size of 50 mm in height and 100 mm in diameter. The specimen preparation procedures can reduce the discrete among replicated samples. Besides, an air void level of 4% (±0.5%) was targeted for the final specimens.
2 Test Methods
2.1 DIC preparation
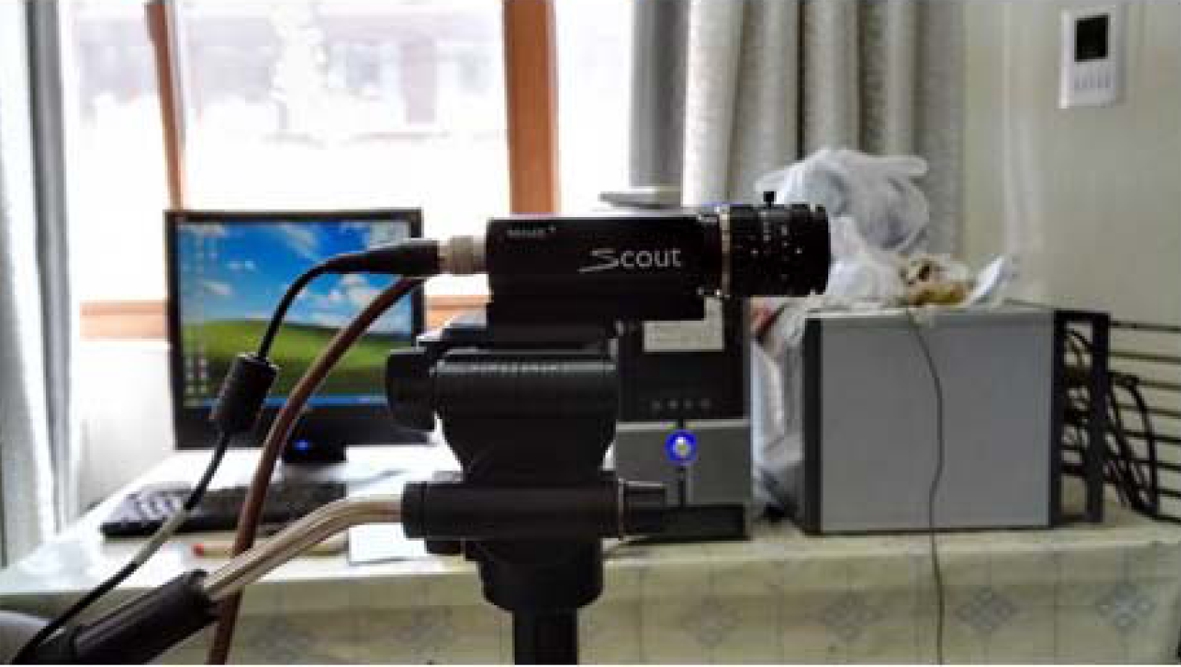
The DIC system was utilized to obtain the full-field displacements and strains of the front surface of specimens. Before the application of the DIC technique, a series of surface treatment on the specimens should be employed. As demonstrated in Fig.1, first, the front surface was cleaned and smoothed by sandpaper and airbrushes. Afterwards, the surface was painted uniformly matt white using a spray matt paint. Finally, random black dots were speckled onto the dried white surface of specimens using a spray matt black paint. This process of surface treatment provided a random and uniform speckle pattern on the specimen for capturing the full-field displacements or strains. Images of the treated front surfaces of the specimen during the IDT fatigue test were recorded by an industrial digital camera. The camera was placed carefully. The focus and the brightness were regulated elaborately to obtain a distinct image of the specimen and it was set to acquire 10 frames/s during the fatigue tests, which is the same as the frequency of the repeated load. Two white lights mounted on both the sides of the specimen were applied to improve the illumination effects. An image process software was used to analyze the displacements/strain field of the specimen. The Newton-Raphson method[15] was used as a sub-pixel registration algorithm in the displacement measurement. A numerical differentiation process was used to obtain the strain considering the noise contained in the computed displacement.
2.2 IDT fatigue test setups and conditions
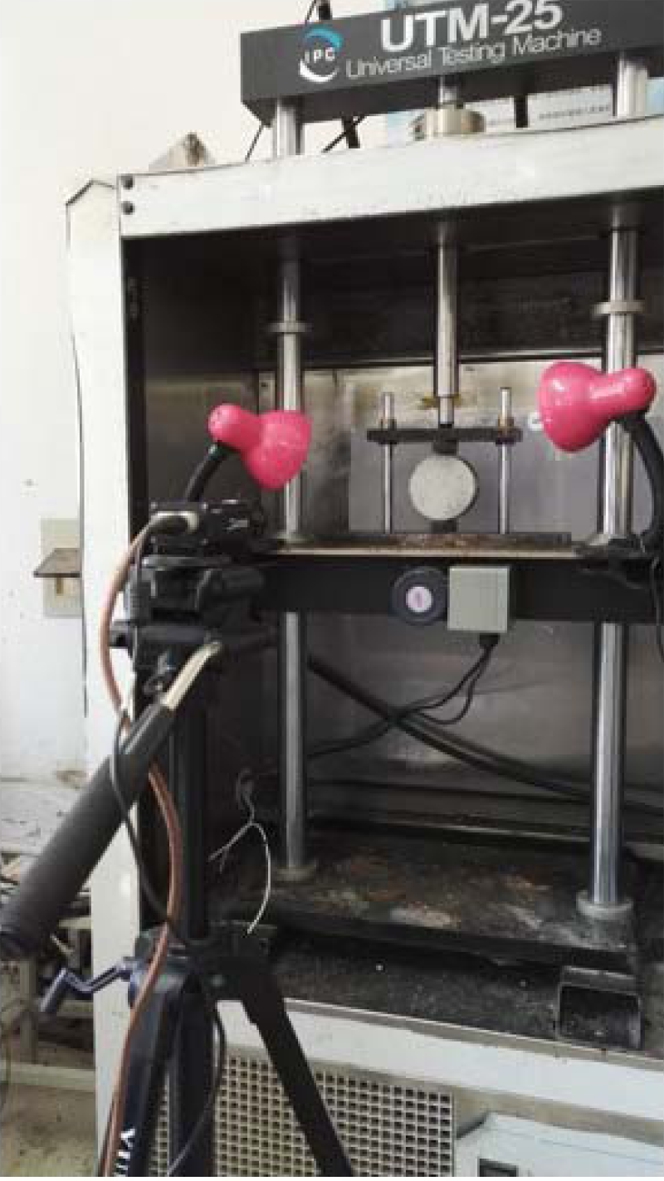
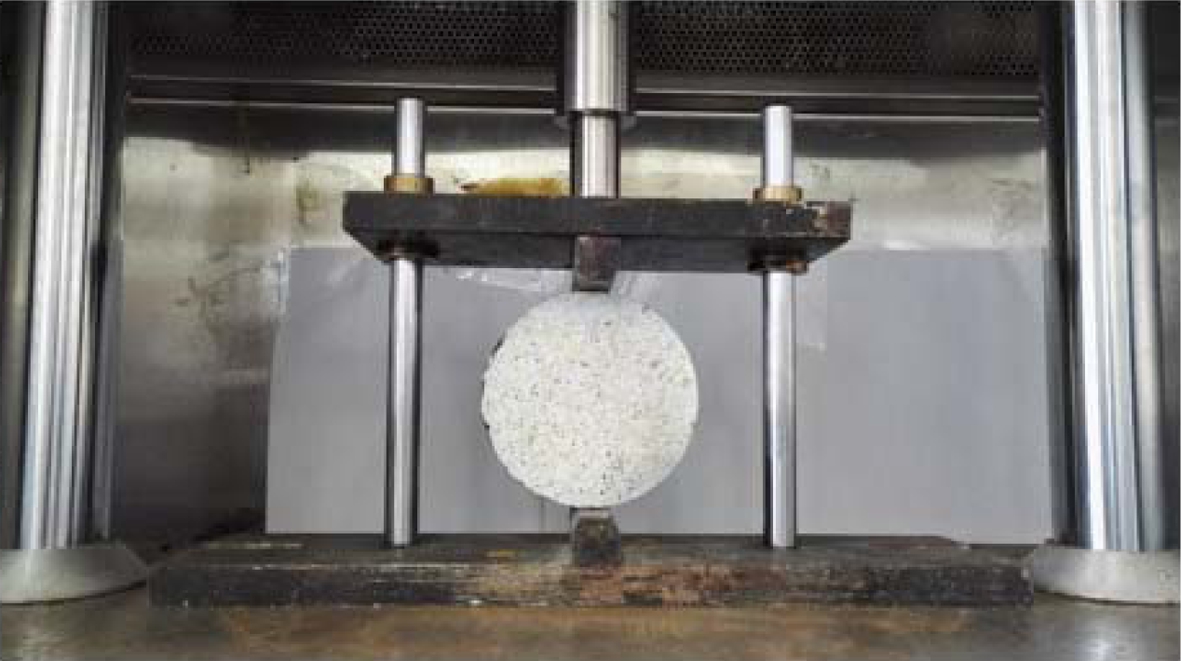
A UTM-25 universal testing machine was utilized for the IDT fatigue test at 15 ℃ for the HMA mixtures of AC-13, AC-20 and AC-25. Before the IDT fatigue test, three replicates in each group were tested to obtain their tensile strengths. In IDT tests, a constant displacement with a rate of 50 mm/min was applied on the specimen at 15 ℃ until failure. As seen from Fig.1, the setup for the IDT test and the IDT fatigue test consists of two loading rollers at the top edge and the bottom edge, respectively. The loading rollers should be vertically aligned. In this study, the stress-controlled mode was chosen for the IDT fatigue test. According to the obtained tensile strengths, stress amplitudes applied to the IDT fatigue tests were determined by the different stress ratios of 0.2, 0.3, 0.4 and 0.5. The stress levels were defined as the products of stress ratios and the tensile strength of specimens. The frequency of the repeated compressive load is 10 Hz, consisting of 0.1 s half-sine load and no rest period under different stress levels. Three replicated specimens were prepared for three HMA mixtures at each stress level. All specimens were placed in a thermostatic chamber for more than 4 h to reach the temperature of 15 ℃, since fatigue cracking typically occurs at intermediate temperatures and the local average temperature was 15 ℃. During the test, the vertical deformation of specimen was measured by LVDTs, which were installed in a vertical direction and
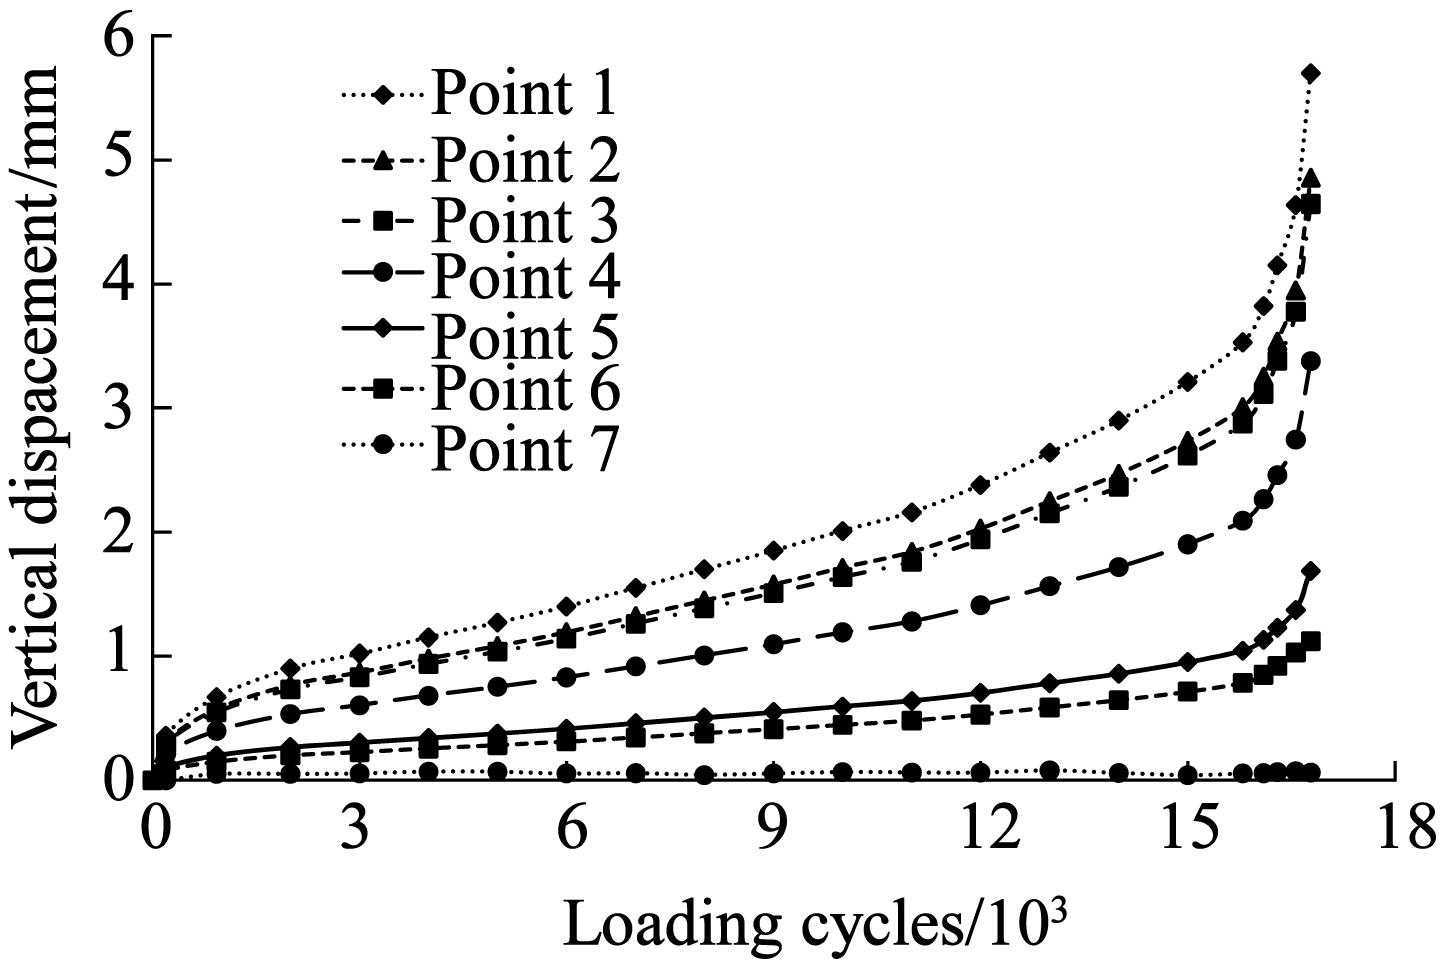
the images of the front surface of the specimens were captured by the DIC system. According to ASTM D4123, the indirect tensile strength in IDT test is calculated by
(1)
where ST is the indirect tensile strength in IDT test, MPa; P is the peak load at failure, N; D is the diameter of the specimen, mm; and t is thickness of specimen, mm.
3 Results and Analysis
3.1 Tensile strength
Three replicated samples of AC-13, AC-20 and AC-25 mixtures were employed in the IDT tests respectively to obtain the tensile strength of these three mixtures. The peak values of the vertical load vs. vertical displacement on specimens were recorded by the LVDTs. Tab.2 shows the tensile strengths calculated by Eq.(1) of three mixtures in IDT tests. It can be seen that the AC-13 mixture shows a higher indirect tensile strength than AC-20 and AC-25 mixtures, while the tensile strength of AC-20 is higher than that of AC-25 mixture. In general, the larger nominal maximum aggregate size for AC mixtures means weaker indirect tensile strength. Since the tensile strengths of each mixture differ, the stress amplitudes for varying mixtures are recommended to be determined by uniformed stress ratios (0.2, 0.3, 0.4 and 0.5) rather than some fixed stress values.
Tab.2 Distribution of the average vertical strains from point 1 to point 7
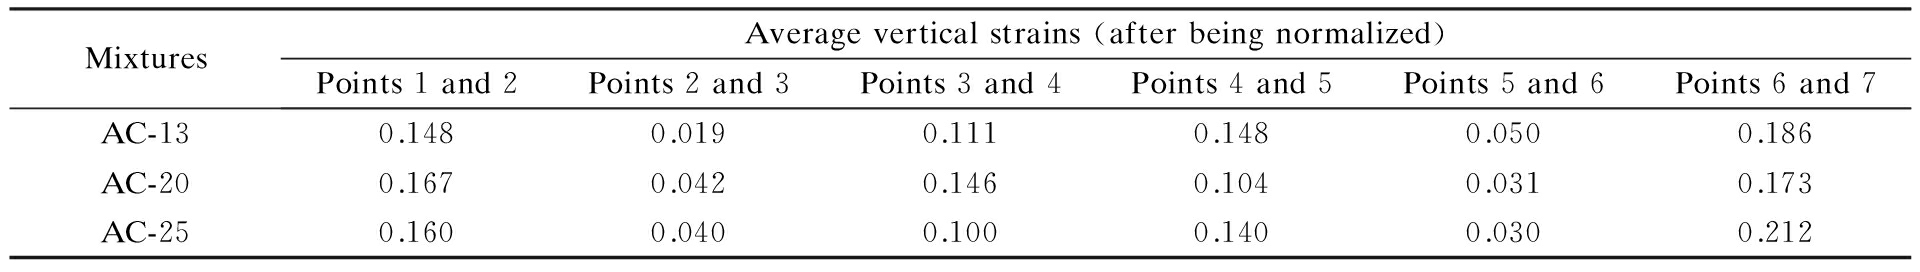
MixturesAverageverticalstrains(afterbeingnormalized)Points1and2Points2and3Points3and4Points4and5Points5and6Points6and7AC-130.1480.0190.1110.1480.0500.186AC-200.1670.0420.1460.1040.0310.173AC-250.1600.0400.1000.1400.0300.212
3.2 Analysis of vertical deformation
The vertical deformations of specimens can not only be recorded by LVDTs during the IDT fatigue test, but also can be calculated by the acquired images of the front surface of specimens from the DIC system.
3.2.1 Accuracy of DIC system
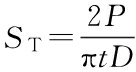
To verify the accuracy of the DIC system in the IDT fatigue test, the vertical displacement estimated by the DIC system from the target on the surface of the loading roller was compared with the measured results from an externally mounted LVDT. The resolution of the images acquired by the DIC system was 0.137 mm/pixel in this study. The verification was performed in the IDT fatigue test for all the three mixtures at a stress level of 0.2. As shown in Fig.2, the variation tendency of the vertical displacement measured by the DIC system and LVDT are the same and the values estimated by the DIC system are a little less than those estimated by LVDT, which may be caused by the slight deformation of the mold. The errors between the estimated and measured vertical displacement values are 0.099, 0.147 and 0.088 mm for the AC-13 mixture, AC-20 mixture and AC-25 mixture, respectively, which is less than 0.1% of the IDT fatigue test. It can be safely concluded that the DIC system can be applied successfully in collecting correct displacement/strain data during the IDT fatigue tests.
3.2.2 Vertical deformation from DIC technique
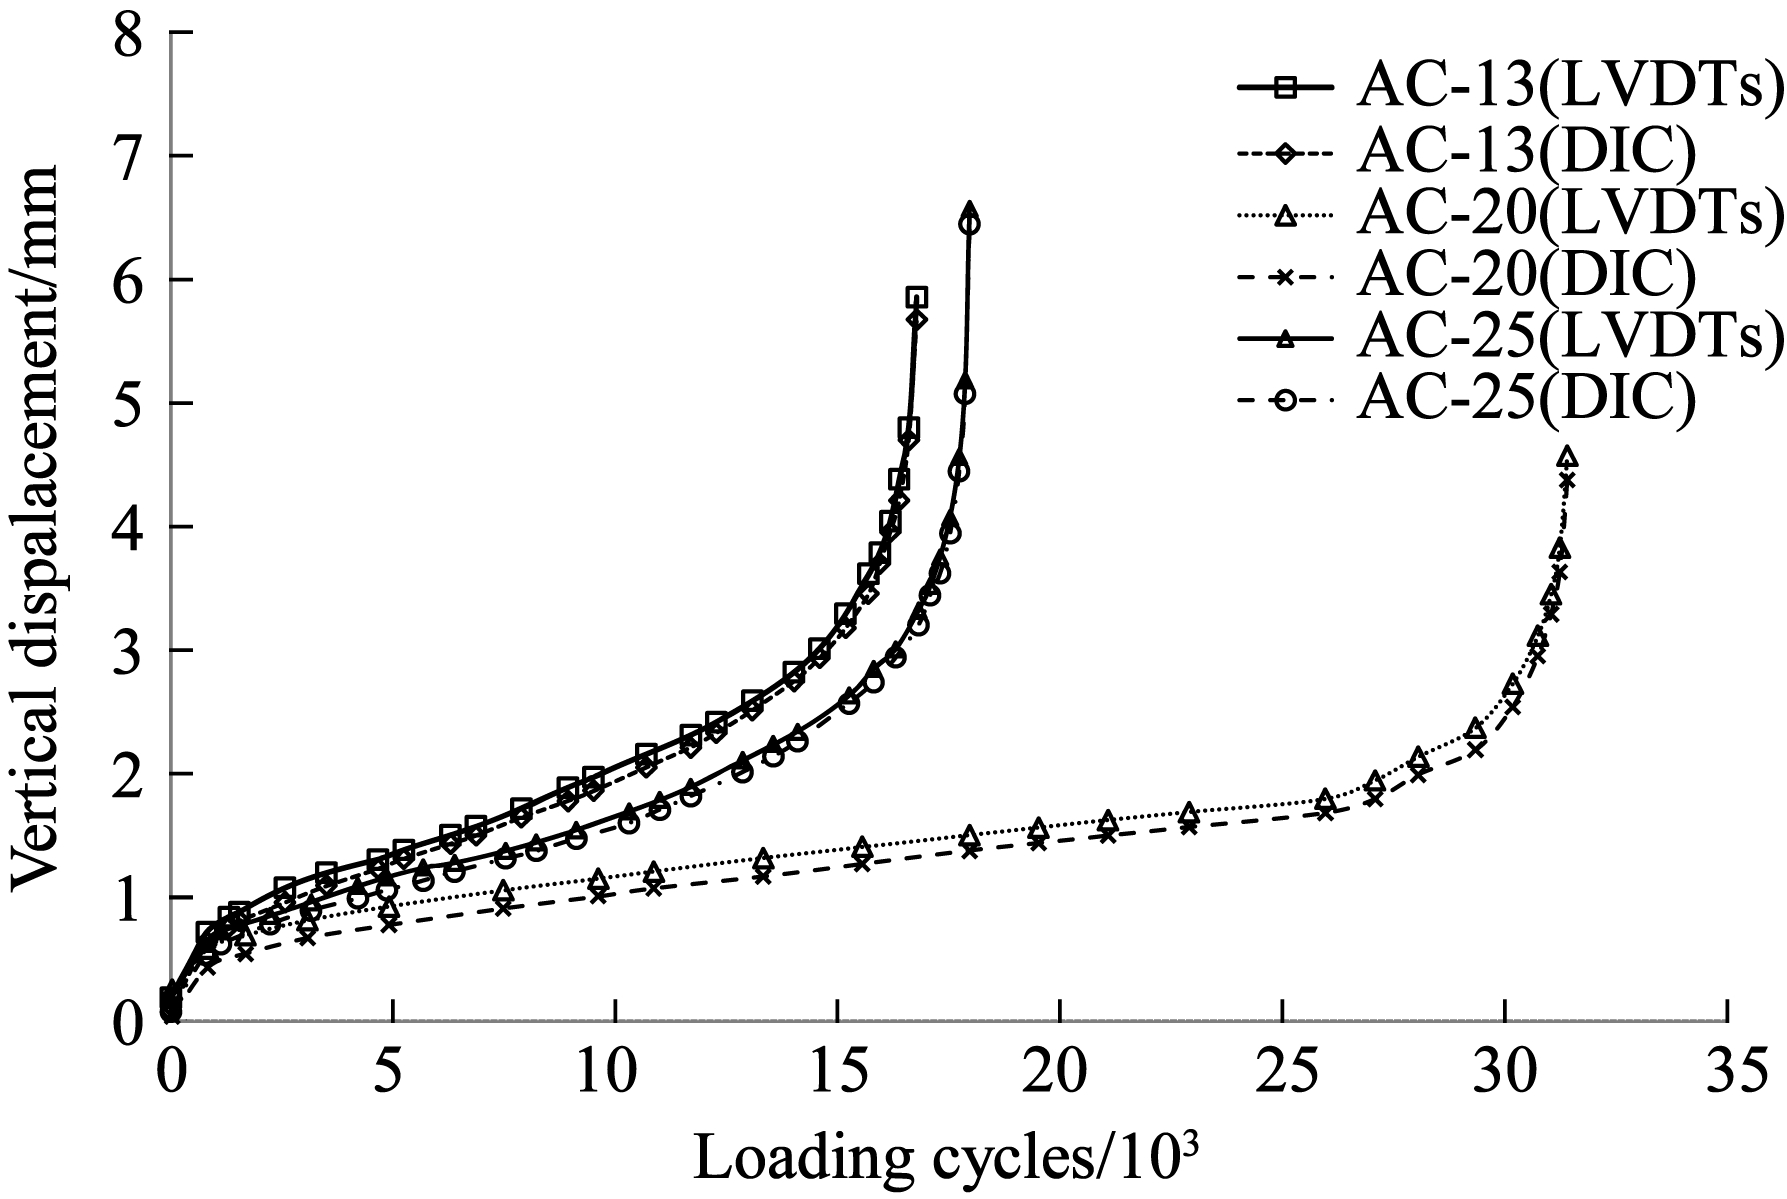
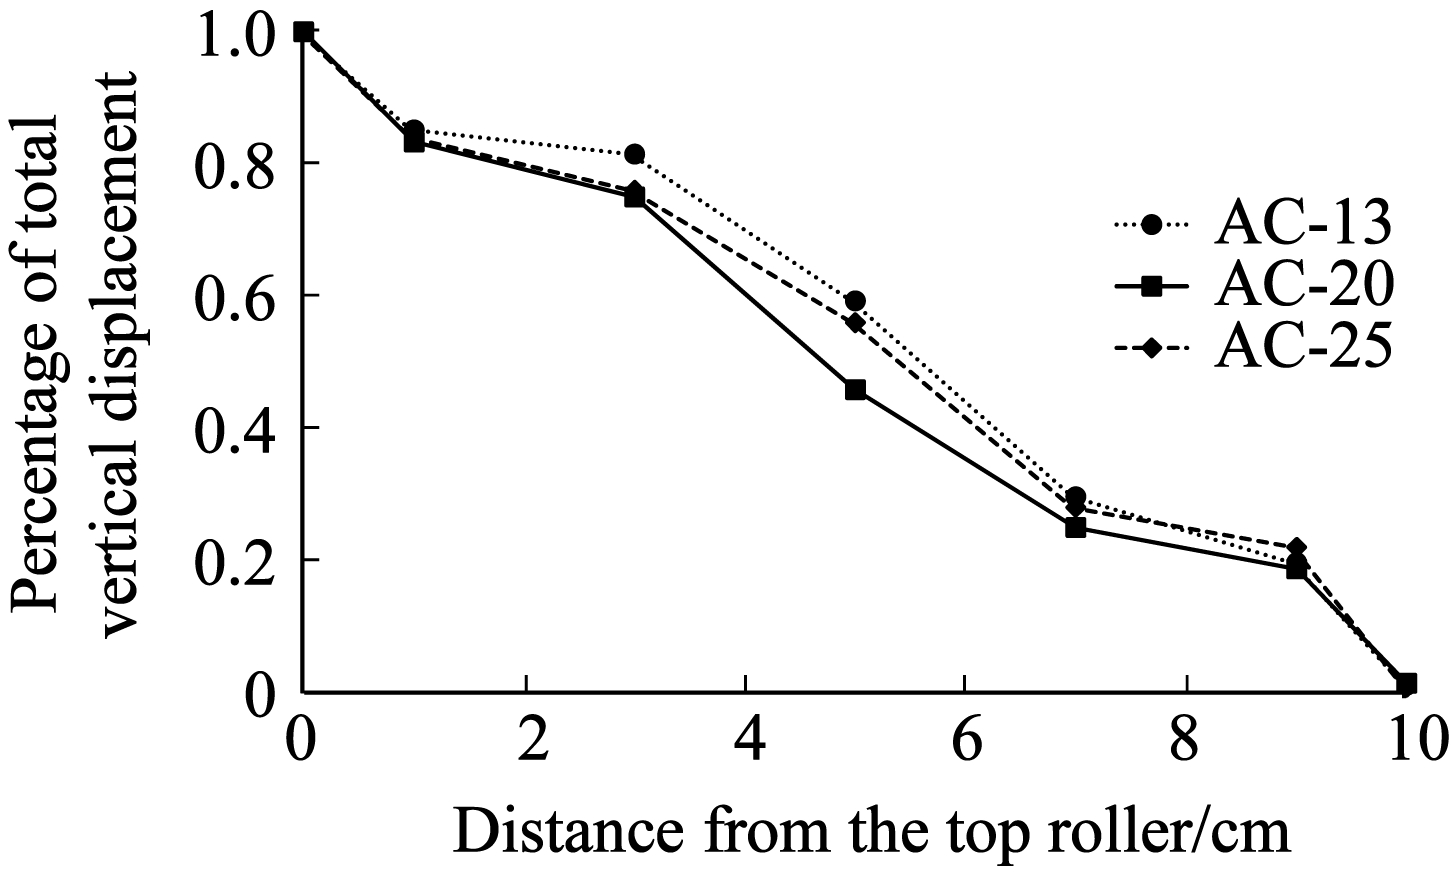
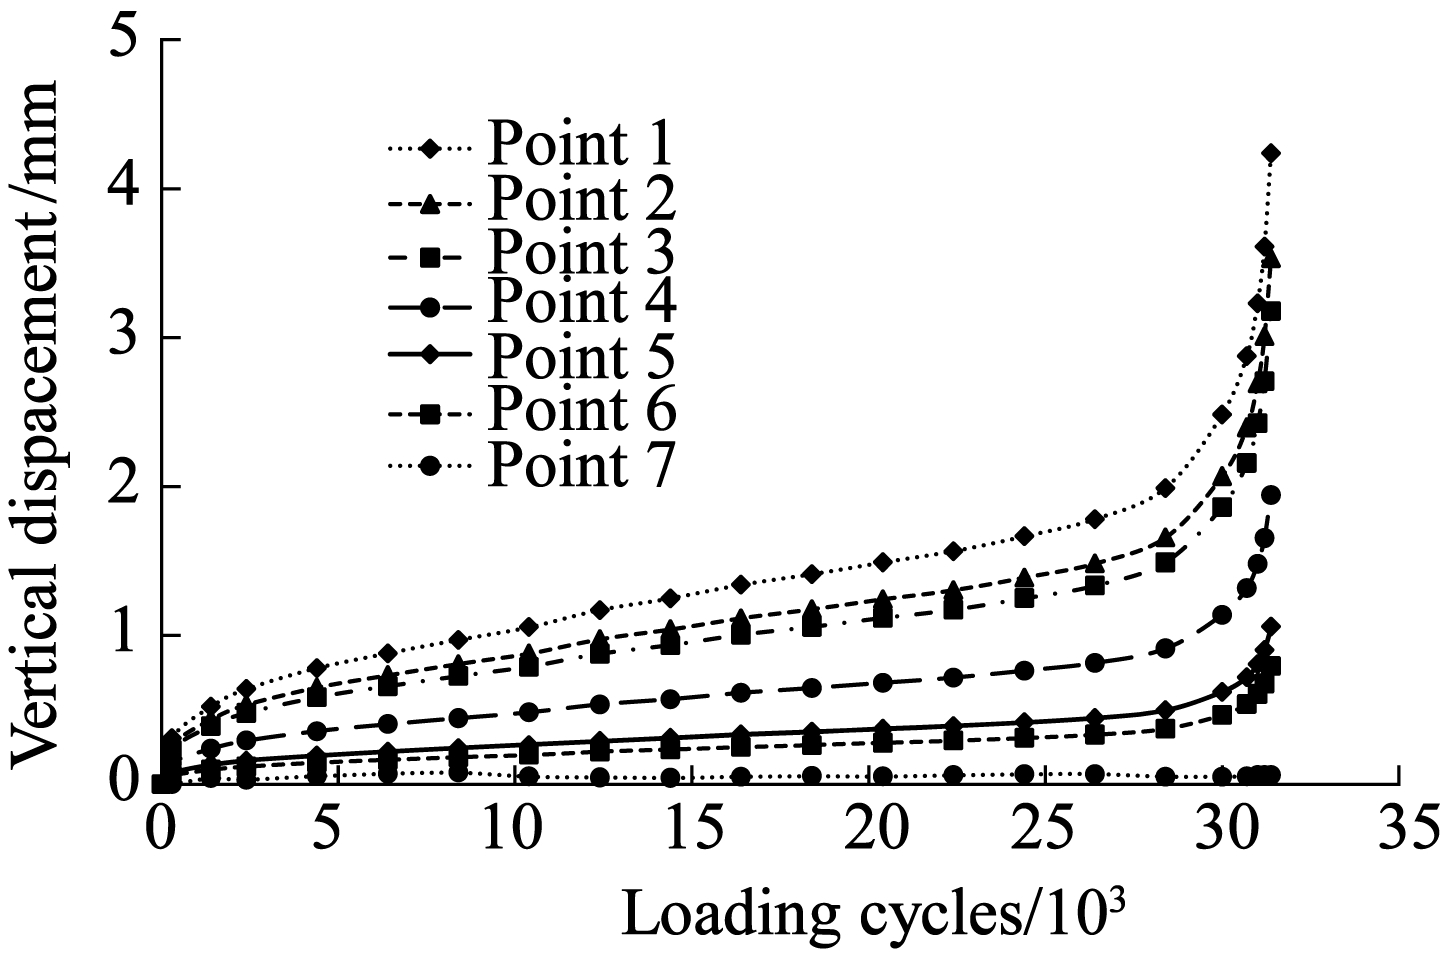
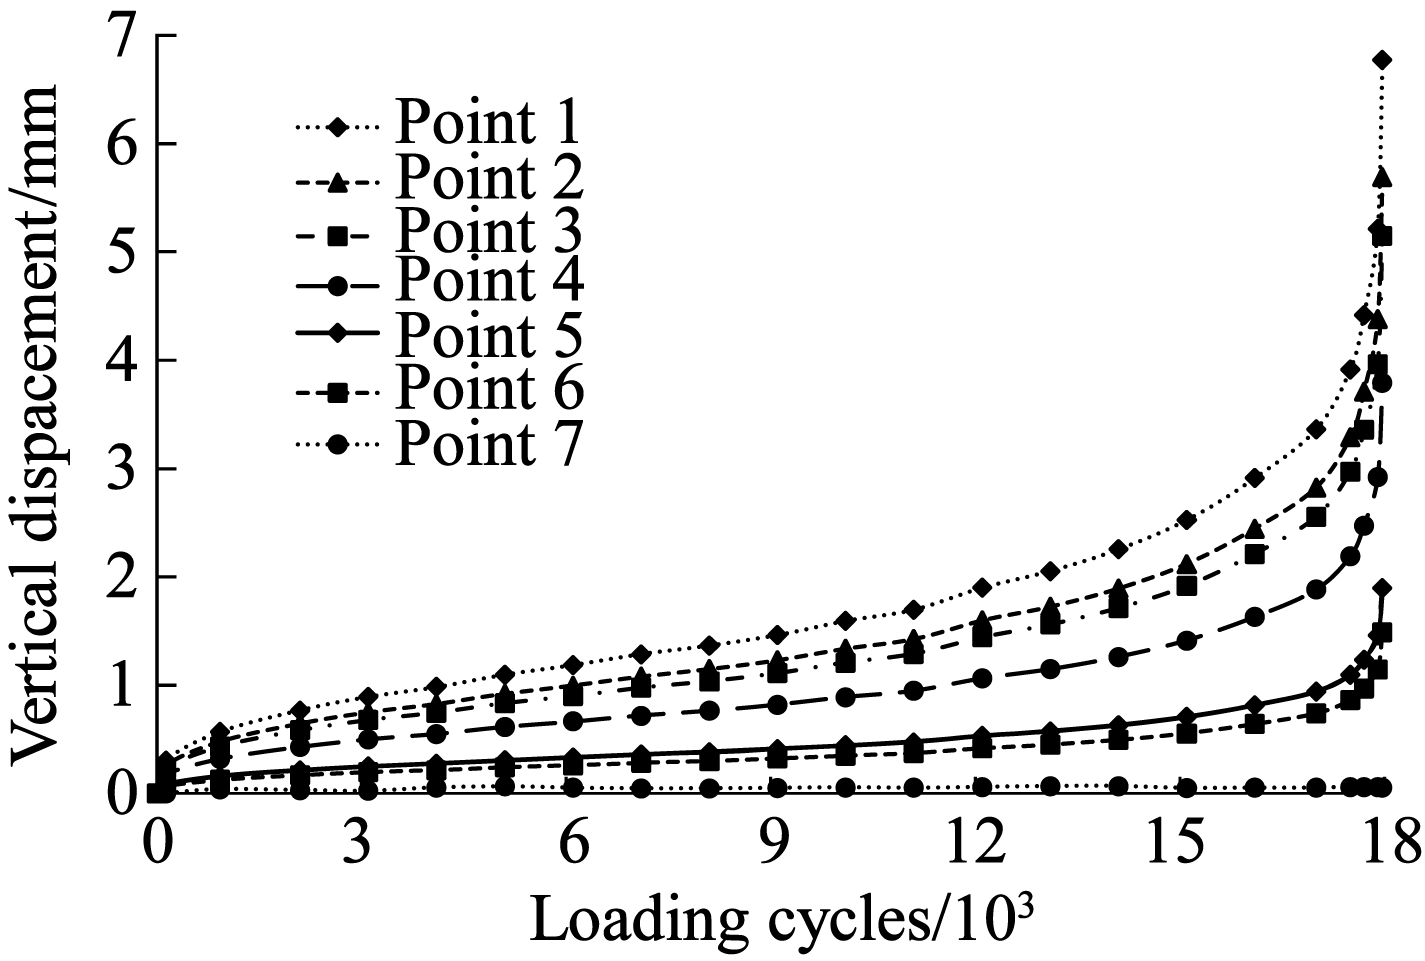
Based on the DIC system, a full-field displacement can be calculated by analyzing the acquired images during IDT fatigue tests. The DIC technique provided the possibility of measurement of any particular point in the front surface of specimens. In this study, as described in Fig.3(a), seven points in the vertical direction of the front surface of specimens with varying distances from the top loading roller were selected to uncover more information about the vertical deformation of specimens during the IDT fatigue tests. Seven points were named as points 1, 2, 3, 4, 5, 6 and 7 with the distances of 0, 1, 3, 5, 7, 9 and 10 cm from the top roller, respectively. The analysis was conducted in the IDT fatigue tests for three mixtures at a stress level of 0.2. Figs.3(b) to (d) demonstrate the rules of vertically compressive deformation for AC-13, AC-20 and AC-25, respectively. The deflections of several points decrease with the increase of the distance from the top loading roller, which indicates that the compression occurs in each interval between any two points. LVDT can only acquire the vertical displacement of point 1 while the DIC system can estimate each point in the vertical direction. The vertical displacement curves of each mixture display an S shape with different maximum values. To better compare the deformation rule among different mixtures, the vertical displacement at point 1 is normalized to 1 (100%) and defined as the total vertical displacement. The proportions of the vertical displacements for the following six points and the vertical displacement of point 1 are illustrated in Fig.3(a). It is observed that the decreasing speed from point 1 to point 2, point 3 to point 5 and point 6 to point 7 is extremely high for all the mixtures while the decreasing trend is slow from point 3 to point 4 and point 5 to point 6. The slopes of the percentages of the total vertical deformation vs. distances from the top loading roller indicate the average vertical strains between two adjacent points. It can be seen from Fig.3(a) and Tab.2 that the average vertical strains near the top loading roller (between points 1 and 2) and bottom loading roller (between points 6 and 7) are three times the average strain between point 3 and point 4 and point 5 and point 6, respectively. This suggests that the local deflection near the loading point is too large (nearly 40% of the total vertical displacement) to ignore. Furthermore, the local deflection in the IDT fatigue tests was caused by localized stress concentration, which has less influence on the tensile stress near the center of the specimens. Besides, the average vertical strains near the center of the specimens (from point 3 to point 5) are double that of the sub-center of specimens between points 2 and 3 and between points 5 and 6, and the relative vertical displacements along point 3 to point 5 is nearly 60% of the total vertical displacement. So, it can be concluded that the vertical deformation from point 3 to point 5 is the main reason causing the tensile stress or fatigue damage to specimens.
3.3 Analysis of tensile strain based on DIC system
The tensile strain of specimens can be calculated by the images of the front surface of specimens acquired from the DIC system. Corresponding to the vertical deformation curve, the tensile strain curve can also be regarded as the fatigue curve of the asphalt mixtures and more valuable information about the fatigue performance can be obtained from the curve.
3.3.1 Determination of cracking zone
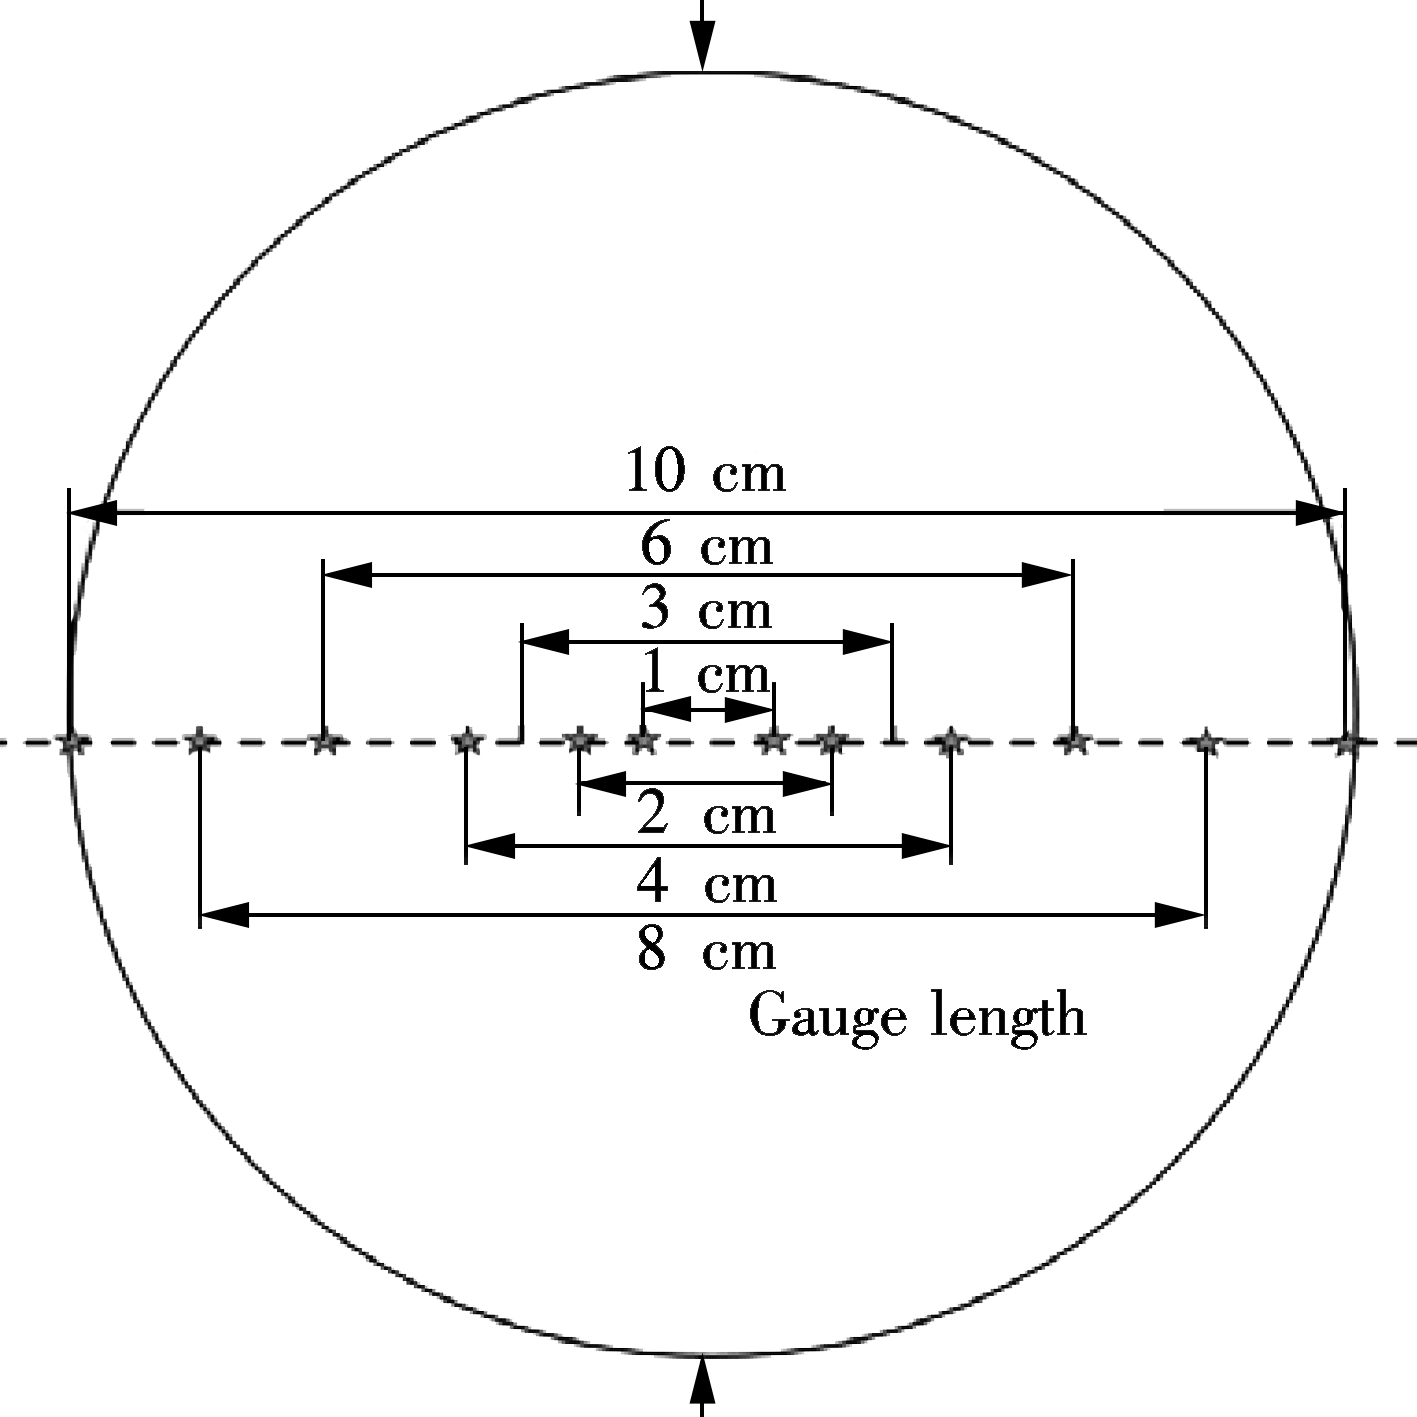
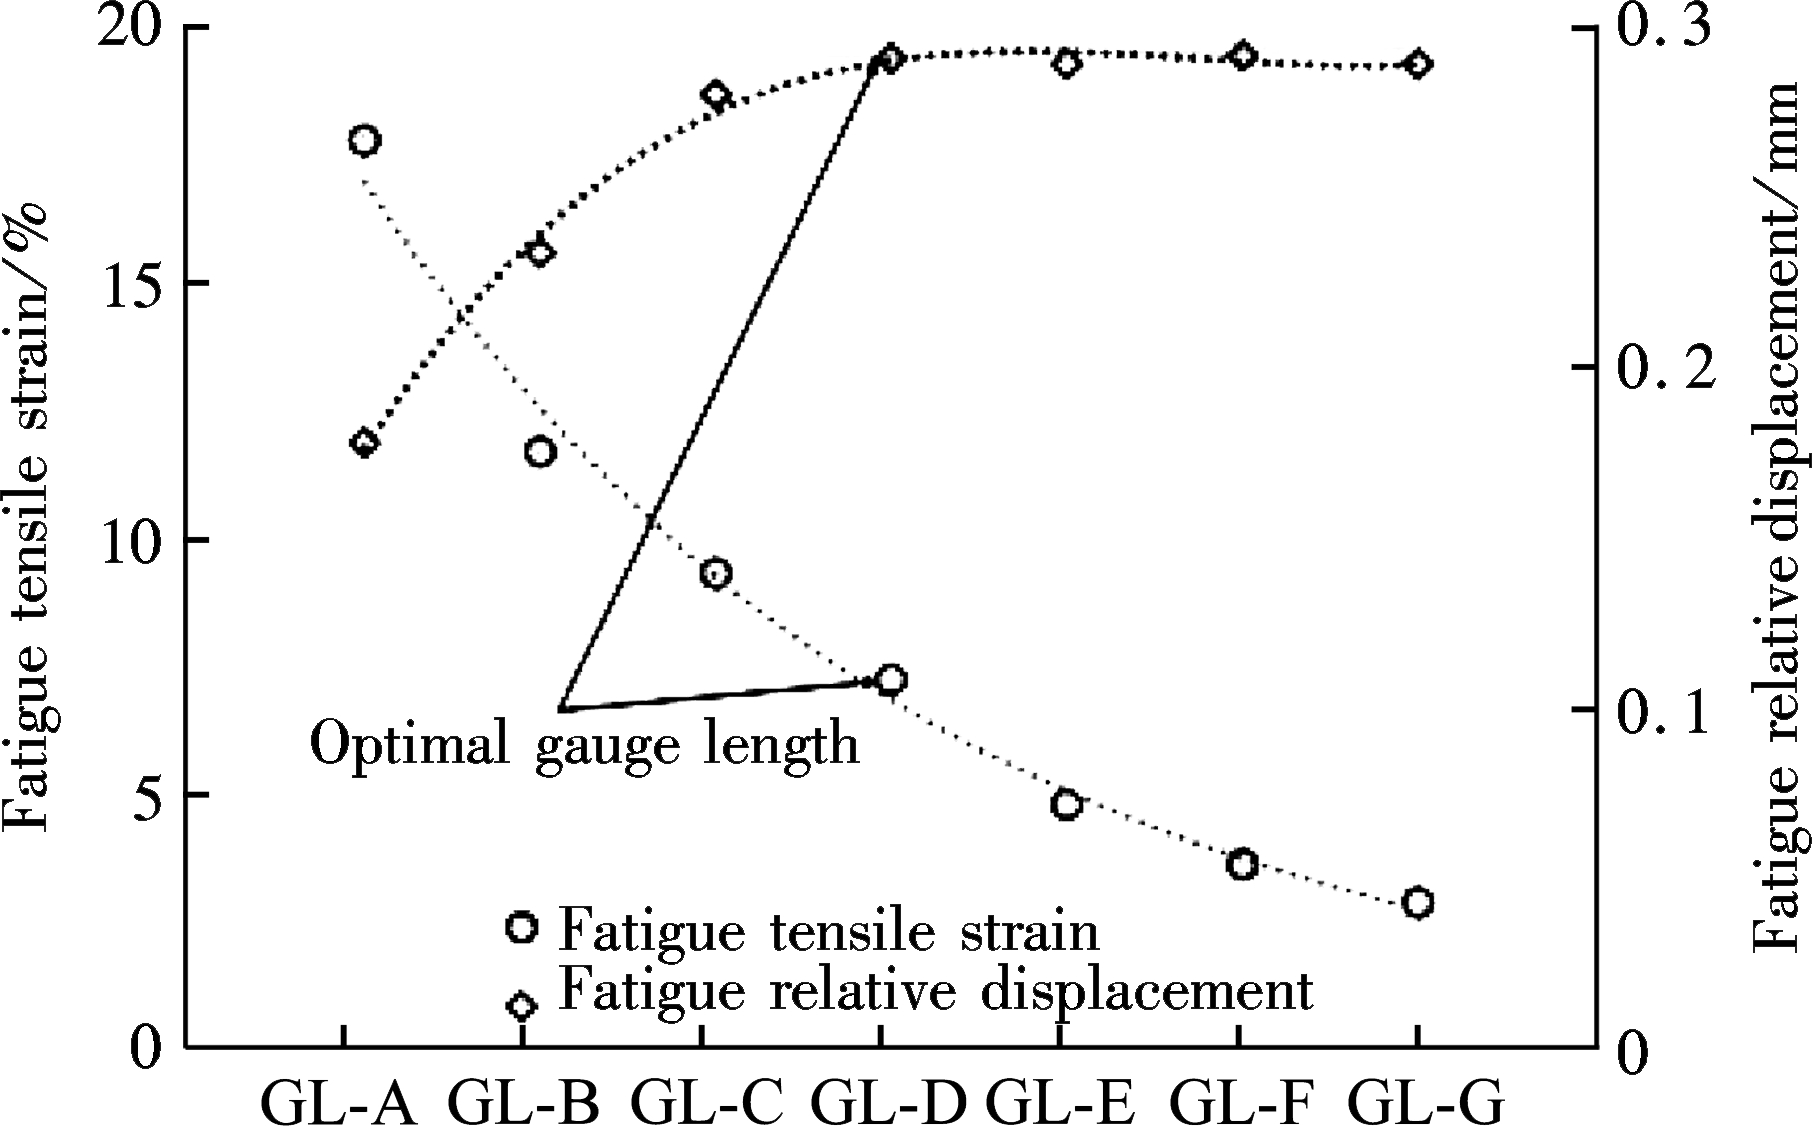
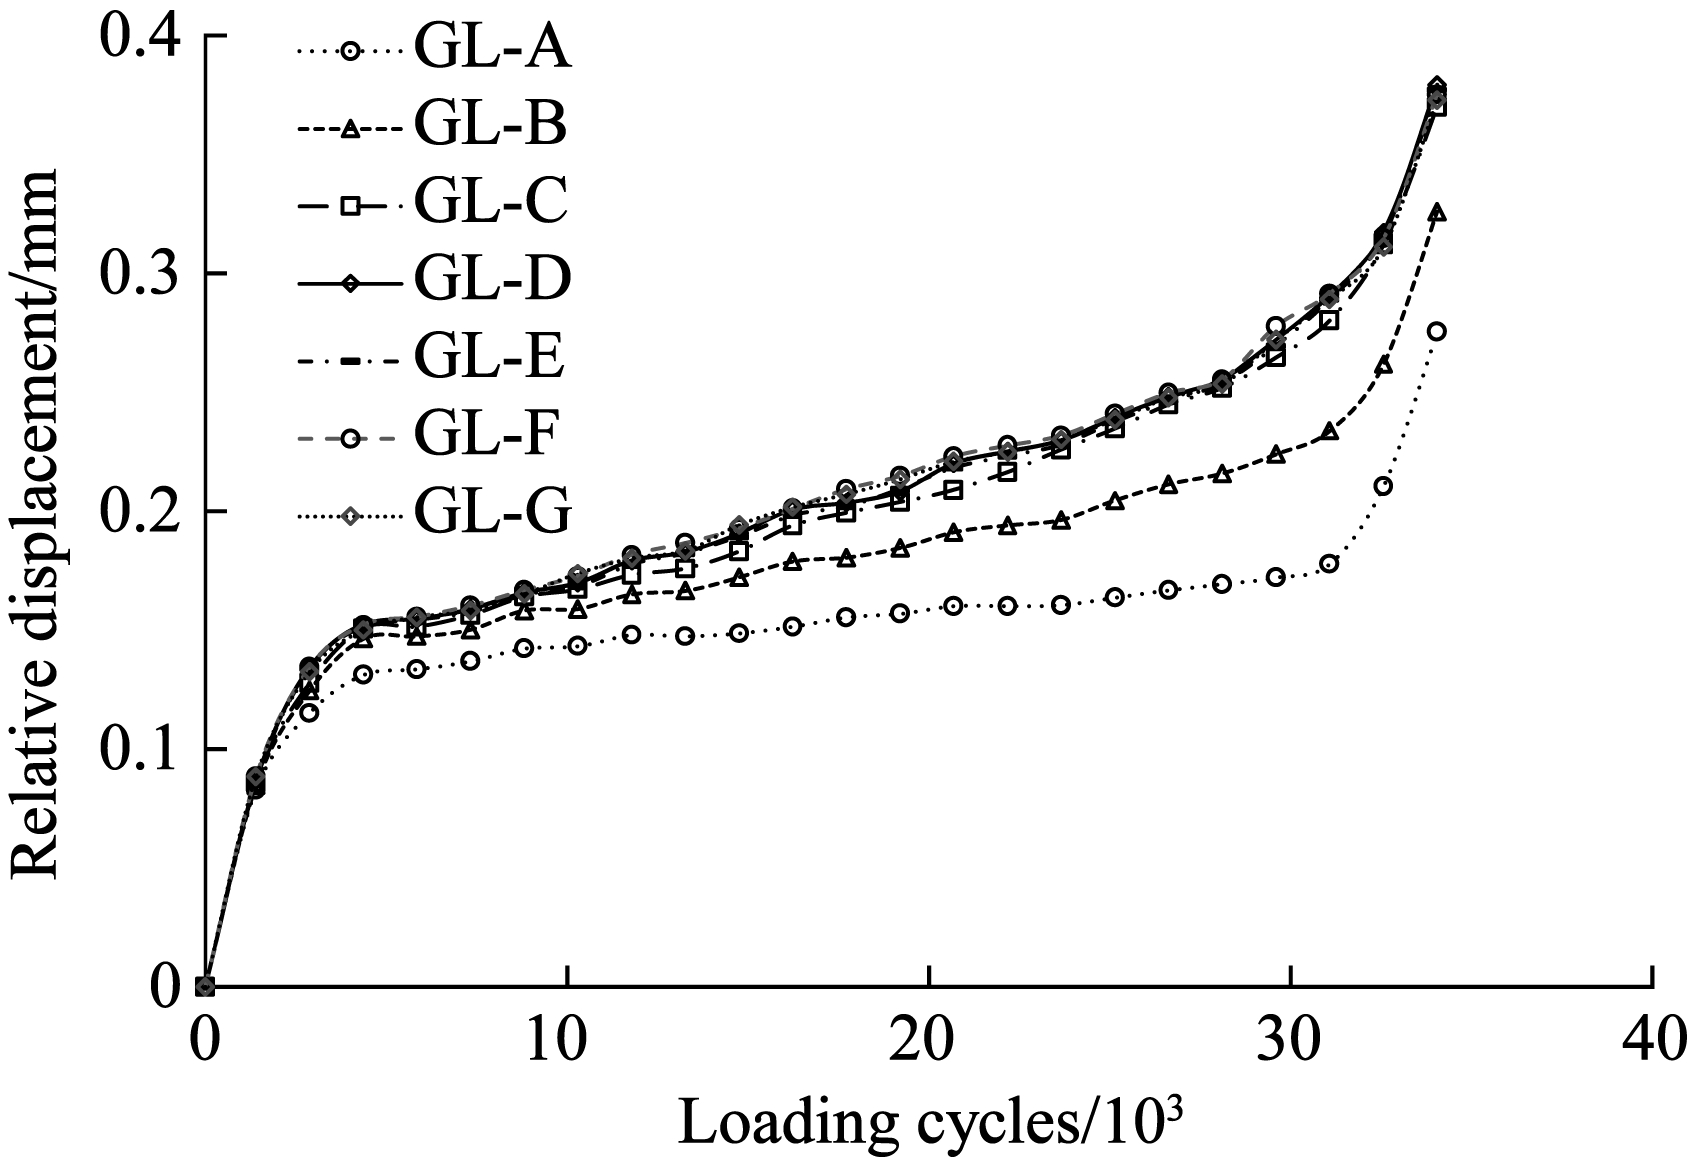
In the horizontal direction, the tensile strain was varying. Since the DIC system can estimate the full field displacement/strain of specimens, Fig.4(a) gives the seven selected gauge lengths in the center of specimens. The seven gauge lengths were 1, 2, 3, 4, 6, 8 and 10 cm (named as GL-A, GL-B, GL-C, GL-D, GL-E, GL-F and GL-G, respectively). To investigate the distribution of the tensile strain in the center of specimens, the DIC system is utilized to obtain the relative displacement and the tensile strain for the AC-20 mixture at a stress level of 0.2 within each gauge length during the IDT fatigue tests. The results of relative displacements are illustrated in Fig.5. It is clear that the relative displacement curves also exhibit an S shape as the vertical displacement curves for each gauge length with different values. The increasing rate of relative displacements decreases with time during the primary stage, which is approximately constant during the second stage, and increases during the third stage. With reference to the traditional vertical deformation curve[16], the second deflection point was termed the failure point. The relative displacement at the failure point was defined as the failure relative displacement and the tensile strain at failure point was defined as the failure tensile strain. The circle dotted line in Fig.4(a) illustrates that the tensile strain calculated by different gauge lengths decreases from GL-A to GL-G. This indicates that the distribution of tensile strain in horizontal direction is not uniform and the tensile strain near the center of specimens is extremely large. So, it is necessary to determine an optimal gauge length to describe the average tensile strain in the center of specimens during IDT fatigue tests. Fig.4(b) demonstrates that the relative displacements increase first sharply and then slowly from GL-A to GL-G, and GL-D, representing the gauge length of 4 cm, is the critical point. After GL-D the relative displacement is nearly constant, which indicates that most of the horizontal displacement occurs in the range of GL-D and the outer parts are mainly rigid-body displacement with few tension. As a result, the optimal gauge length was determined to be 4 cm in the center of the specimens. According to the analysis of vertical deformation, the vertical deformation and tensile strain mainly occurred in a 40 mm×40 mm rectangle in the middle of the specimens.
3.3.2 Fatigue curve and life prediction
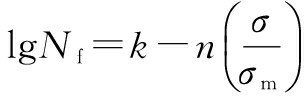
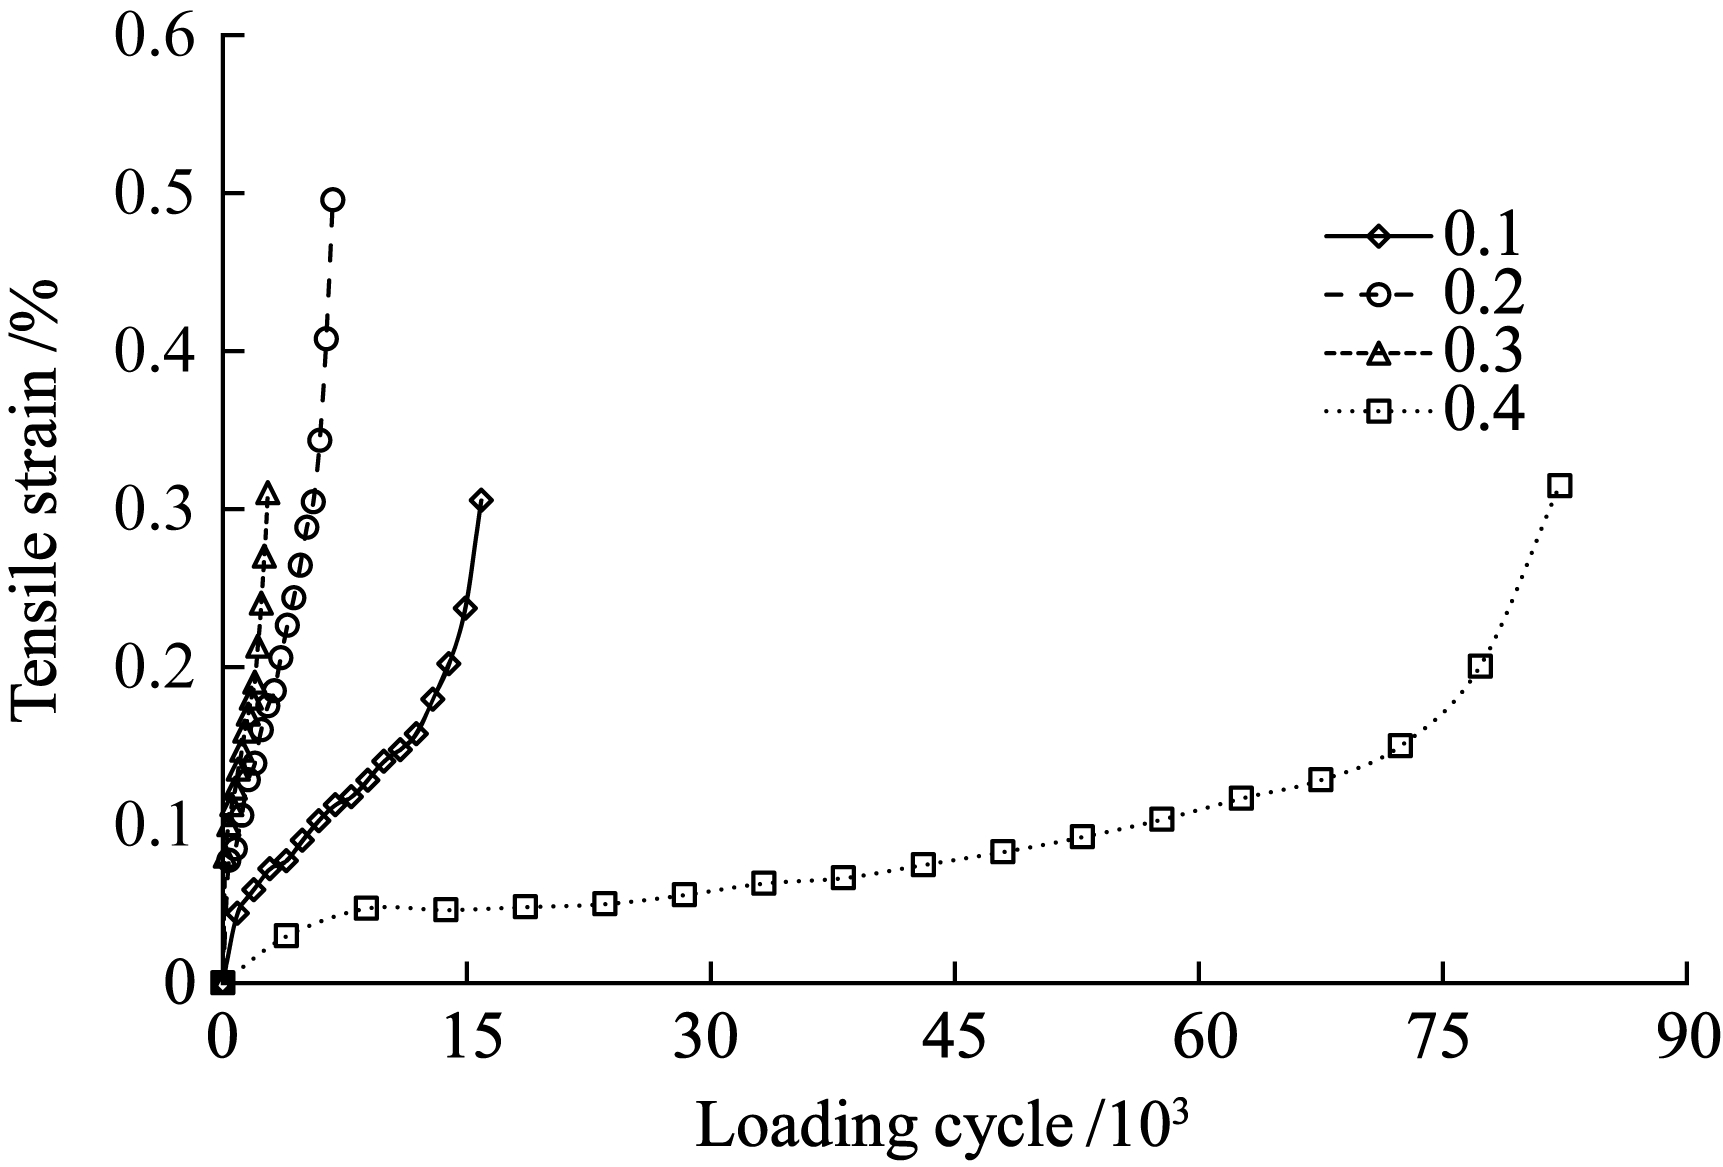
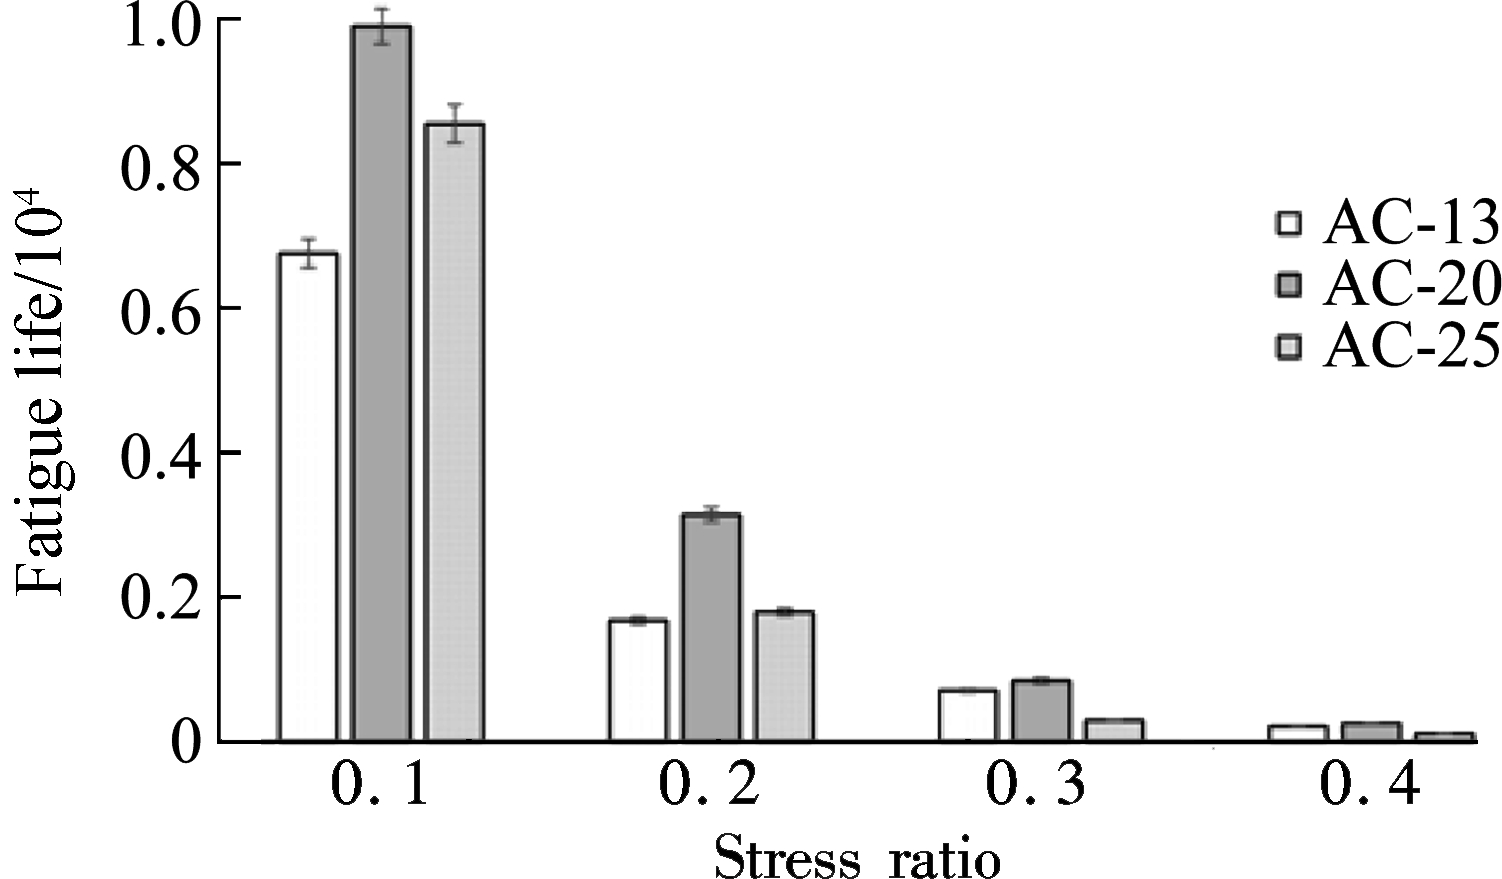
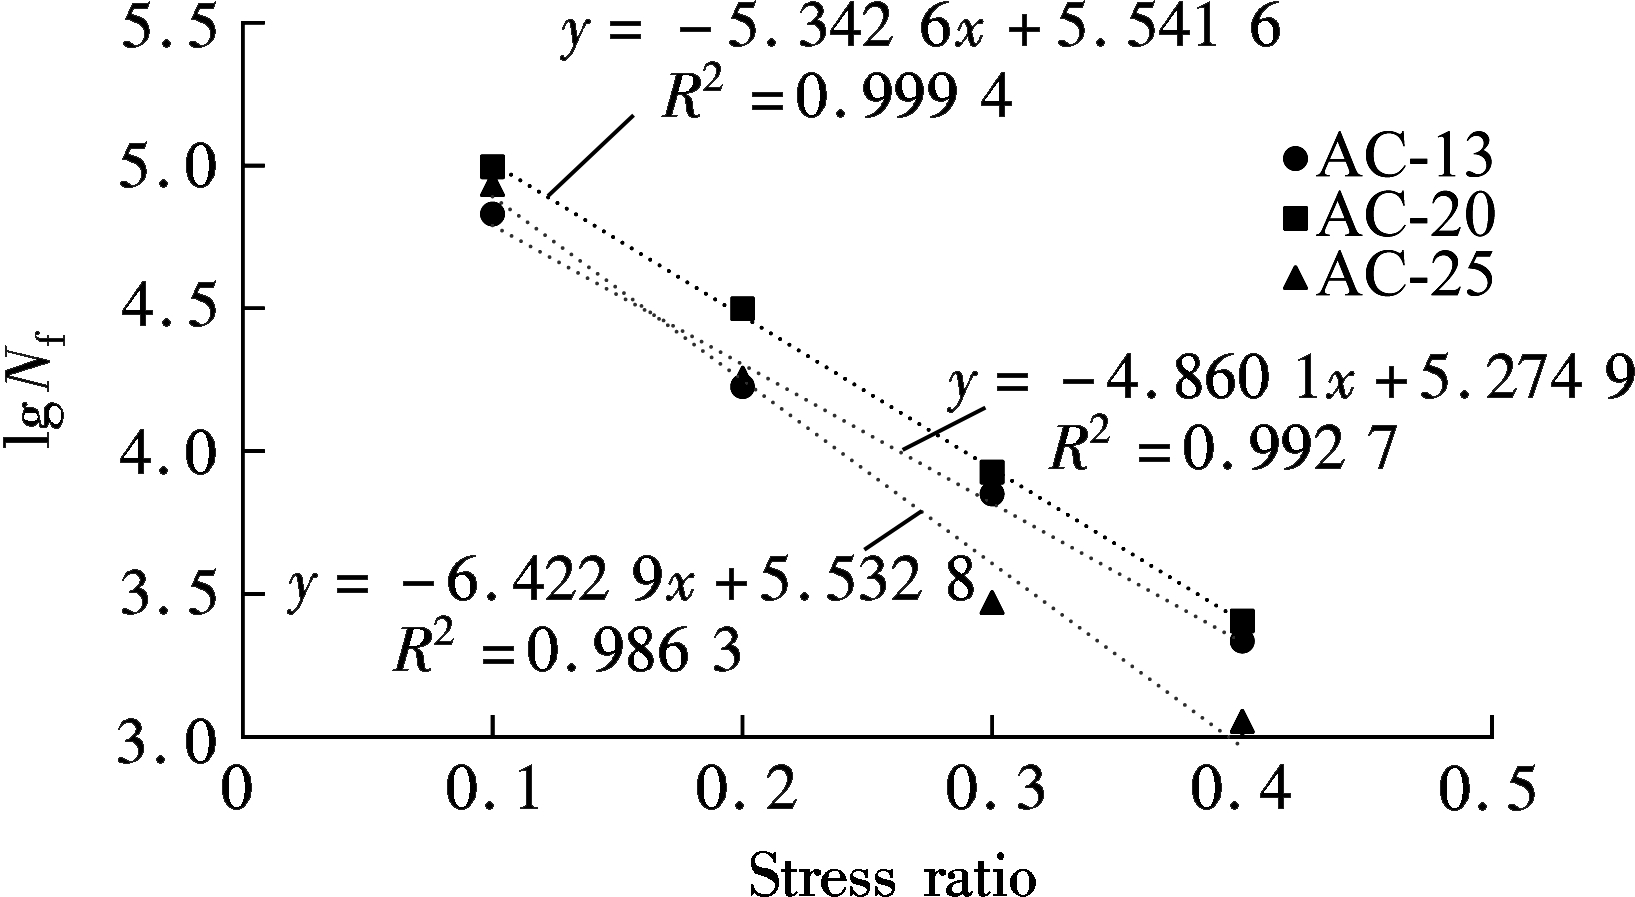
The fatigue curve of the tensile strain in IDT fatigue tests shows a three-stage characteristic. During the first stage, the tensile strain increases sharply under repeated load with an increase of stiffness. The initial crack (or damage) occurs at the end of this stage. During the second stage, the fatigue curve shows a linear increase rule, which means that the development speed of the micro-cracks is constant. During the third stage, the tensile strain increases exponentially until fatigue failure of the specimens. As exhibited in Fig.6, there are two inflection points in the fatigue curve of tensile strain for asphalt mixtures. The second inflection point is termed the fatigue failure point, and the fatigue life is defined as the loading cycles at the failure point. The fatigue life of three HMA mixtures at several stress levels of 0.1, 0.2, 0.3 and 0.4 are illustrated in Fig.7(a) and Tab.3. It can be found that the fatigue life of AC-20 at each stress level is the highest and that AC-25 shows a longer fatigue life than AC-13 at low stress levels of 0.1 and 0.2 while AC-13 can resist the repeated load better than AC-25 at high stress levels of 0.3 and 0.4. The relationship between the fatigue life and stress level was not linear. The semi-logarithmic and double-logarithmic functions were two commonly used egression functions for fitting the relationship between the fatigue life and stress levels according to previous studies[17]. Also, a semi-logarithmic function is utilized as follows:
(2)
where Nf is the fatigue life; σ is the stress amplitude, MPa; σm is the indirect tensile strength, MPa; k and n are the regression parameters.
The results of fatigue life prediction equations for three mixtures in the IDT fatigue tests were summarized in Fig.7(b). Since the tensile strength of different mixtures is different, to better compare the fatigue performance of all mixtures, the stress levels rather than the stress amplitudes
were included to describe the fitting equations. The R-squared values obtained by Eq.(2) are greater than 0.98 for all test conditions. The higher absolute value of the slope of fatigue life prediction equation illustrates that the fatigue life is more sensitive to the stress levels. It is found that the slopes of AC-13 mixture, AC-20 mixture and AC-25 mixture are -4.860 1,-5.342 6 and -6.422 9, respectively, which means that the fatigue life of AC-25 mixture has a high susceptibility to the change of stress ratios. This also corresponds to the phenomenon that AC-25 exhibits good resistance to fatigue damage at the low stress levels of 0.1 and 0.2, but it comes to fatigue failure soon at high stress levels of 0.3 or 0.4. By comparing the AC-13 mixture and AC-20 mixture, it can be concluded that the AC-20 mixture has longer fatigue life and a faster decline with the increase in stress levels. The fatigue life of AC-13 mixture is nearly the same as that of AC-20 at a stress level of 0.4, and the AC-13 mixture shows the worst fatigue performance at a stress level of 0.1. So, the AC-13 mixture has a better potential for fatigue resistance at high stress levels (more than 0.4) than the AC-20 mixture or AC-25 mixture.
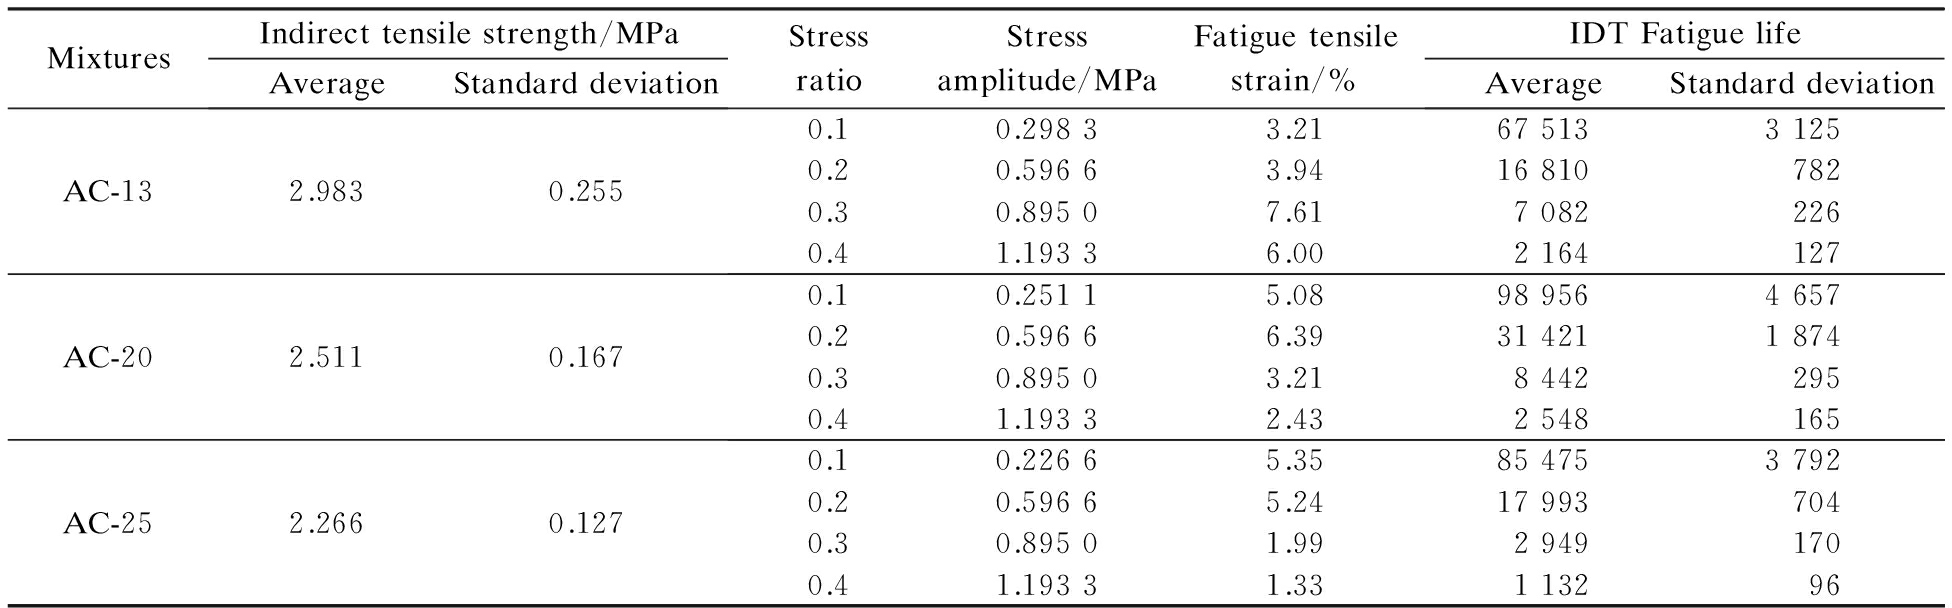
MixturesIndirecttensilestrength/MPaAverageStandarddeviationStressratioStressamplitude/MPaFatiguetensilestrain/%IDTFatiguelifeAverageStandarddeviationAC-132.9830.2550.10.29833.216751331250.20.59663.94168107820.30.89507.6170822260.41.19336.002164127AC-202.5110.1670.10.25115.089895646570.20.59666.393142118740.30.89503.2184422950.41.19332.432548165AC-252.2660.1270.10.22665.358547537920.20.59665.24179937040.30.89501.9929491700.41.19331.33113296
4 Conclusions
1) The local deformation near the loading points in IDT fatigue tests occupied nearly 40% of the total vertical deflection, and the main vertical deformation, contributing to the tensile strain in the center of specimens, occurs in the middle area of the vertical axis of specimens from point 3 to point 5.
2) The tensile strain distributes non-uniformly in the horizontal direction and exhibits an extremely large value in the center of specimens. By comparing the relative displacements of several gauge lengths during the IDT fatigue tests, it is found that most of the horizontal displacement occurs in the range of GL-D (a 4 cm long gauge) and the outer parts are mainly rigid-body displacement with few tensions. So, the optimal gauge length is determined to be 4 cm in length in the middle of specimens for the IDT fatigue tests.
3) The fatigue curve of tensile strain in the IDT fatigue tests exhibits a three-phase characteristic and the fatigue life can be derived from the tensile strain curve. AC-20 shows the longest fatigue life at each stress level. AC-25 can resist the fatigue damage at a low stress level (0.1 or 0.2) which is better than AC-13, while AC-13 performs better than AC-25 at a high stress level (0.3 or 0.4).
[1]Kim J, Koh C. Development of a predictive system for estimating fatigue life of asphalt mixtures using the indirect tensile test [J]. Journal of Transportation Engineering, 2012, 138(12): 1530-1540. DOI:10.1061/(asce)te.1943-5436.0000452.
[2]Yang J, Wang H, Liao H. Key influential factors of fatigue and self-healing properties of asphalt mixture[J]. Journal of Southeast University (English Edition). 2016, 46(1): 196-201.
[3]Wang C, Castorena C, Zhang J, et al. Unified failure criterion for asphalt binder under cyclic fatigue loading[J]. Road Materials and Pavement Design, 2015, 16(sup2): 125-148. DOI:10.1080/14680629.2015.1077010.
[4]Bahadori A M, Mansourkhaki A, Ameri M. A phenomenological fatigue performance model of asphalt mixtures based on fracture energy density [J]. Journal of Testing and Evaluation, 2014, 43(1): 133-139. DOI:10.1520/jte20130057.
[5]Saha G, Biligiri K P. Fracture properties of asphalt mixtures using semi-circular bending test: A state-of-the-art review and future research [J]. Construction and Building Materials, 2016, 105: 103-112. DOI:10.1016/j.conbuildmat.2015.12.046.
[6]Wagoner M P, Buttlar W G, Paulino G H. Development of a single-edge notched beam test for asphalt concrete mixtures [J]. Journal of Testing and Evaluation, 2005, 33(6): 452-460. DOI: 10.1520/JTE12579.
[7]Yang P, Zhang X N, Liu X W. Study on simplified test method about fatigue performance of cold patch asphalt mixtures[J].Key Engineering Materials, 2010, 417-418: 493-496.
[8]Nguyen M T, Lee H J, Baek J. Fatigue analysis of asphalt concrete under indirect tensile mode of loading using crack images [J]. Journal of Testing and Evaluation, 2012, 41(1): 148-158. DOI: 10.1520/JTE104589.
[9]Masad E, Castelo Branco V T F, Little D N, et al. A unified method for the analysis of controlled-strain and controlled-stress fatigue testing [J]. International Journal of Pavement Engineering, 2008, 9(4): 233-246. DOI:10.1080/10298430701551219.
[10]Im S, Kim Y R, Ban H. Rate-and temperature-dependent fracture characteristics of asphaltic paving mixtures [J]. Journal of Testing and Evaluation, 2013, 41(2): 257-268. DOI: 10.1520/JTE20120174.
[11]Shen S, Lu X. Energy based laboratory fatigue failure criteria for asphalt materials [J]. Journal of Testing and Evaluation, 2010, 39(3): 313-320. DOI: 10.1520/JTE103088.
[12]Zhang J, Sabouri M, Guddati M N, et al. Development of a failure criterion for asphalt mixtures under fatigue loading [J]. Road Materials and Pavement Design, 2013, 14(sup2): 1-15. DOI:10.1080/14680629.2013.812843.
[13]Gao L, Ni F, Braham A, et al. Mixed-mode cracking behavior of cold recycled mixes with emulsion using Arcan configuration [J]. Construction and Building Materials, 2014, 55: 415-422. DOI:10.1016/j.conbuildmat.2013.12.079.
[14]Birgisson B, Montepara A, Romeo E, et al. An optical strain measurement system for asphalt mixtures [J]. Materials and Structures, 2009, 42(4): 427-441. DOI:10.1617/s11527-008-9392-8.
[15]Tan Y, Hou M, Zhang L, et al. Studying the strain field distribution of asphalt mixture with the digital speckle correlation method [J]. Road Materials and Pavement Design, 2014, 15(1): 90-101. DOI:10.1080/14680629.2013.863159.
[16]Wu H, Huang B, Shu X. Characterizing fatigue behavior of asphalt mixtures utilizing loaded wheel tester [J]. Journal of Materials in Civil Engineering, 2013, 26(1): 152-159. DOI:10.1061/(asce)mt.1943-5533.0000791.
[17]Li Q, Lee H J, Kim T W. A simple fatigue performance model of asphalt mixtures based on fracture energy [J]. Construction and Building Materials, 2012, 27(1): 605-611. DOI:10.1016/j.conbuildmat.2011.07.001.
References:
基于数字图像相关方法的沥青混合料疲劳性能研究
蒋继望 倪富健
(东南大学交通学院,南京210096)
摘要:为研究间接拉伸疲劳试验过程中试件中部拉应变的发展规律,选择3种不同最大公称粒径的热拌沥青混合料在4种不同应力比下进行间接拉伸疲劳试验,并采用数字图像相关方法,通过工业相机记录散斑位置随时间的变化,分析疲劳试验过程中试件表面的应变/位移场.试验结果表明,由于压头位置局部应变较大,竖向位移曲线不能准确评价混合料的疲劳性能;基于竖向及横向应变场的分析,定义间接拉伸疲劳试验的最佳疲劳开裂区域为试件中部40 mm×40 mm的方形区域;基于DIC方法可获取试件底部中间的拉应变曲线并建立疲劳方程,从而可以进行沥青混合料疲劳寿命预估.
关键词:沥青混合料;疲劳行为;数字图像相关方法;间接拉伸疲劳试验
中图分类号:U214
Received:2016-08-31.
Citation::Jiang Jiwang, Ni Fujian. Evaluation of fatigue property of asphalt mixtures based on digital image correlation method[J].Journal of Southeast University (English Edition),2017,33(2):216-223.
DOI:10.3969/j.issn.1003-7985.2017.02.015.
DOI:10.3969/j.issn.1003-7985.2017.02.015
Biographies:Jiang Jiwang(1992—),male, graduate; Ni Fujian (corresponding author), male, doctor, professor, nifujian@gmail.com.