
Abstract:In order to analyze the initial cracking behavior of highway embankment in the regions of expansive soil, the changes in peaks of tensile stress and their location on top of the embankment for a typical highway embankment section were simulated by ABAQUS. The simulation results indicate that the matric suction was a concave distribution on top of the expansive soil foundation and that it induced differential deformation of foundation and embankment.The peaks of tensile stress on top of the embankment are not located at a fixed site, but gradually move towards the shoulder following the evaporation duration. When the evaporation intensity is larger, the peak of tensile stress on top of embankment increases at a faster rate following the evaporation duration, and its location is closer to the shoulder. The thicker expansive soil layer helps the peaks of tensile stress to reach the critical tensile stress quickly, but the embankment cannot crack when the expansive soil layer is no more than 1.5 m after 30 d soil surface evaporation; the higher the embankment, the smaller the peak of tensile stress occurring on top of the highway embankment, and its location will be further away from the shoulder. Therefore, a higher embankment constructed on a thinner expansive soil layer can reduce the crack generation within the highway embankment.
Key words:expansive soil foundation; soil shrinkage; consolidation; tensile stress; embankment cracks
Soil shrinkage and associated desiccation cracks are common problems for infrastructures constructed on expansive soils[1]. Nonexpansive soil highway embankments constructed on an expansive soil foundation are also affected by its shrink behavior[2]. There is evidence to show that the failure rates of nonexpansive soil embankment failures are directly related to the shrink/swell potential of the foundation soils and the wet-dry cycles[3]. Zhang[4] stated that moisture change in expansive soils created horizontal and vertical movements of the soil structure, which can potentially cause tensile stress in the structures constructed on expansive soils. Embankment soil cracks generate when the tensile stress in the embankment caused by foundation soil shrinkage exceeds critical tensile stress in a long period of drought after heavy rainfalls, which can weaken the soil structure and provide efficient pathways for rain infiltration[5-6]. As a result, the shear strength of the soil drops significantly and slope failure occurs eventually.
During the past several decades, many researchers conducted ample studies on the geometric shape and depth of soil cracks through experimental, theoretical and numerical methods[7-11]. Most of these studies focused on the influence of the water loss on soil cracks[12]. With the aid of discrete element codes, Sima et al.[13]and Peron et al.[14] analyzed the soil crack mechanisms of a thin clay layer, as well as the crack pattern that formed. Based on the concept of moisture change stress, Wu et al.[15]proposed the critical value of moisture change for soil crack and calculated the depth of initial cracking. However, much of the previous research on soil cracks has focused on expansive soil fabric. The influence of the shrink/swell behavior of the expansive soil foundation on the nonexpansive soil highway embankment has received relatively less attention.
Considering the influence of expansive soil shrinkage on embankment cracks, a numerical model of soil crack mechanisms is proposed to assess the effect of moisture change and soil shrinkage on the embankment cracks. The model used in this paper is based on the two-dimensional deformation of embankment soil fabric caused by the change in tensile stress. The model is applied to estimate the variation of the peaks of tensile stress and their location when the boundary and spatial conditions have changed.
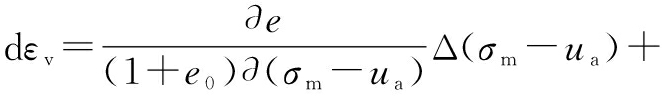
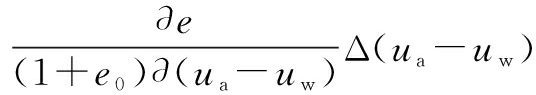
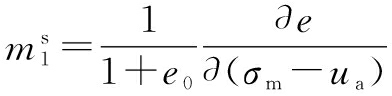
The constitutive relations for volume change of unsaturated soils are proposed using the matric suction and mean mechanical stress as stress variables as follows[16]:
(1)

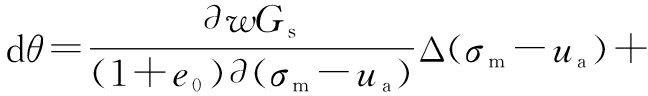
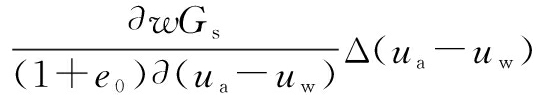
(2)
where dεv is the volumetric strain of the soil structure; dθ is the change in volumetric water content; σm is the mean net normal stress; ua is the pore air pressure; uw is the pore water pressure; (σm-ua) is the mean mechanical stress; (ua-uw) is the matric suction; ![]() is the coefficient of volume change of the soil structure relative to changes in mechanical stress;
is the coefficient of volume change of the soil structure relative to changes in mechanical stress; ![]() is the coefficient of volume change of the soil structure relative to changes in matric suction;
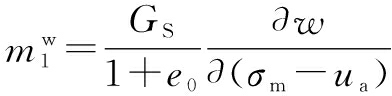
is the coefficient of volume change of the soil structure relative to changes in matric suction; ![]() is the coefficient of pore-water volume change relative to changes in mechanical stress;
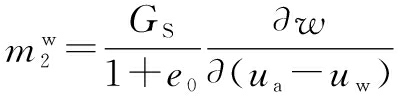
is the coefficient of pore-water volume change relative to changes in mechanical stress; ![]() is the coefficient of pore-water volume change relative to changes in matric suction.
is the coefficient of pore-water volume change relative to changes in matric suction.
The mathematical descriptions for the void ratio constitutive surface and water content constitutive surface can be rewritten as
e=f(σm-ua ,ua-uw)
(3)
wGs=g(σm-ua ,ua-uw)
(4)
where e is the void ratio; w is the water content; Gs is the specific gravity of the soil; f and g are the arbitrary functions.
The volumetric strain of the unsaturated soil and the volumetric water content change are
(5)
(6)
Comparing all above equations, the coefficients in Eq.(1) and Eq.(2) can be obtained.
(7)

(8)
(9)
(10)
The movement of water in saturated soils is described by Darcy’s law which states that
q=ki
(11)
where q is the specific discharge; k is the hydraulic conductivity; i is the gradient of the total hydraulic head.
Darcy’s law is also applied to the movement of water in unsaturated soils. However, the hydraulic conductivity of the unsaturated soils is not a constant and it varies with the change in matric suction.
Considering that the water in soils is not compressible, the continuity equation of the fluid phase is actually the equation of the soil water mass conversation. The continuity equation for the two-dimensional seepage in unsaturated soils is Richard’s equation:
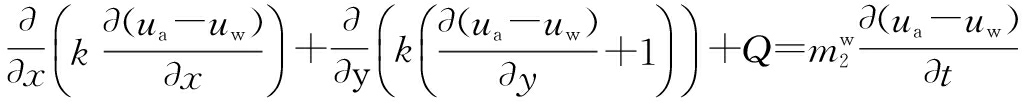
(12)
where Q is the applied boundary flux; t is the time.
2.1 Properties of BCS
The mechanical and hydraulic parameters to be inputting into the numerical model were measured in a black cotton soil (BCS) sample taken from a depth of 1.0 to 1.5 m at a site of the southern bypass in Nairobi, Kenya. The basic physical properties of the soil obtained, according to JTG E40—2007 are presented in Tab.1. The clay content (<0.002 mm) of the soil is high (52%), the swell percent and swell pressure are 3.12% and 221 kPa, respectively. Therefore, the soil is regarded as an expansive soil with a high swell-shrink potential.
Tab.1 Properties of BCS
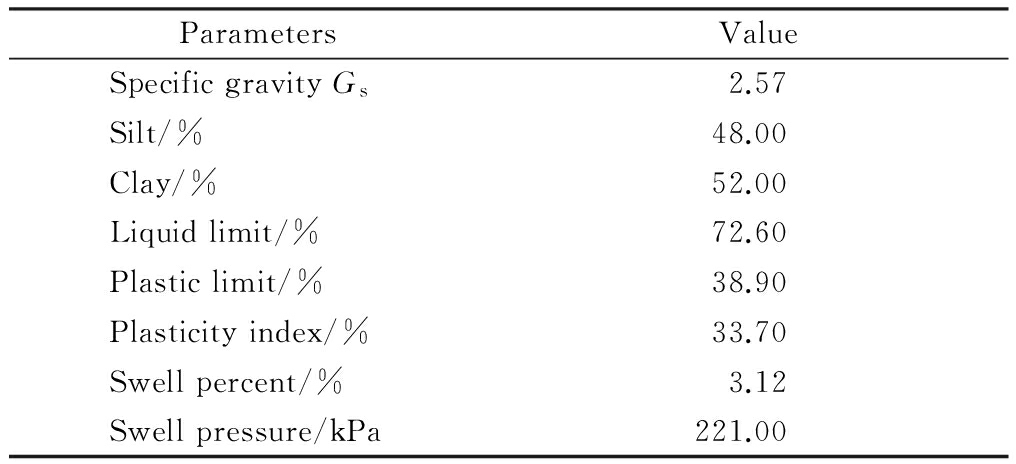
ParametersValueSpecificgravityGs2.57Silt/%48.00Clay/%52.00Liquidlimit/%72.60Plasticlimit/%38.90Plasticityindex/%33.70Swellpercent/%3.12Swellpressure/kPa221.00
2.2 Constitutive surface for BCS
The constitutive surfaces are used to express the relationship between the state variables and stress state variables of the soils. In order to establish the constitutive surfaces for unsaturated soil, six curves describing the relationship between the state variables and stress state variables will be obtained first by different laboratory tests.
Three curves, the soil-water characteristic curve (SWCC), the variation of void ratio with the mechanical stress and the variation of void ratio with the water content in soil, were determined by the pressure plate test extractor, the traditional oedometer and the free shrinkage test, respectively[17]. The matric suction was zero during the one-dimensional consolidation test, and the degree of saturation S was assumed to be 100% with the increase of the mechanical stress. Applying the relationship Se=wGs, the variation of the water content with the mechanical stress for BCS can be obtained.
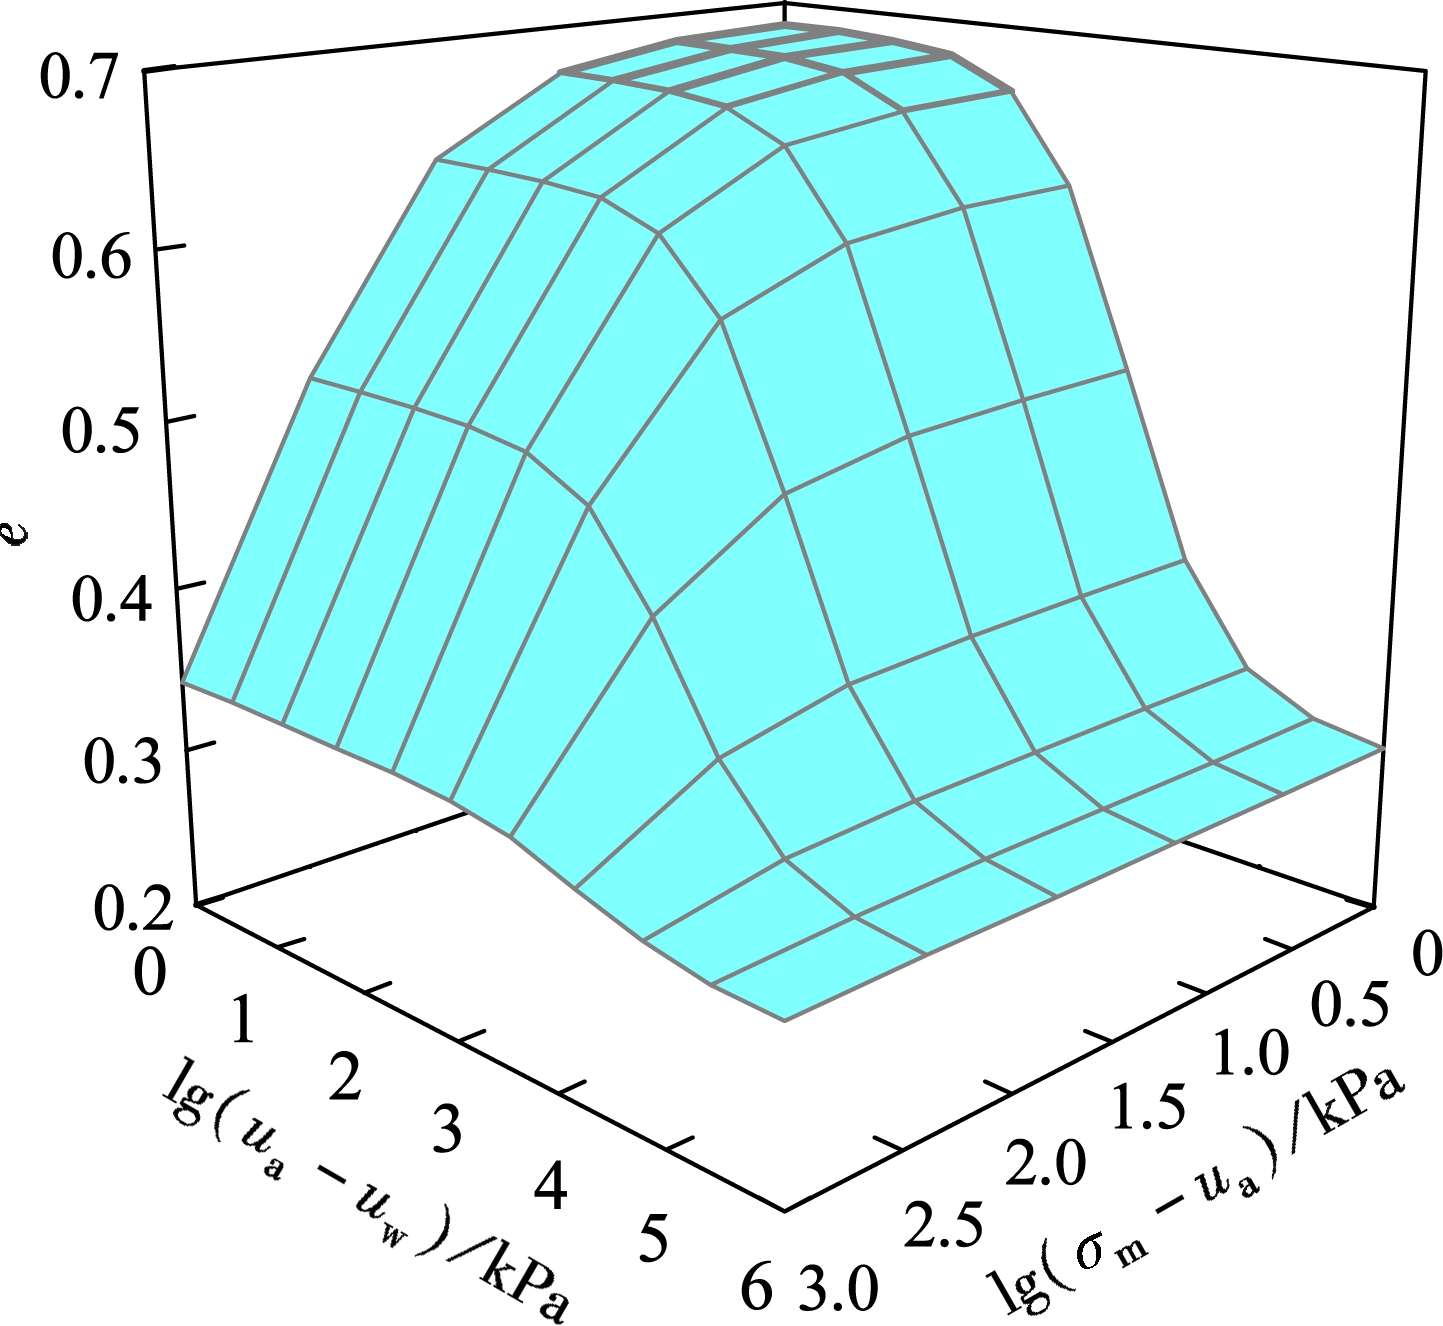
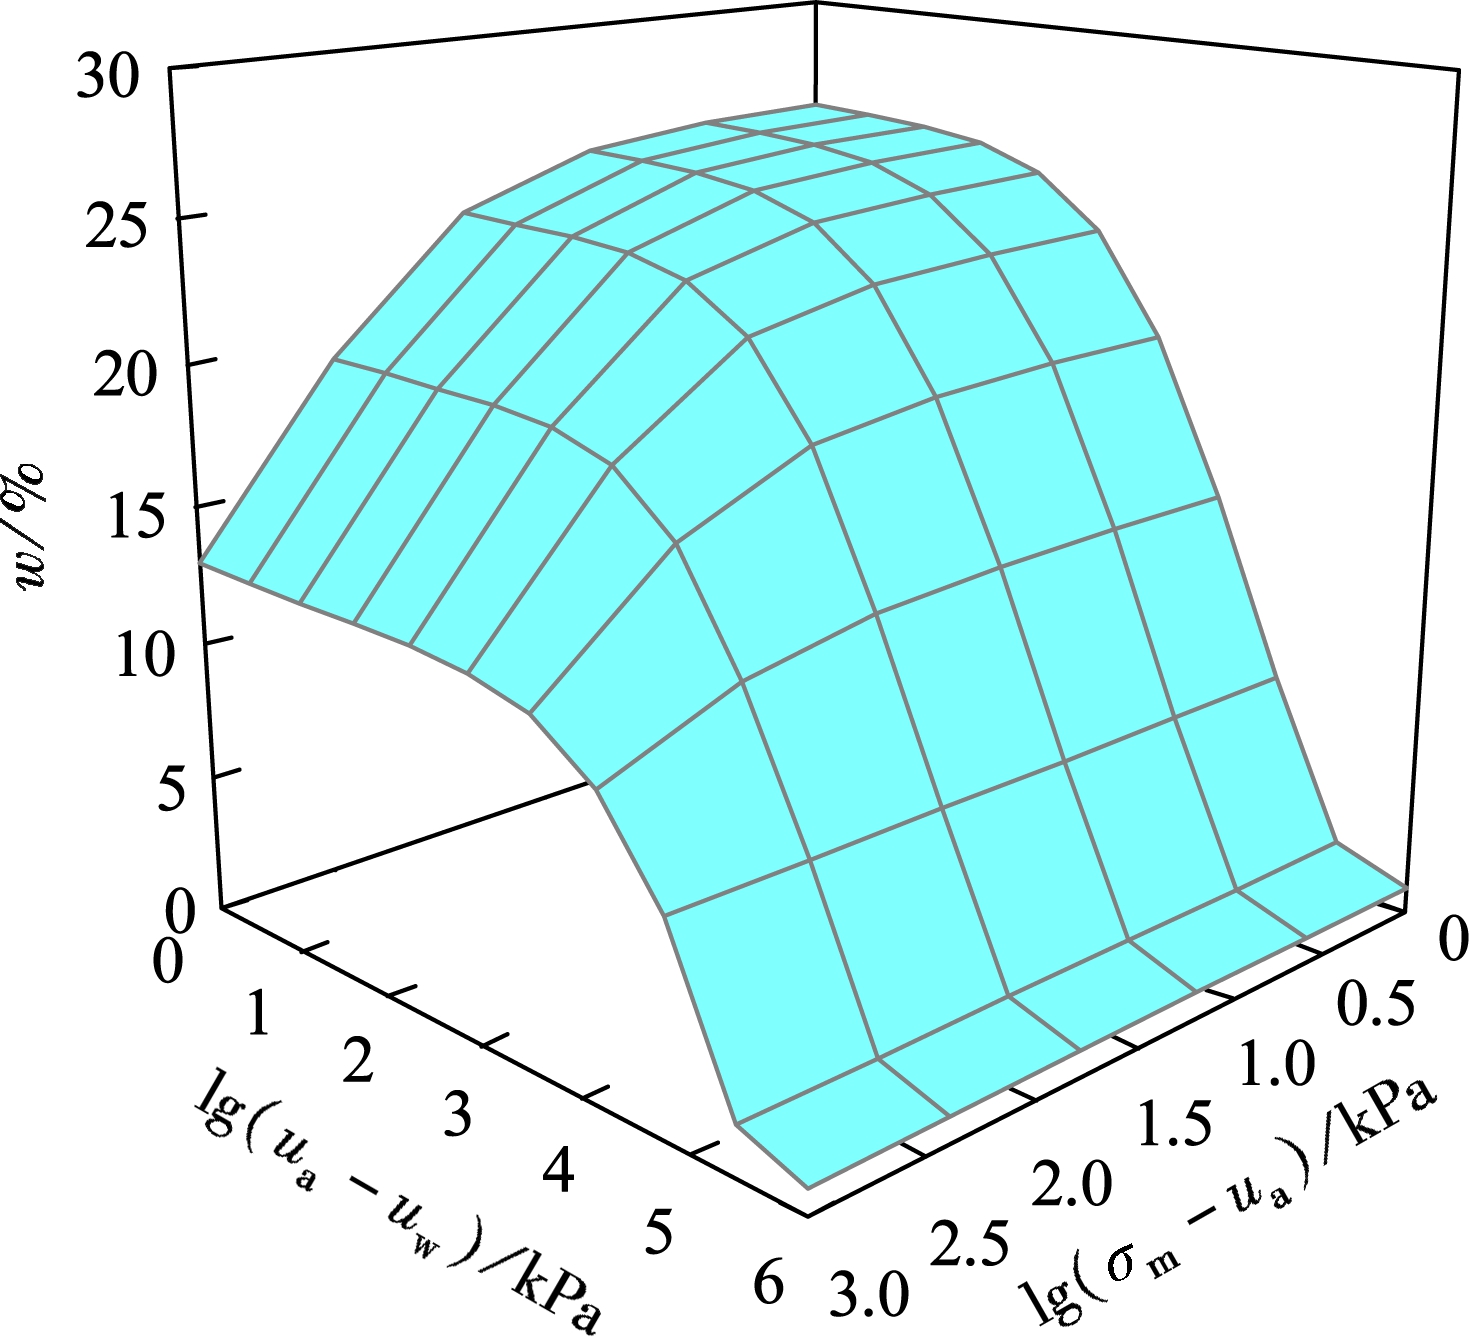
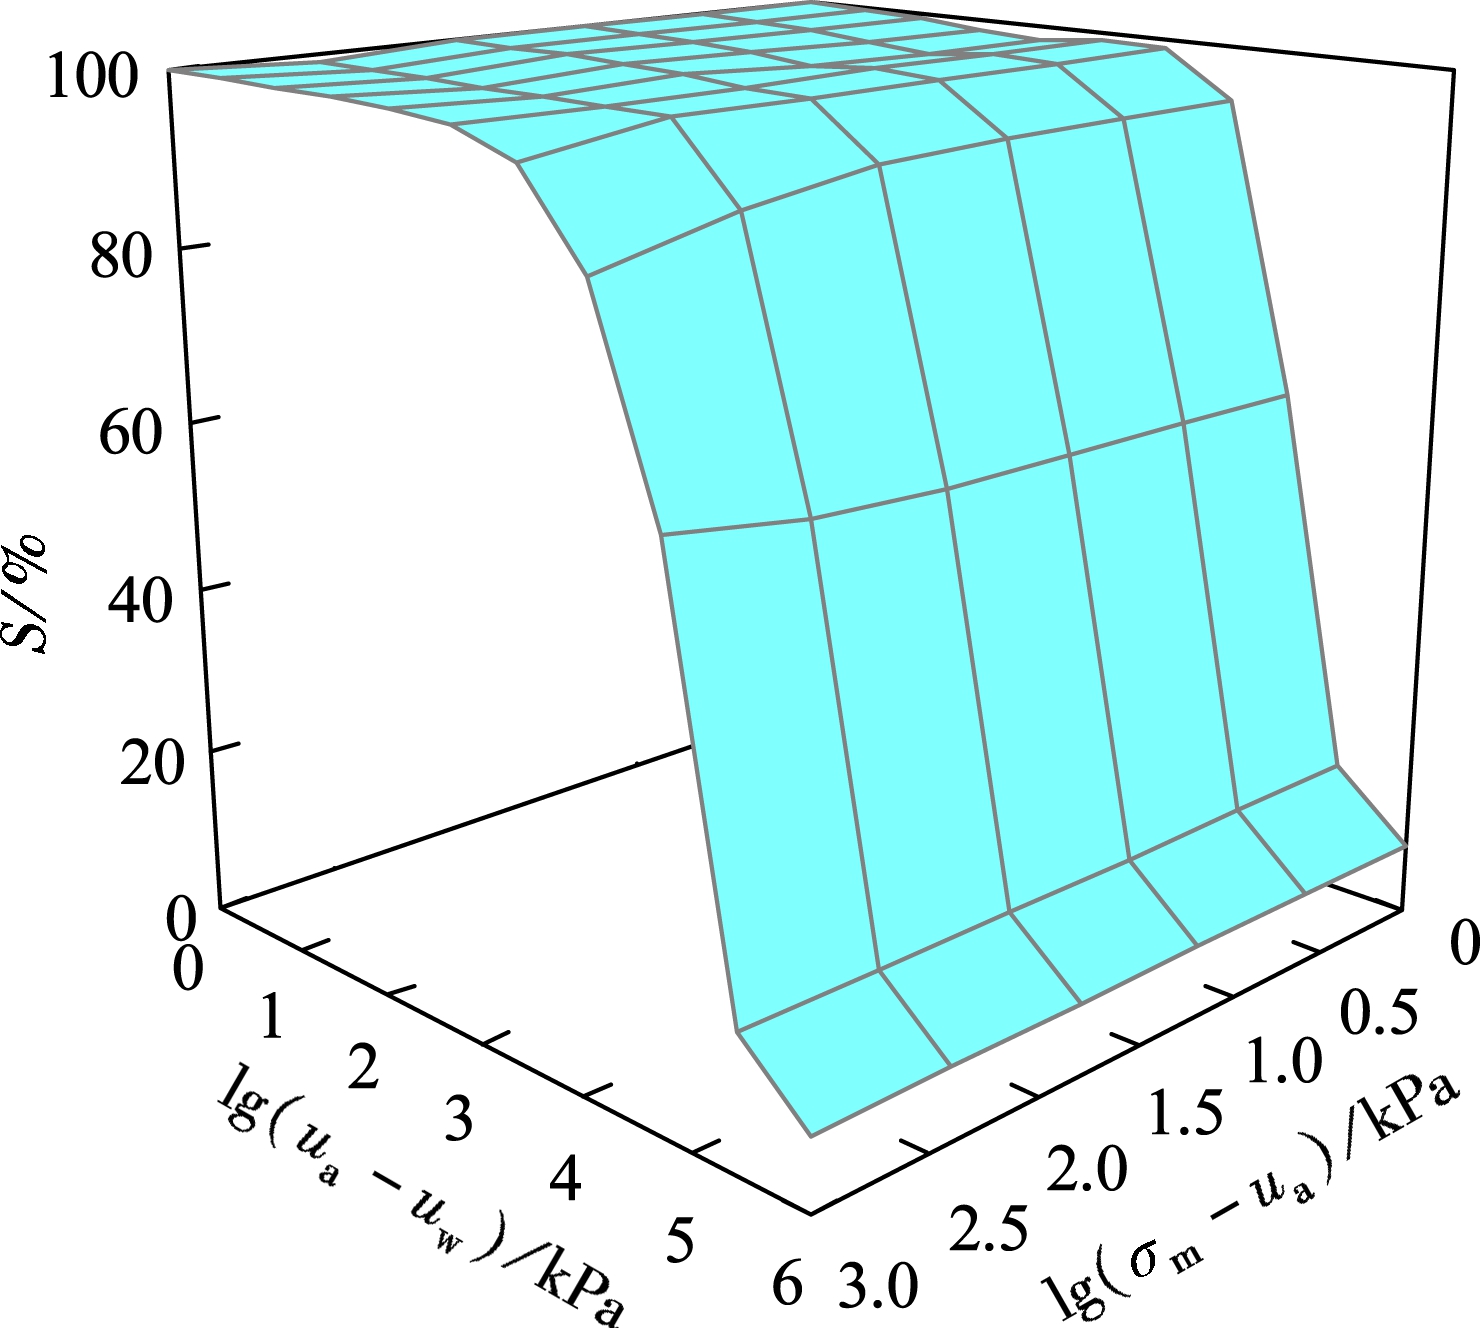
The void ratio vs. the matric suction curve was obtained using the SWCC and the void ratio vs. the water content curve. Then, the degree of saturation vs. the matric suction curve was obtained using the SWCC and the relationship Se=wGs. Now, all six curves used to establish the constitutive surfaces for BCS were obtained. The constitutive surfaces for BCS are shown in Fig.1.
(a)
(b)
(c)
Fig.1 Constitutive surfaces for BCS. (a) Void ratio constitutive surface; (b) Degree of saturation constitutive surface; (c) Water content constitutive surface
2.3 Numerical model
The coupled temperature-displacement option in ABAQUS is used to perform the simulation of embankment soil shrinkage since it has similar differential equations to the coupled hydro-mechanical stress problem. A main program and four user subroutines including USDFLD, UMAT, UEXPAN and UMTHT were used to perform the simulation. The matric suction and mechanical stress are calculated by the main program and the calculation results are transferred into the user subroutine USDFLD to calculate the soil parameters by using the constitutive surfaces. Afterwards, the soil parameters were transferred into the user subroutine UMAT, UMTHT and UEXPAN to calculate the stiffness matrix for the equilibrium equation, the water continuity and swell stress, respectively.
A typical highway embankment section of the Southern Bypass in Nairobi shown in Fig.2 was developed to analyze the soil movement and tensile stress in embankment soil. The embankment was constructed using the nonexpansive soils such as red soil. The gravelly soil is located under the BCS layer of which the buried depth ranges from 0.5 to 3.5 m. In this study, the coupled consolidation theory for unsaturated soils was used to simulate the swell-shrinkage deformation of the BCS foundation. The unsaturated seepage was only considered in the embankment soil and gravelly soil. The ground water table is located at the depth of 4 m. The bottom nodes of the model were restricted to moving in any direction, the bilateral nodes of the foundation were restricted to moving in x-direction, but they were free to move in y-direction. Evaporation was used as an outlet discharge on each surface element.
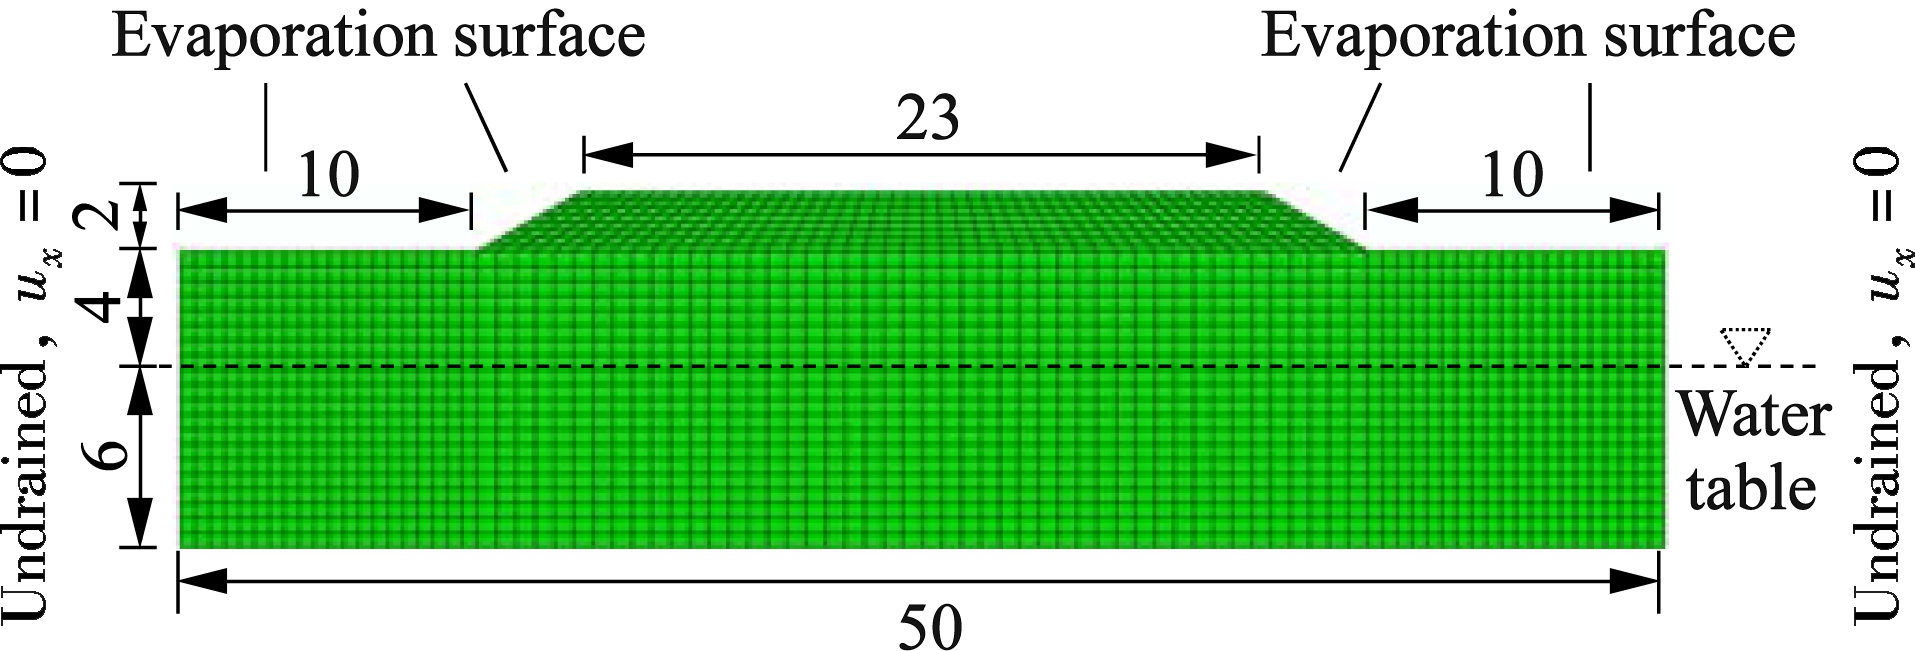
Fig.2 Finite elements and boundary conditions of a typical embankment section (unit: m)
Considering the calculation accuracy, the meshes were not uniform, and the evaporation surface had a smaller mesh size. The fixed incremental step was used in the numerical simulation. Each incremental step was 86 400 s, namely that in one day, 30 incremental steps were used during the whole calculation process.
2.4 Unsaturated hydraulic conductivity
Falling head permeability tests were used to measure the saturated hydraulic conductivity of the subgrade soils. The unsaturated hydraulic conductivity was predicted by SWCC due to its difficult measurement. The unsaturated hydraulic conductivity vs. matric suction for the subgrade soils was fitted to an equation based on van the Genuchten model[18].
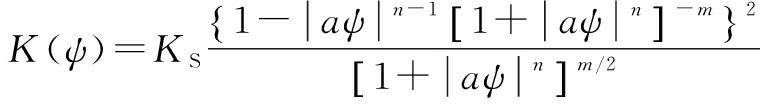
(13)
where K(ψ)is the hydraulic conductivity; KSis the saturated hydraulic conductivity; ψ is the matric suction; a, n and m are the fitting parameters, m=1-1/n.
The variation of hydraulic conductivity with matric suction for subgrade soils is shown in Fig.3. The fitting values of the model parameters are shown in Tab.2.
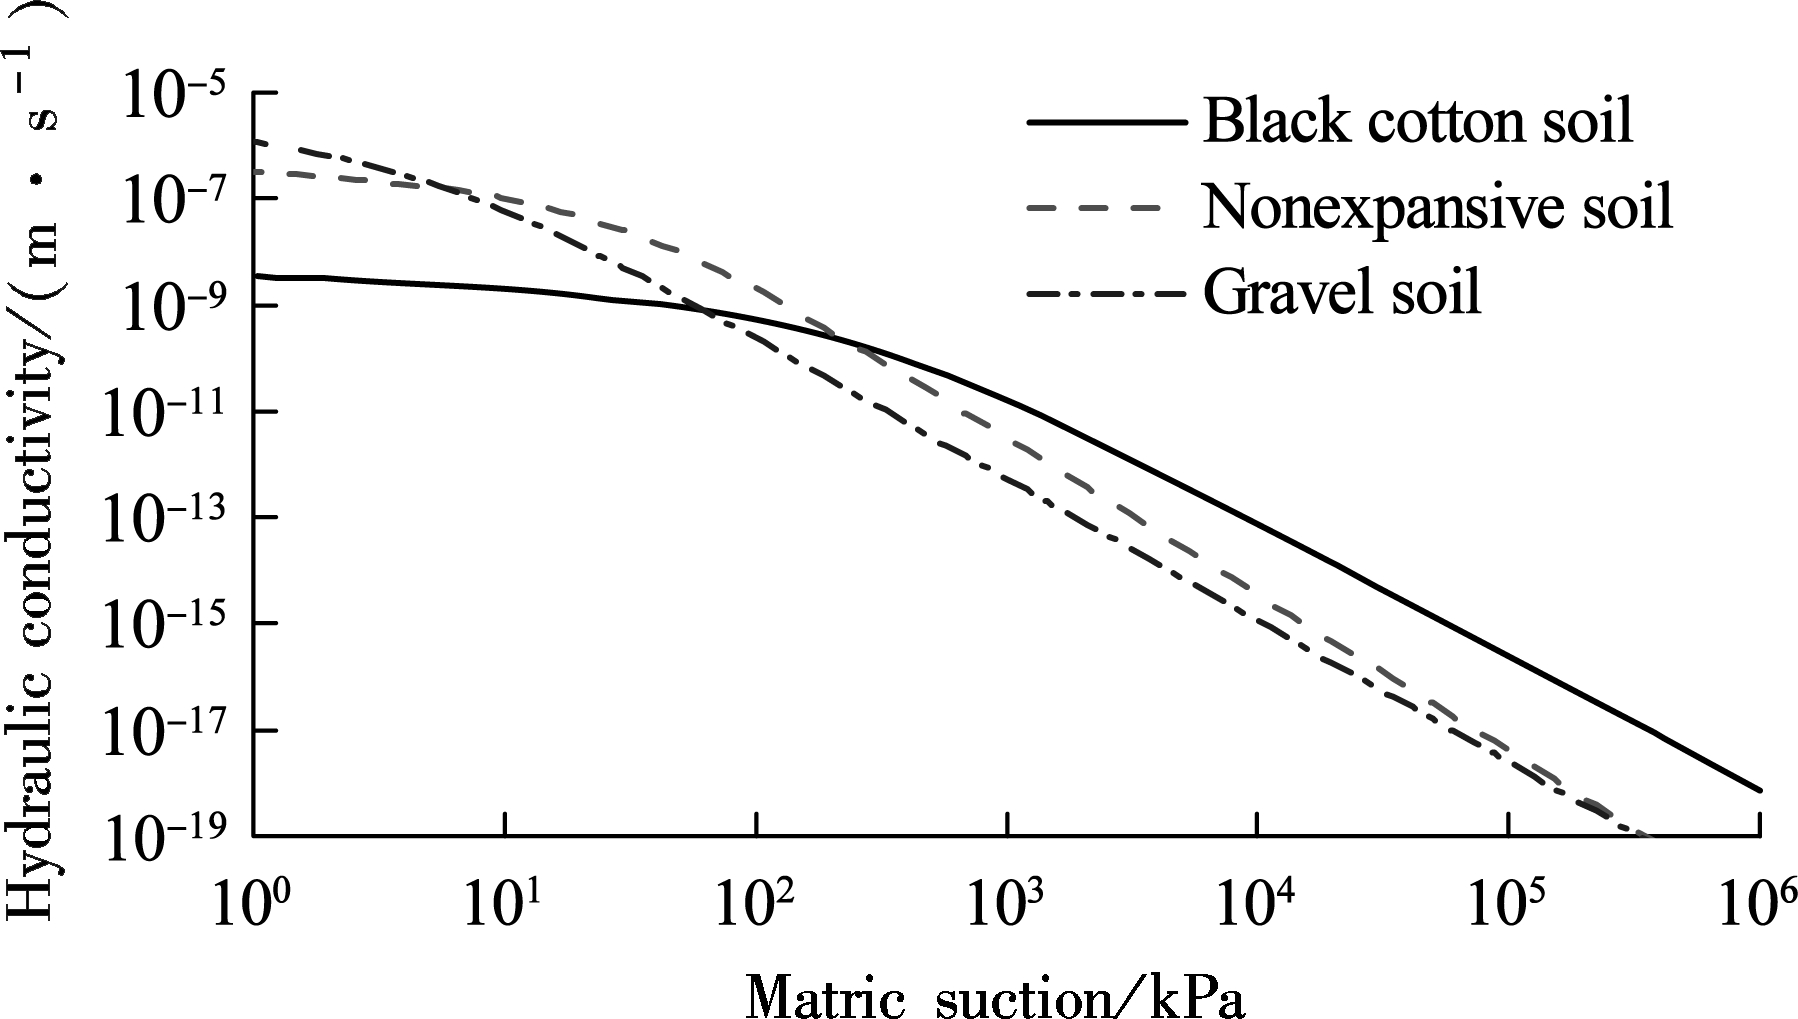
Fig.3 Variation of hydraulic conductivity with matric suction for subgrade soils
Tab.2 Fitting parameters of the van Genuchten model for subgrade soils
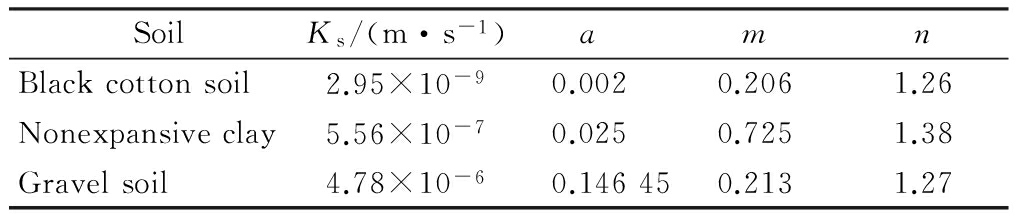
SoilKs/(m·s-1)amnBlackcottonsoil2.95×10-90.0020.2061.26Nonexpansiveclay5.56×10-70.0250.7251.38Gravelsoil4.78×10-60.146450.2131.27
3.1 Crack generation within embankment
Fig.4 shows the change in matric suction on the top of the foundation following the evaporation duration for a system in which the embankment height was 2 m and the BCS thickness was 3.5 m. The matric suction increases faster outside the range of the highway embankment, compared with the foundation soil underneath the highway embankment. Therefore, the matric suction on the surface of the foundation forms a concave distribution. The concave distribution of the matric suction will result in the differential deformation of the foundation, and affect the behavior of the highway embankment eventually.
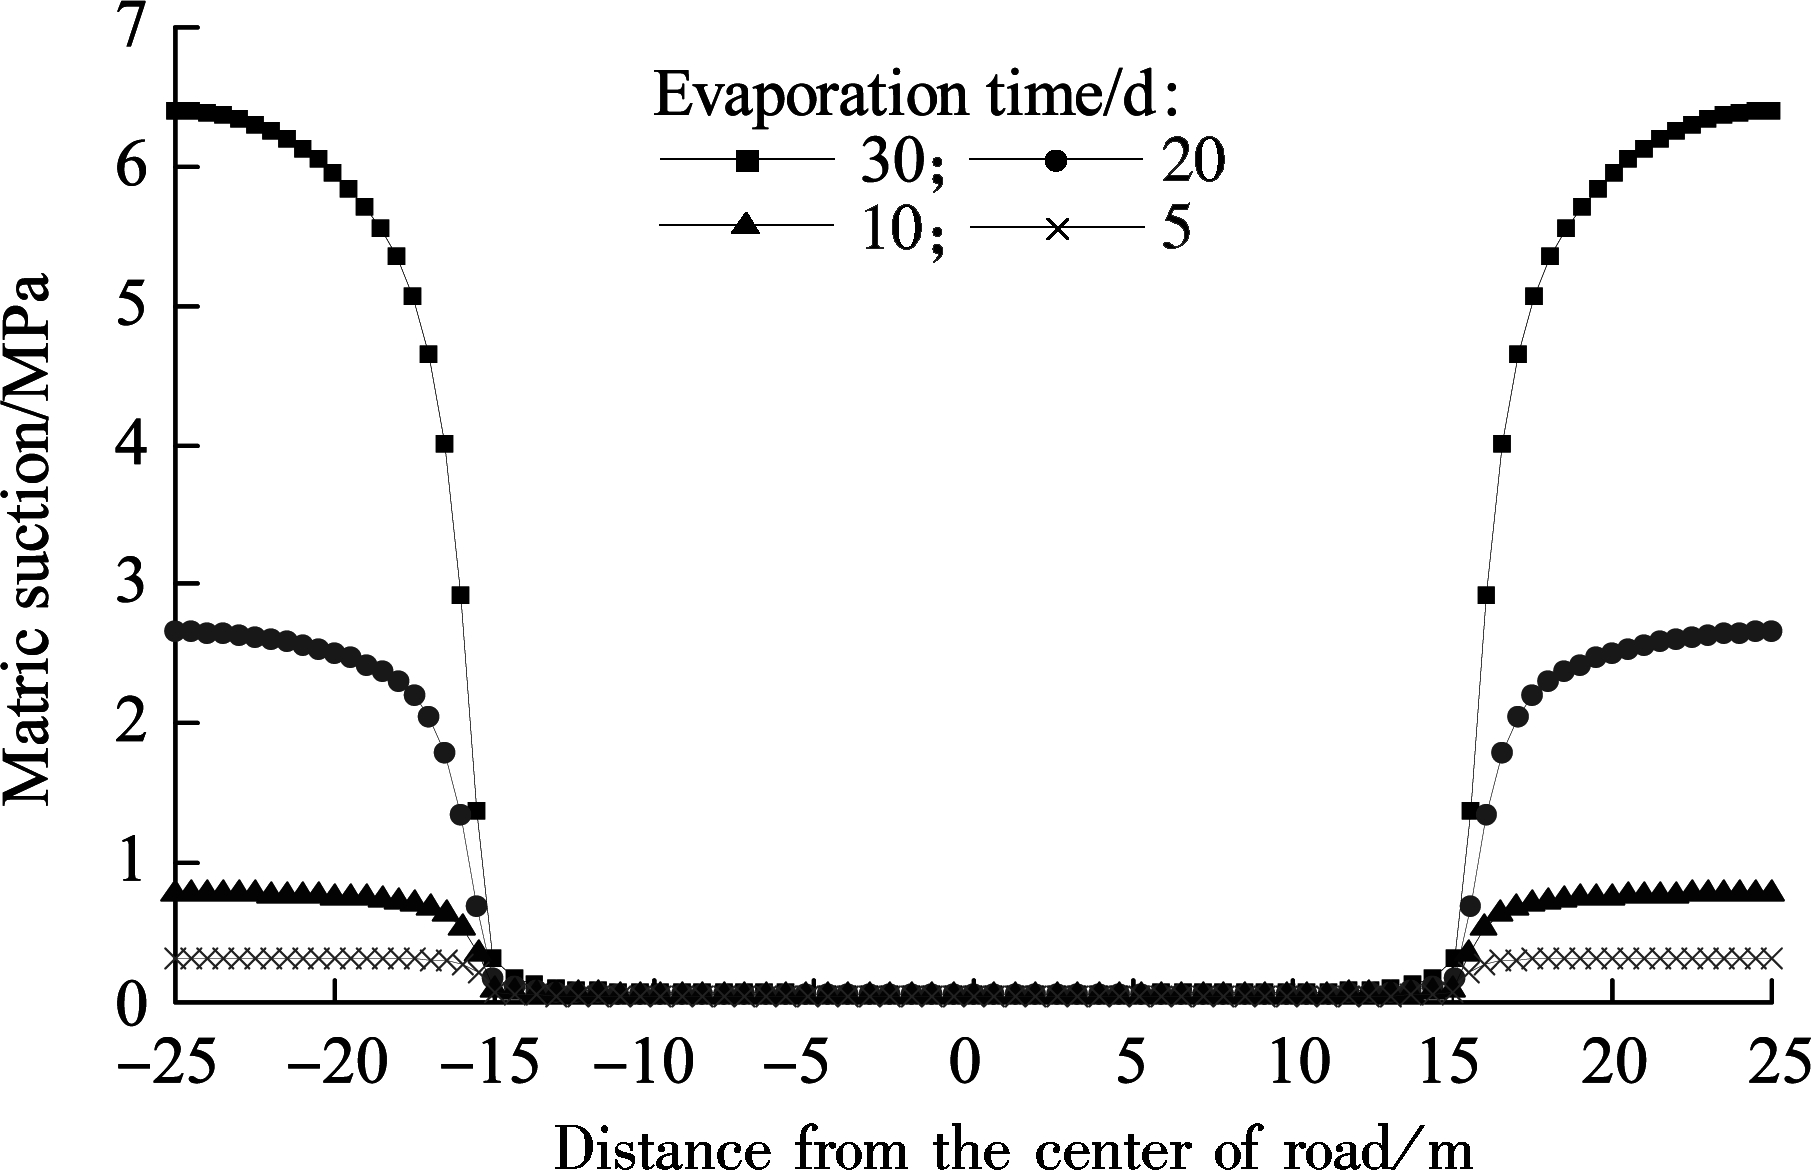
Fig.4 Change in matric suction on the surface of the foundation following evaporation duration
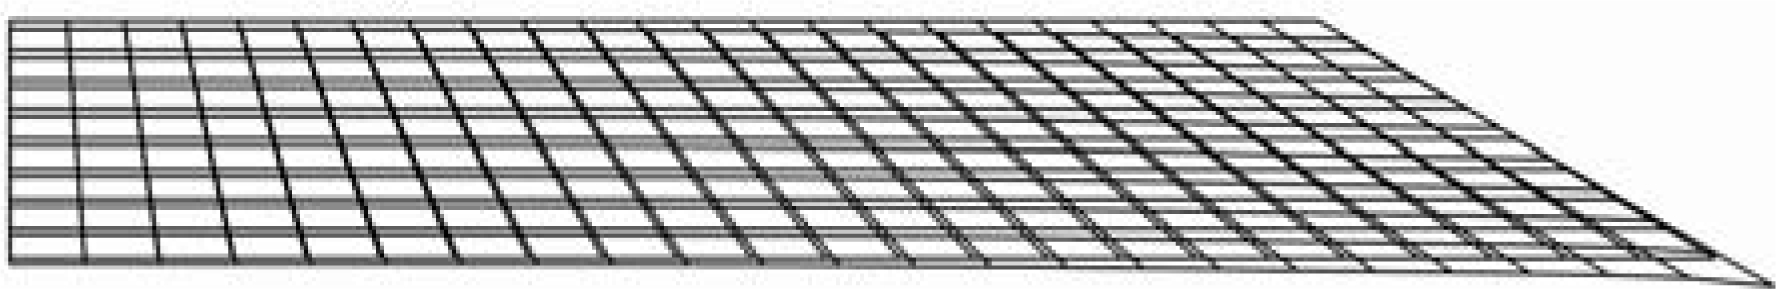
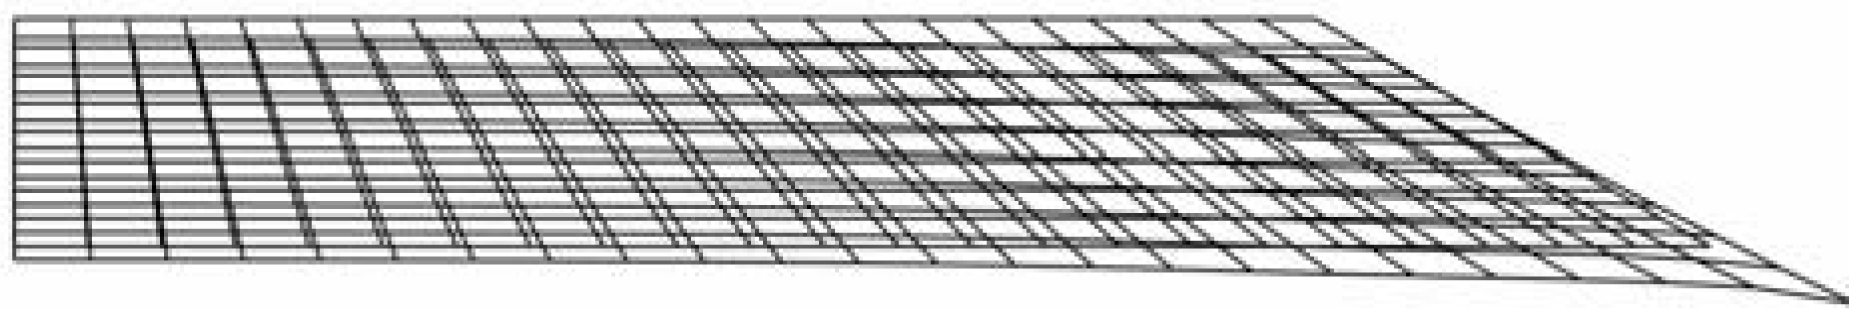
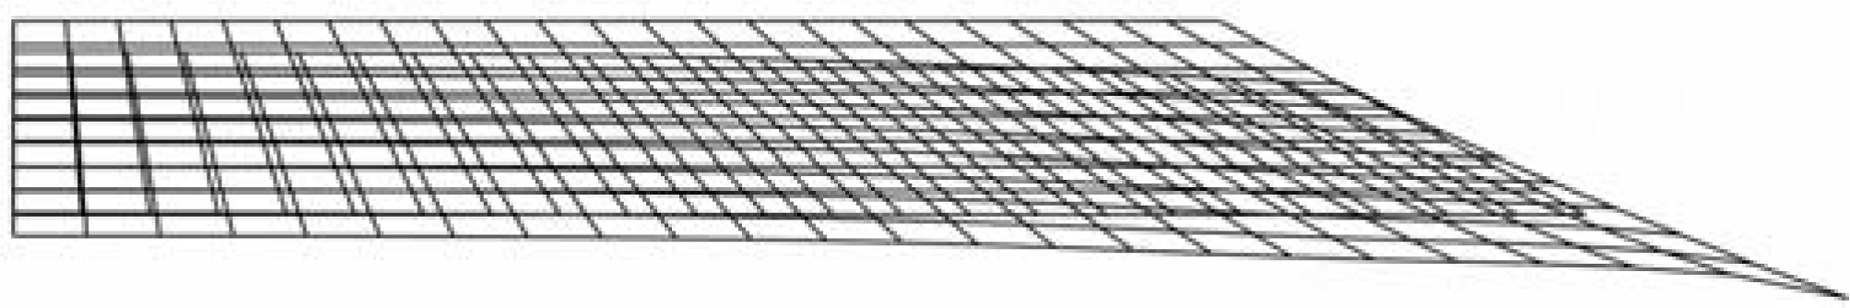
The simulated deformation of the embankment is shown in Fig.5. The deformation increased faster at slop angle than in any other region since there was a sudden change in matric suction at the slope angle.
The tensile stress can be estimated by the strain tensor as follows:
(a)
(b)
(c)
Fig.5 Simulated deformation of the embankment. (a) 10 d evaporation; (b) 20 d evaporation; (c) 30 d evaporation
(14)
where ![]() x is the stress in the x-direction; Kv is the bulk modulus; μ is Poisson’s ratio; εx is the strain in the x-direction; εy is the strain in the y-direction.
x is the stress in the x-direction; Kv is the bulk modulus; μ is Poisson’s ratio; εx is the strain in the x-direction; εy is the strain in the y-direction.
Eq.(14) demonstrates that the balance between vertical subsidence and horizontal extension determines whether the horizontal stress is tensile or compressive. The tensile stress is generated where the soil fabric is elongated horizontally and only slightly subsides.
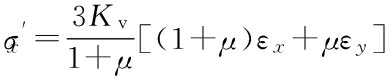
The simulated distribution of tensile stress in embankment soils is shown in Fig.6, and the red region and blue region stand for the maximum and minimum tensile stress, respectively. The results show that the peak of the tensile stress is located at the slope angle due to its largest deformation following the increase of evaporation. However, the stress distribution on top of the embankment is the focus for studying the embankment crack. With the increase in evaporation, the tensile stress on the top of embankment gradually increases and the peaks of the tensile stress progress towards the shoulder of the highway embankment. The probable location of crack generation depends on both the location of the peaks and the tensile strength there. The tensile strength of embankment soil obtained by the uniaxial tensile test using the specimen compacted under optimum moisture content is 9 kPa. If the tensile stress at the peak reaches 9 kPa before the peaks converge at a site near the shoulder of the highway embankment, the cracks are likely formed away from the site; otherwise, a single crack is formed at the site.
(a)
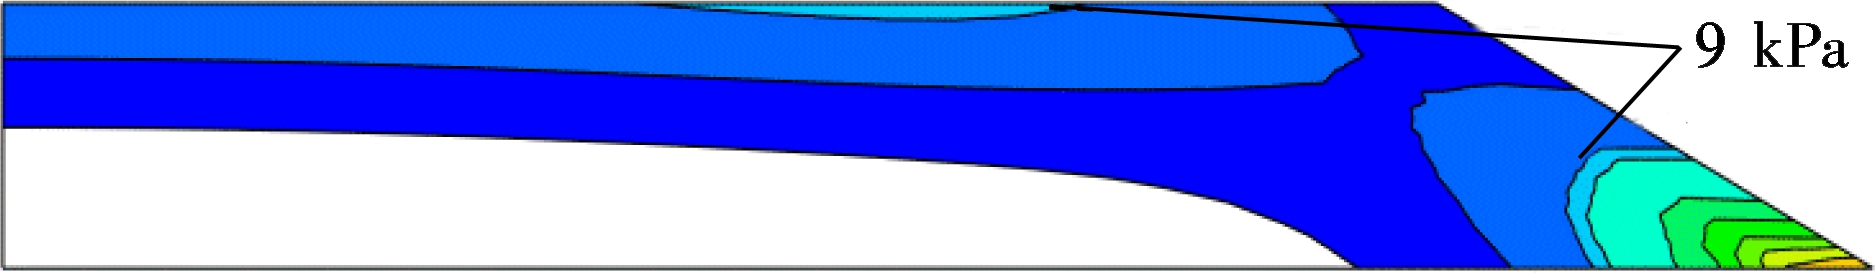
(b)
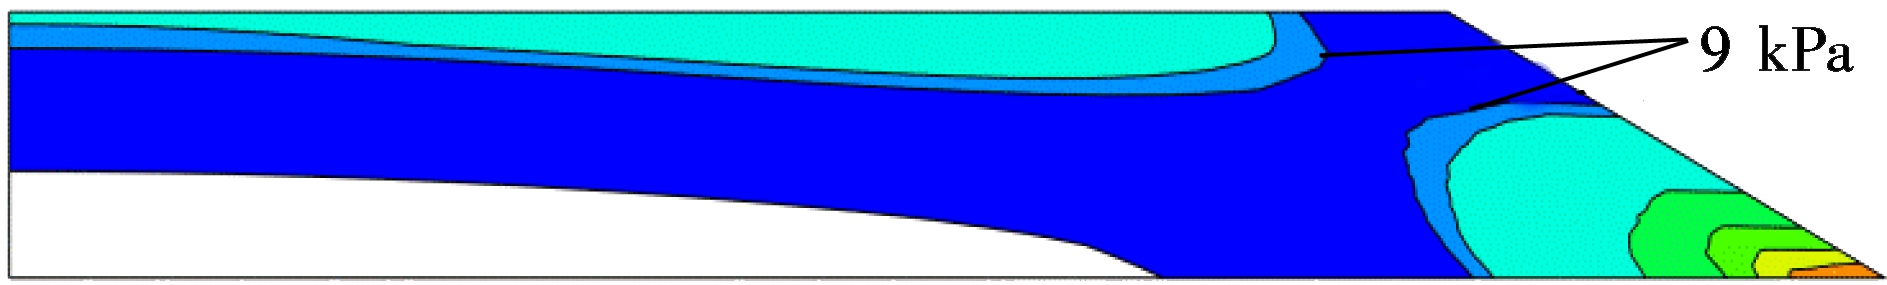
(c)
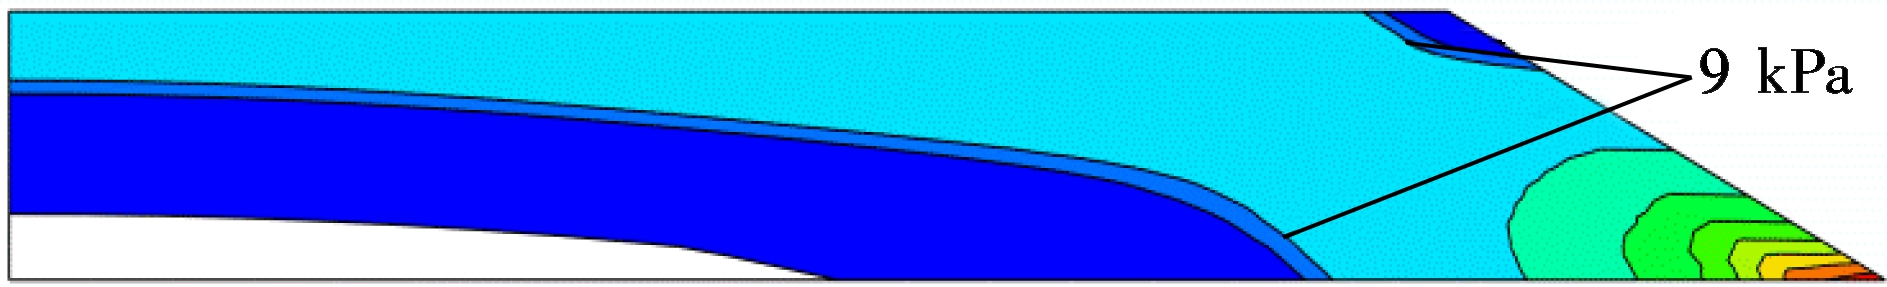
(d)
Fig.6 Simulated distribution of tensile stress. (a) 15 d evaporation; (b) 20 d evaporation; (c) 25 d evaporation; (d) 30 d evaporation
3.2 Effects of boundary and spatial conditions on crack location
The influence of the evaporation intensity on the movement of the peak of the tensile stress is shown in Fig.7. As can be seen from Fig.7, the peaks generally appear on top of the embankment without regard to the tensile stress at the slope angle; therefore, only lateral locations are represented. The larger evaporation intensity causes an abrupt rise in tensile stress. The peaks tend to locate away from the center of the embankment when the evaporation intensity is larger. Thus, the value of evaporation intensity can be used as a basis to predict crack generation.
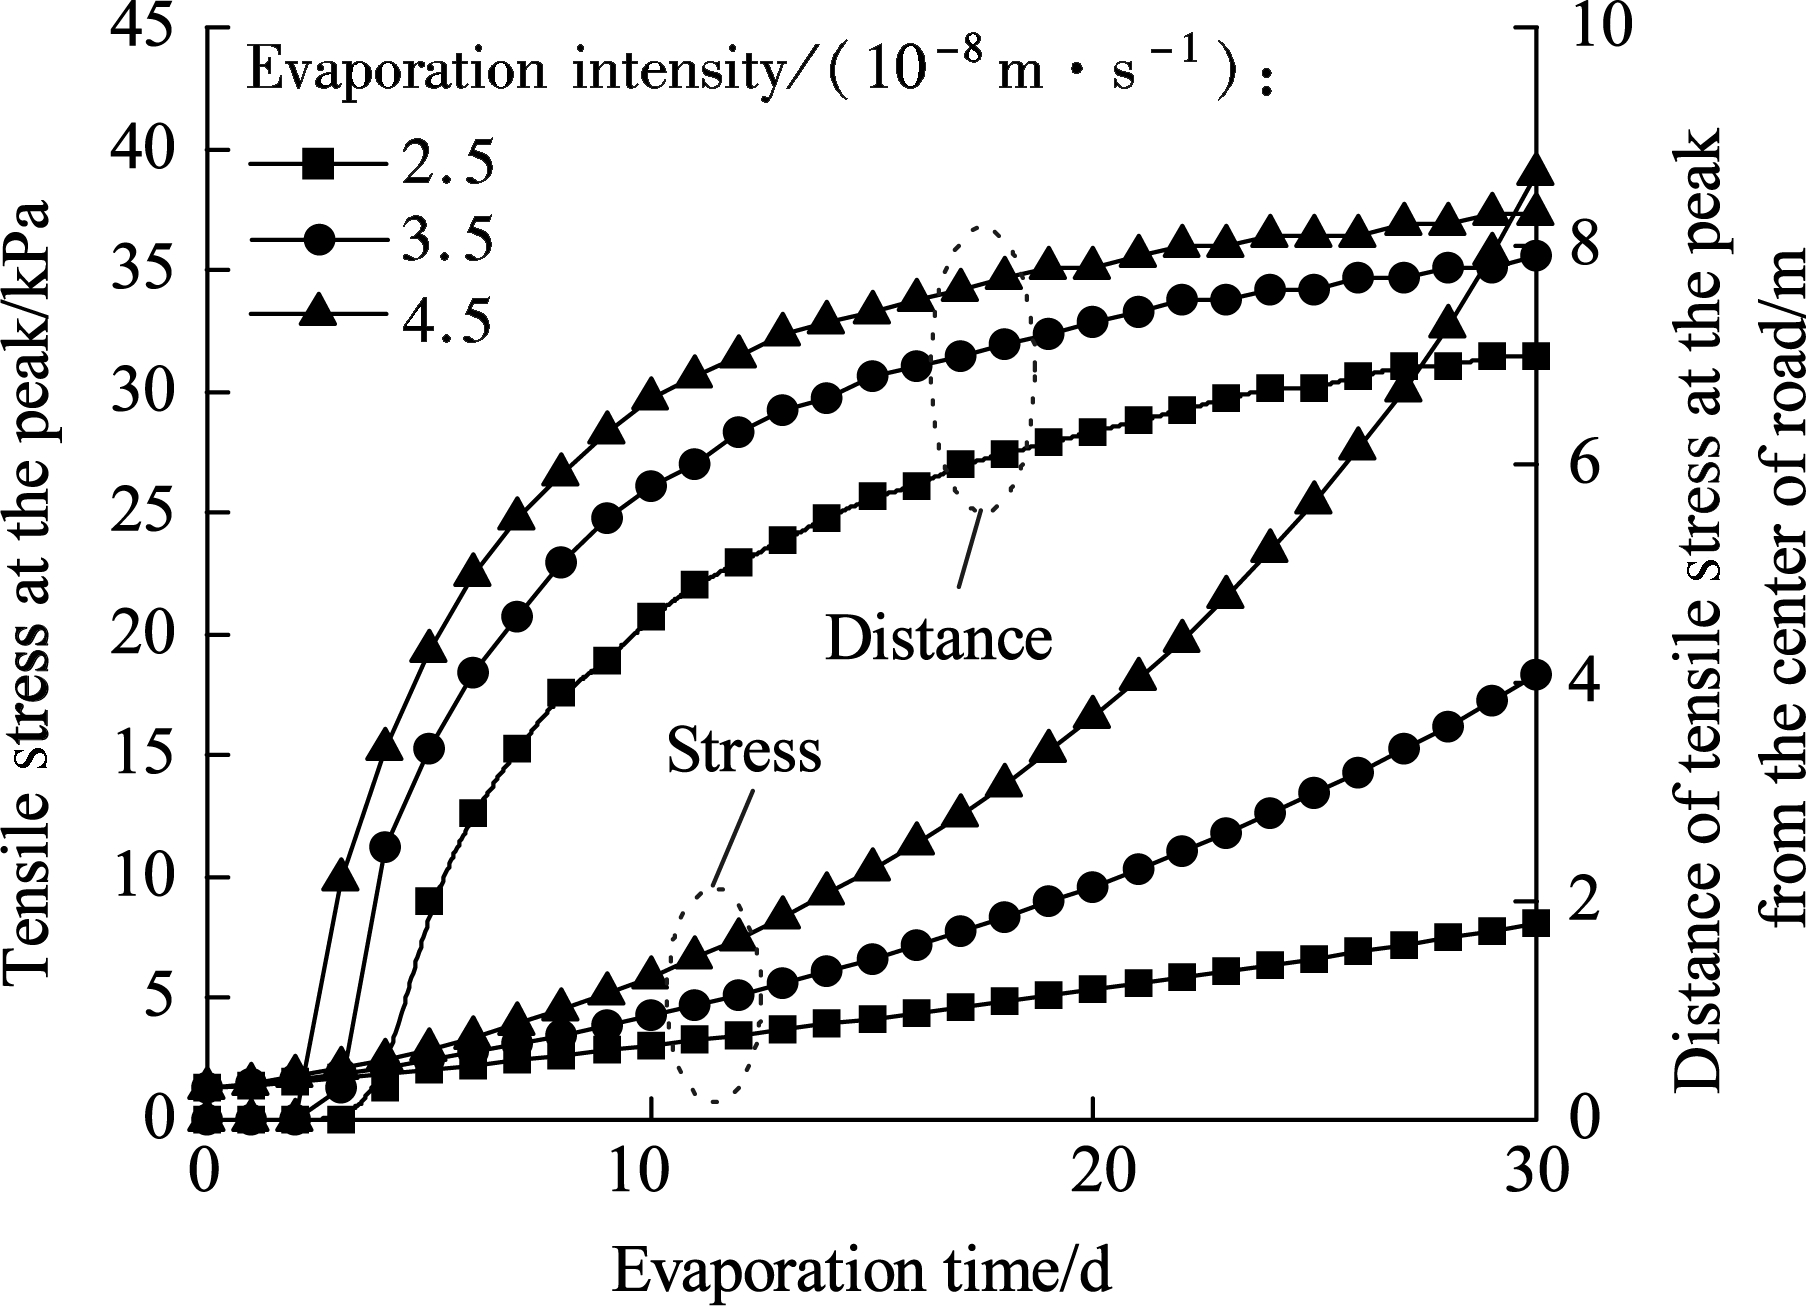
Fig.7 Influence of the evaporation intensity on the peak of tensile stress and its location
Fig.8 compares the influence of the BCS thickness on the peaks of tensile stress and its location. The embankment height and evaporation intensity are fixed at 2 m and 3.5×10⁻⁸ m/s, respectively. The location of the peak of tensile stress tends to be close to the shoulder of embankment following the evaporation duration. The thicker BCS layer helps the peaks of tensile stress to reach the critical tensile stress at a value of 9 kPa. The embankment will not crack if the BCS thickness is less than 1.5 m.
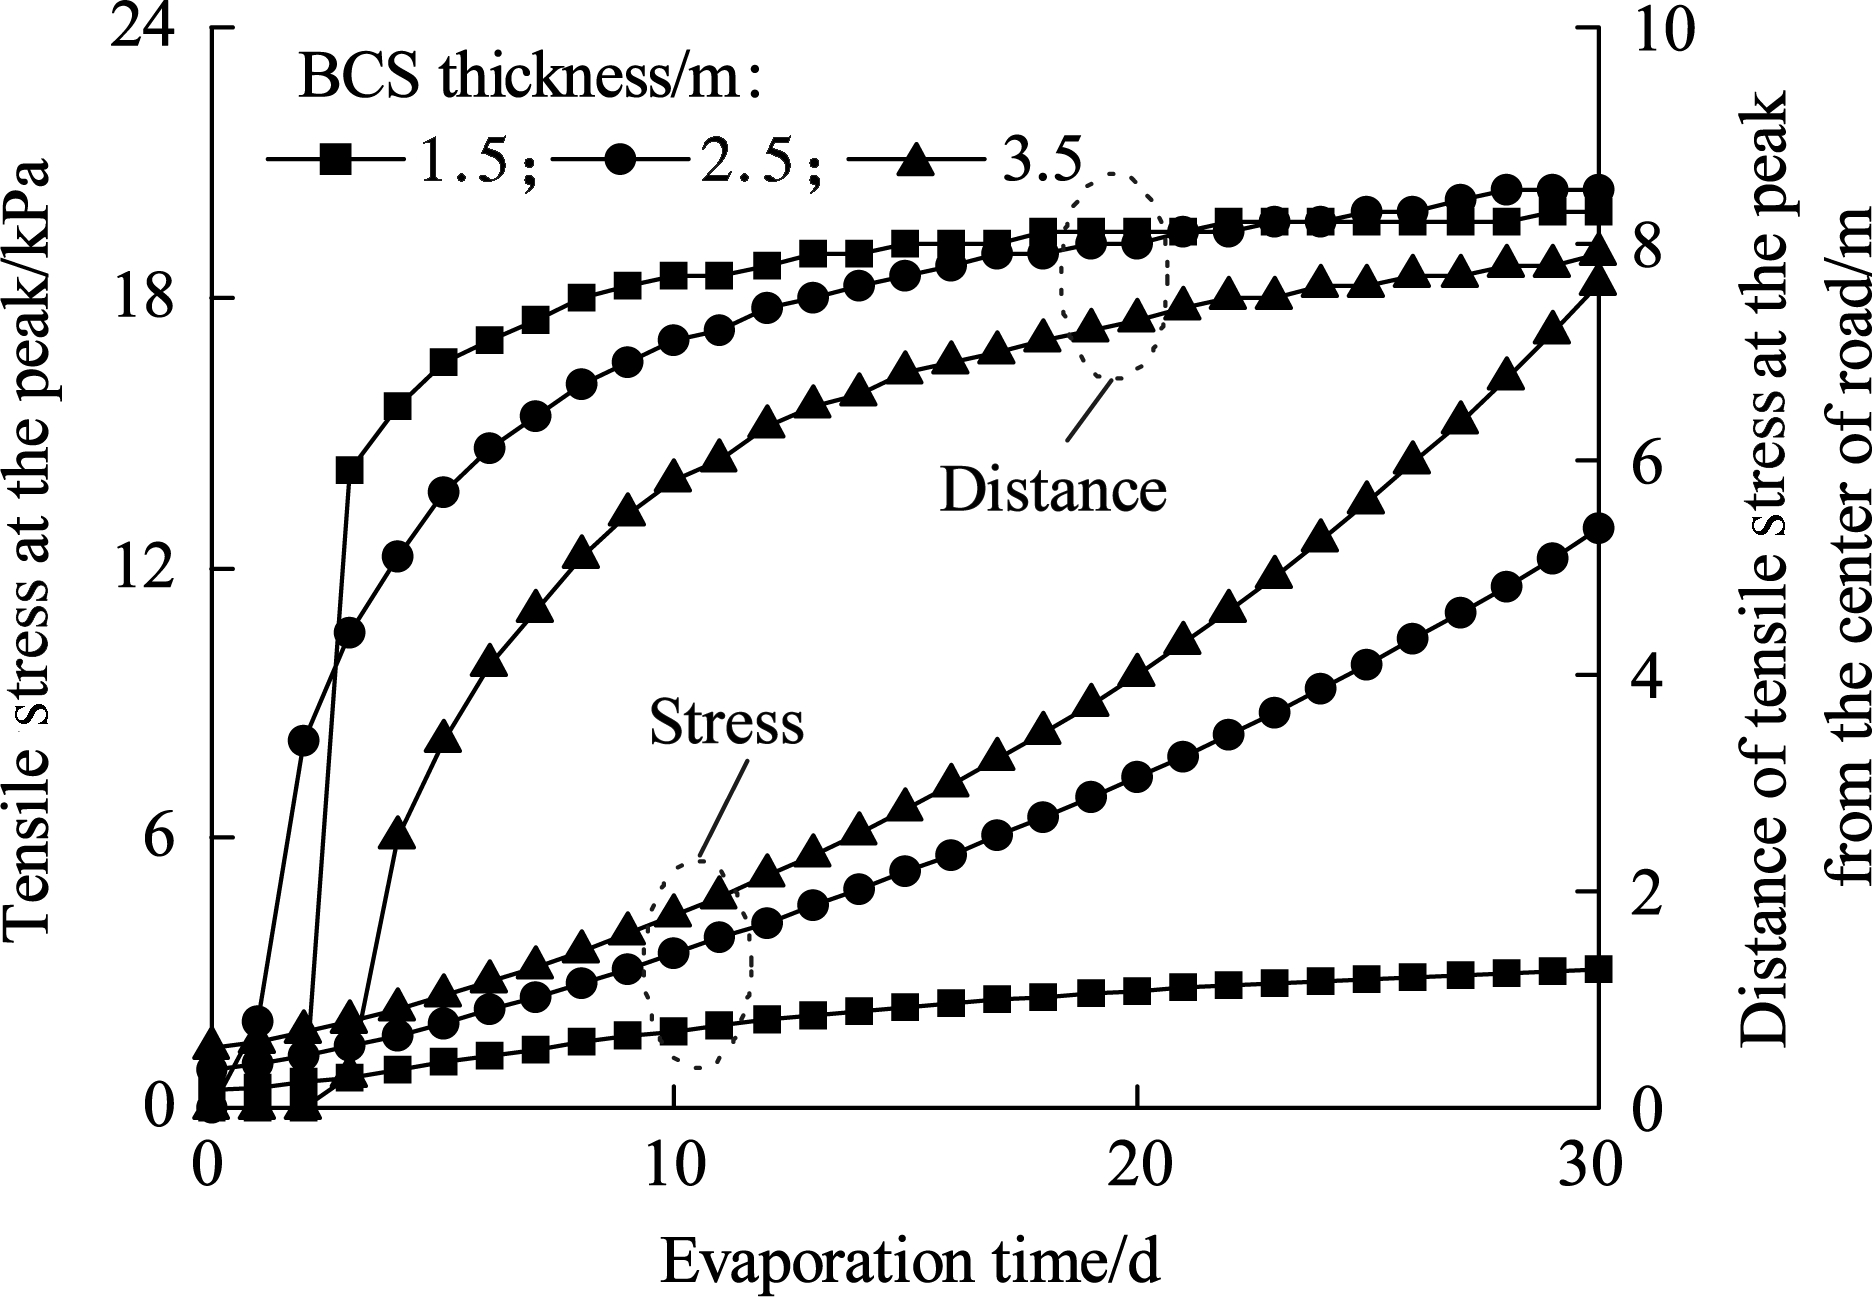
Fig.8 Influence of BCS thickness on the peak of tensile stress and its location
Fig.9 compares the influence of the embankment height on the peak of tensile stress and its location. The location of the peaks of tensile stress converges faster at a site near the shoulder of the embankment when it has a lower height. With the increase of embankment height, the influence of the soil movement of the BCS foundation on the deformation on top of the embankment decreases, and less tensile stress is induced. Thus, a higher embankment constructed on a thinner BCS layer can decrease the tensile stress in the embankment soils.
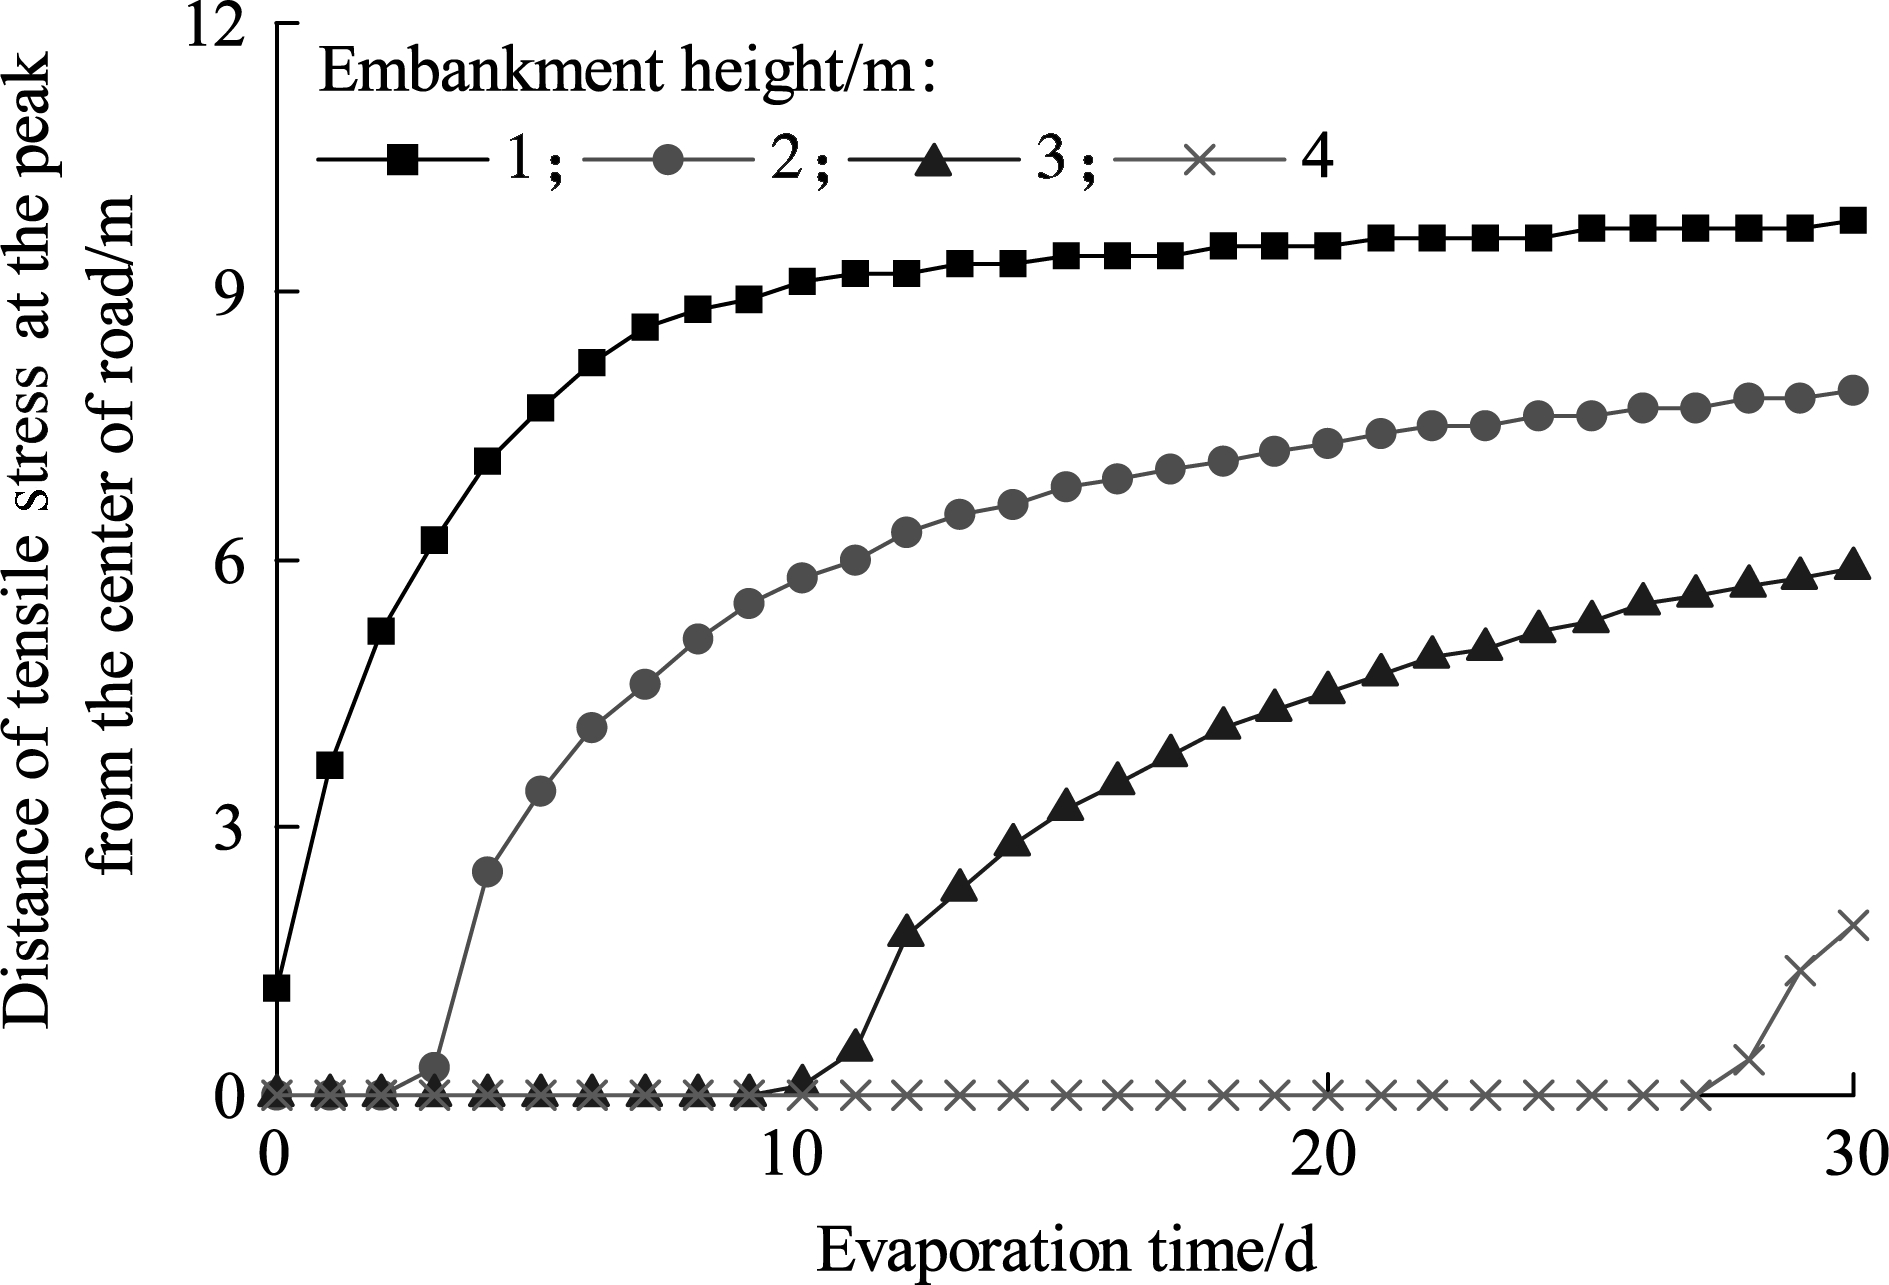
(a)
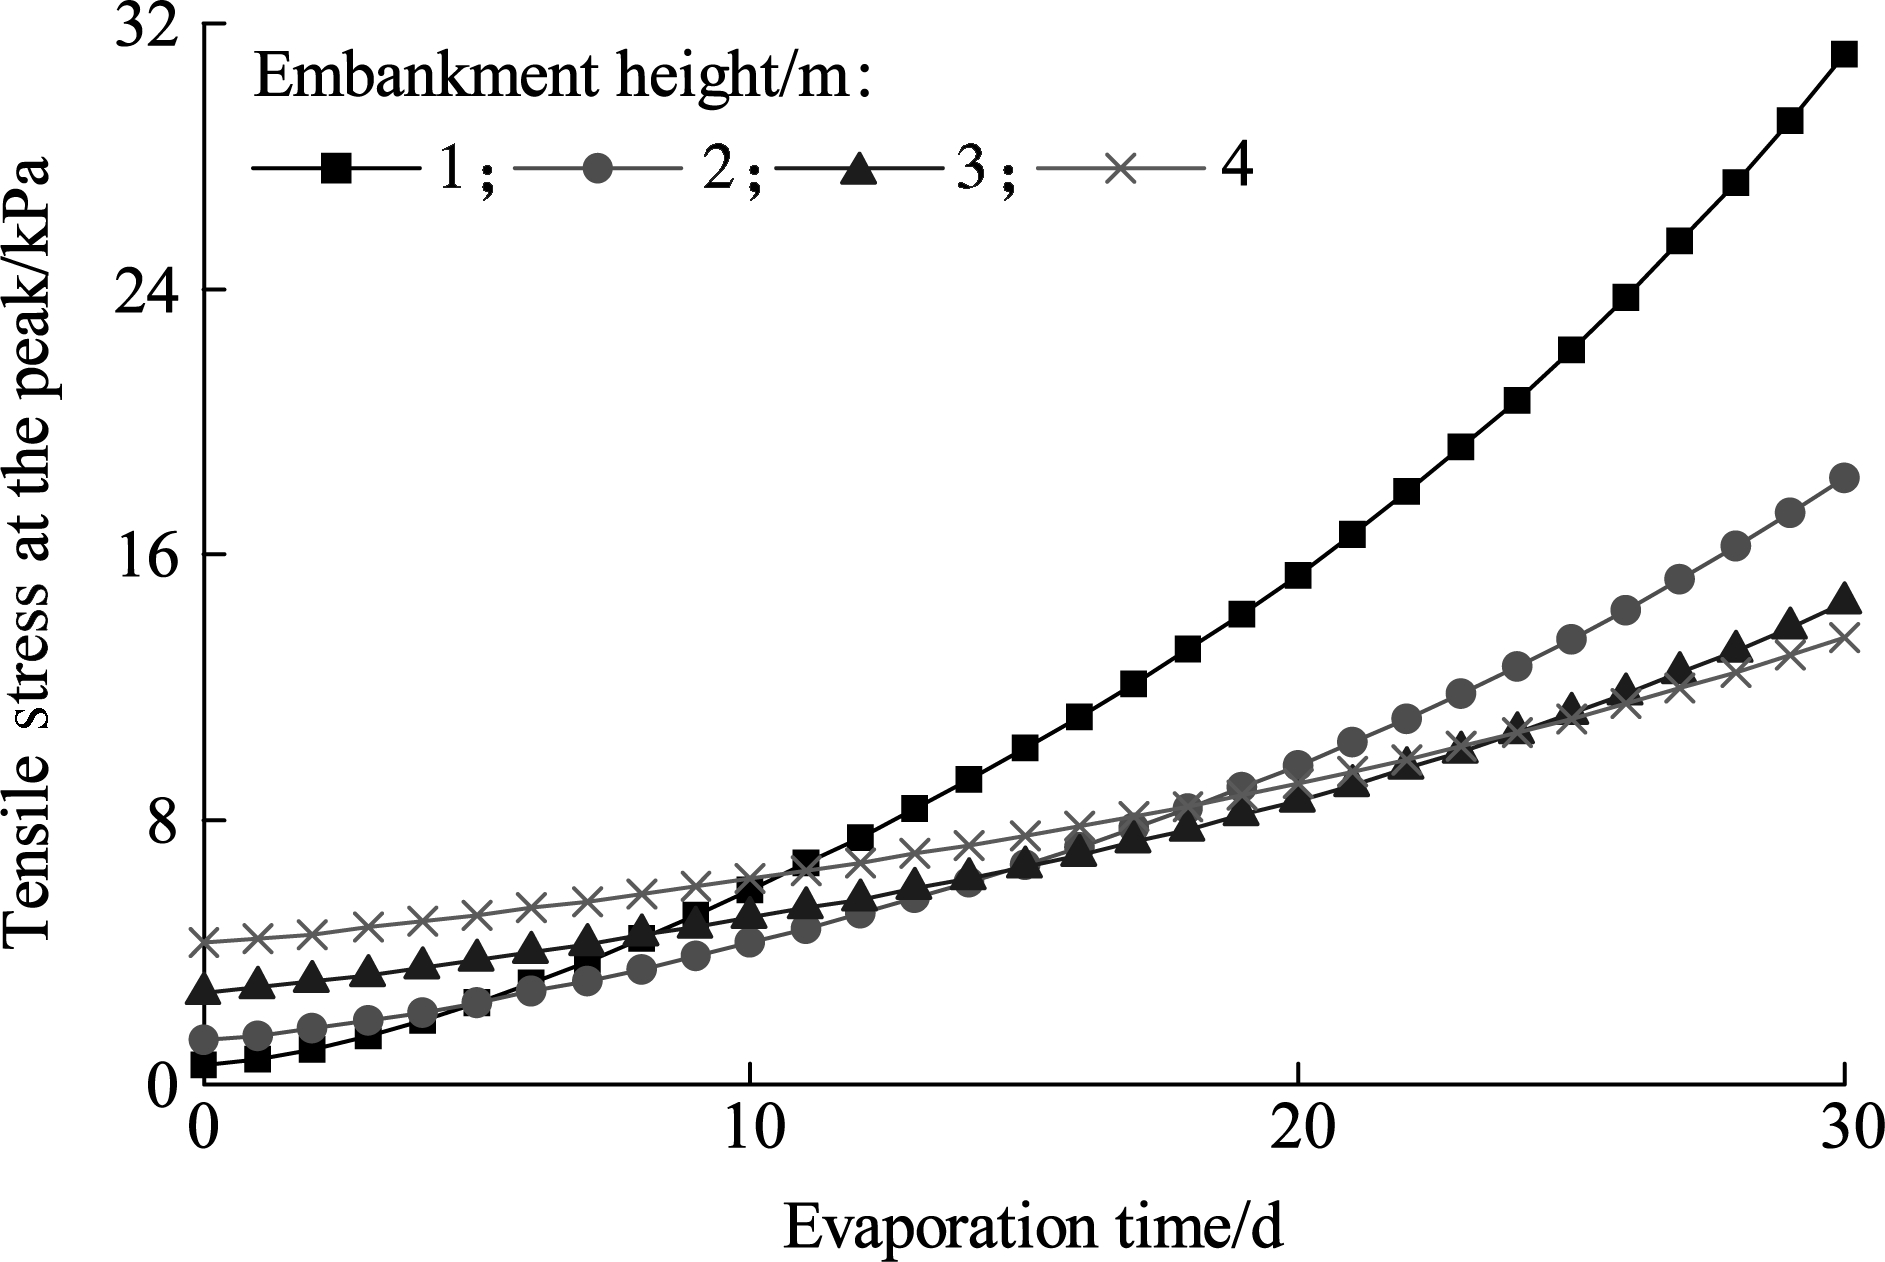
(b)
Fig.9 Influence of embankment height. (a) Location of the peak of tensile stress; (b) Effective tensile stress at the peak
1) The peak of the tensile stress on top of the embankment increases faster with the increase of foundation deformation, and its location changes gradually from the center of road to a certain site near the shoulder.
2) The boundary and spatial conditions significantly influence the peak of tensile stress and its location. The smaller the evaporation intensity, the thinner the BCS layer; the higher the embankment, the smaller the peaks of tensile stress that occur on top of the highway embankment.
3) The upper BCS layer is excavated and filled with nonexpansive soil such as gravelly soil, and a higher embankment is constructed on it, which is conducive to decreasing the embankment crack.
[1]Jahangir E, Deck O, Masrouri F. An analytical model of soil-structure interaction with swelling soils during droughts [J]. Computers and Geotechnics, 2013, 54:16-32. DOI:10.1016/j.compgeo.2013.05.009.
[2]Zheng J L, Zhang R, Yang H P. Highway subgrade construction in expansive soil areas [J]. Journal of Materials in Civil Engineering, 2009, 21(4): 154-162. DOI:10.1061/(asce)0899-1561(2009)21:4(154).
[3]Wang X F, Wang Y, Zhang Y H. Design for treatment of subgrade on black cotton soil (BCS) [J]. Highway, 2012 (9): 46-53. (in Chinese)
[4]Zhang X. Consolidation theories for saturated-unsaturated soils and numerical simulation of residential buildings on expansive soils [D]. Houston, Texas, USA: College of Engineering, Texas A& M University, 2004.
[5]Zhang Z B, Zhou H, Zhao Q G, et al. Characteristics of cracks in two paddy soils and their impacts on preferential flow [J]. Geoderma, 2014, 228-229: 114-121. DOI:10.1016/j.geoderma.2013.07.026.
[6]Galeandro A, Doglioni A, Simeone V, et al. Analysis of infiltration processes into fractured and swelling soils as triggering factors of landslides [J]. Environmental Earth Sciences, 2014, 71(6): 2911-2923. DOI:10.1007/s12665-013-2666-7.
[7]Amarasiri A L, Kodikara J K, Costa S. Numerical modelling of desiccation cracking [J]. International Journal for Numerical and Analytical Methods in Geomechanics, 2010, 35(1): 82-96. DOI:10.1002/nag.894.
[8]Shin H, Santamarina J C. Desiccation cracks in saturated fine-grained soils: Particle-level phenomena and effective-stress analysis [J]. Géotechnique, 2011, 61(11): 961-972. DOI:10.1680/geot.8.p.012.
[9]Amarasiri A L, Kodikara J K. Numerical modelling of a field desiccation test [J]. Géotechnique, 2013, 63(11): 983-986. DOI:10.1680/geot.12.p.010.
[10]Safari E, Jalili Ghazizade M, Abduli M A, et al. Variation of crack intensity factor in three compacted clay liners exposed to annual cycle of atmospheric conditions with and without geotextile cover [J]. Waste Management, 2014, 34(8): 1408-1415. DOI:10.1016/j.wasman.2014.03.029.
[11]Shi B X, Chen S S, Han H Q, et al. Expansive soil crack depth under cumulative damage [J]. The Scientific World Journal, 2014, 2014: 1-9. DOI: 10.1155/2014/498437.
[12]Tang C S, Cui Y J, Tang A M, et al. Shrinkage and desiccation cracking process of expansive soil and its temperature-dependent behavior [J]. Chinese Journal of Geotechnical Engineering, 2012, 34(12): 2181-2187. (in Chinese)
[13]Sima J, Jiang M J, Zhou C B. Numerical simulation of desiccation cracking in a thin clay layer using 3D discrete element modeling [J]. Computers and Geotechnics, 2014, 56: 168-180. DOI:10.1016/j.compgeo.2013.12.003.
[14]Peron H, Delenne J Y, Laloui L, et al. Discrete element modelling of drying shrinkage and cracking of soils [J]. Computers and Geotechnics, 2009, 36(1): 61-69. DOI:10.1016/j.compgeo.2008.04.002.
[15]Wu J H, Yuan J P, Lu T H. Analysis of initial cracking behavior of expansive soil due to moisture change stress [J]. Rock and Soil Mechanics, 2011, 32(6): 1631-1637.
[16]Fredlund D G, Morgenstern N R. Constitutive relations for volume change in unsaturated soils [J]. Canadian Geotechnical Journal, 1976, 13(3): 261-276. DOI:10.1139/t76-029.
[17]Briaud J L, Zhang X, Moon S. The shrink test — water content method for shrink and swell predictions [J]. Journal of Geotechnical and Geoenvironmental Engineering, 2003, 129(7): 590-600. DOI:10.1061/(asce)1090-0241(2003)129:7(590).
[18]van Genuchten M T. A closed form equation for predicting the hydraulic conductivity of unsaturated soils [J]. Soil Science Society of America Journal, 1980, 44(5): 892-898. DOI:10.2136/sssaj1980.03615995004400050002x.
References:
摘要:为了分析膨胀土地区路堤初始开裂行为,使用ABAQUS模拟了典型路基断面的路堤顶部张拉应力峰值和峰值位置的改变.模拟结果表明:基质吸力在膨胀土地基顶部呈凹形分布,并且引起了地基和路堤的不均匀变形.路堤顶部张拉应力峰值并非位于某一固定点,而是随着蒸发的持续逐渐朝路肩移动.蒸发强度越大,随着地表蒸发的进行,路堤顶面张拉应力峰值增大越快,其位置越靠近路肩;厚层膨胀土有助于路堤顶面张拉应力峰值快速到达其抗拉强度阈值,而膨胀土厚度小于1.5 m时,地表蒸发30天,路堤不会开裂;路堤越高,路堤顶面张拉应力峰值越小,其位置越远离路肩.因此,薄层膨胀土土层上修筑较高路堤可以减少路堤裂缝的形成.
关键词:膨胀土地基;土体收缩;固结;张拉应力;路堤开裂
中图分类号:U416
Received:2016-06-16.
Foundation item:The National Natural Science Foundation of China (No.51378121).
Citation::Cheng Yongzhen, Huang Xiaoming, Li Chang, et al. Numerical analysis of crack generation within embankment built on expansive soil foundation[J].Journal of Southeast University (English Edition),2017,33(2):224-229.
DOI:10.3969/j.issn.1003-7985.2017.02.016.
DOI:10.3969/j.issn.1003-7985.2017.02.016
Biographies:Cheng Yongzhen (1982—), male, graduate; Huang Xiaoming (corresponding author), male, doctor, professor, huangxm@seu.edu.cn.