Abstract:To explore the relationship between rear-end crash risk and its influencing factors, on-road experiments were conducted for measuring the individual vehicle trajectory data associated with novice and experienced drivers. The rear-end crash potential probability based on the time to collision was proposed to represent the interpretation of rear-end crash risk. One-way analysis of variance was applied to compare the rear-end crash risks for novice and experienced drivers. The rear-end crash risk models for novice and experienced drivers were respectively developed to identify the effects of contributing factors on the driver rear-end crash risk. Also, the cumulative residual method was used to examine the goodness-of-fit of models. The results show that there is a significant difference in rear-end risk between the novice and experienced drivers. For the novice drivers, three risk factors including the traffic volume, the number of lanes and gender are found to significantly impact on the rear-end crash risk, while significant impact factors for experienced drivers are the vehicle speed and traffic volume. The rear-end crash risk models perform well based on the existing limited data samples.
Key words:rear-end risk; novice driver; experienced driver; driving behavior
As an increasing number of Chinese people obtained their own cars and licenses, the novice driver population has taken up a considerable proportion of the licensed drivers in China. The traffic safety problem of novice and experienced drivers has become a high-priority issue for traffic engineer professionals. From this perspective, analyzing the rear-end risk of novice and experienced drivers is thus of great interest for evaluating collision potentials and designing traffic control strategies in real time.
As discussed by Weng et al.[1], there are mainly two types of data available to assess rear-end crash risk. One is historical crash data, and the other is vehicle trajectory data. It is possible that there may be no rear-end crash accident data available for traffic safety analysis for novice and experienced drivers. In this situation, vehicle trajectory data can be used as an alternative data source for the assessment of the rear-end crash risk for novice and experienced drivers. A number of studies have been conducted for the analysis of rear-end crash risk using vehicle trajectory data. For example, Ossen et al.[2] studied the car-following behaviors of individual drivers by making use of vehicle trajectory data extracted from high-resolution digital images collected at a high frequency from a helicopter. Przybyla et al.[3] developed a dynamic car-following model to estimate the probabilistic risk associated with distracted driving based on vehicle trajectory data. Oh et al.[4] developed a methodology to identify real-time rear-end collision likelihood by using inductive loop detector data.
However, it should be pointed out that these rear-end crash risk studies based on the vehicle trajectory data did not take into account the differences between novice and experienced drivers. Several studies showed that there are significant differences in car-following behavior between novice and experienced drivers due to their physical and operational characteristics[5-9]. Therefore, there is a critical need to analyze the rear-end risk for novice and experienced drivers separately.
The objective of this study is to analyze the rear-end crash risk and develop separately rear-end crash risk models for the novice and experienced drivers, which can be used to examine the relationship between the rear-end crash risk and its influencing factors, and predict the rear-end crash probabilities of novice and experienced drivers. More specifically, this study includes the following two tasks: 1) To investigate the characteristics of car-following behaviors for novice and experienced drivers; and 2) Analyze the impacts of contributing factors on rear-end risk. In this paper, the time to collision (TTC) which is a well-recognized safety indicator for traffic conflicts is selected to analyze the rear-end risk. A TTC threshold value is usually chosen to distinguish relatively safe situations from dangerous scenarios highlighting traffic conflicts.
TTC, namely, is the time remaining until a collision between two vehicles has occurred if the collision course and speed difference are maintained. The TTC can be mathematically expressed by
![]() ∀Vn>Vn-1
∀Vn>Vn-1
(1)
where Ln-1 and Ln denote the locations of the leading and subject vehicles at a particular time t, respectively;Vn-1 and Vn are the speeds of the leading and subject vehicles at the particular time t; ln-1 is the length of the leading vehicle.
According to Ref.[4], a greater possibility of crash occurrence can be measured by a TTC that is close to 0. By contrast, a larger TTC results in a lower likelihood of collision. Based on the above conditions, the potential rear-end crash risk of one driver can be measured as the probability that the TTCs are lower than a predetermined threshold value τ, which is given by
(2)
where Ri is the rear-end crash probability of the subject driver i during the survey period; Ni,TTC is the total number of TTC samples during the survey period; Ni,TTC≤τ is the total number of dangerous TTC samples with a value of τ or less.
As suggested in Refs.[10-12], 2 s is used as the TTC threshold value in this study. Statistical test techniques are used to statistically compare the difference in the mean rear-end crash risk between the novice and experienced drivers.
Next, for novice and experienced drivers, a rear-end risk model is developed to describe the meaningful relationship between rear-end crash risk and influencing factors, including environment characteristics factors, driver characteristics factors, road characteristics factors, and traffic condition factors. Each rear-end crash risk model can be expressed by
(3)
where βj, j=0,1,…,p are the coefficients of the explanatory variable xj; ε is the normally distributed random error. According to the rear-end models, the relative effects of variables on rear-end crash risk are analyzed. In addition, the cumulative residual (CURE) method, which is a well-recognized method to examine the goodness-of-fit of models in transportation studies[13-16], is conducted to evaluate the prediction performances of the rear-end models.
The field data analyzed in this paper were collected from road sections on the Longpan Road with two lanes in each direction and Zhongshan East Road with three lanes in each direction in Nanjing, China. It should be noted that the mentioned number of lanes hereinafter represents the number of lanes for single direction of the road.
2.1 Experimental equipment
The experimental equipment was mainly composed of a laser rangefinder, a GPS and a micro-computer. The laser rangefinder was used to measure the distance from the front of the following vehicle to the rear of the associated leading vehicle. The GPS can locate the position of the instrumented vehicle by measuring its latitude and longitude coordinates. The micro-computer was used as a data recording terminal. Other equipment included a video camera used to record the experimental scenario and a laptop installed the related supporting software to read data from the micro-computer. The experimental vehicle was a Ford Fox sedan. Features of this automatic transmission car include a discharge capacity of 1.8 L and a length of 4.178 m. The experimental equipment is shown in Fig.1.
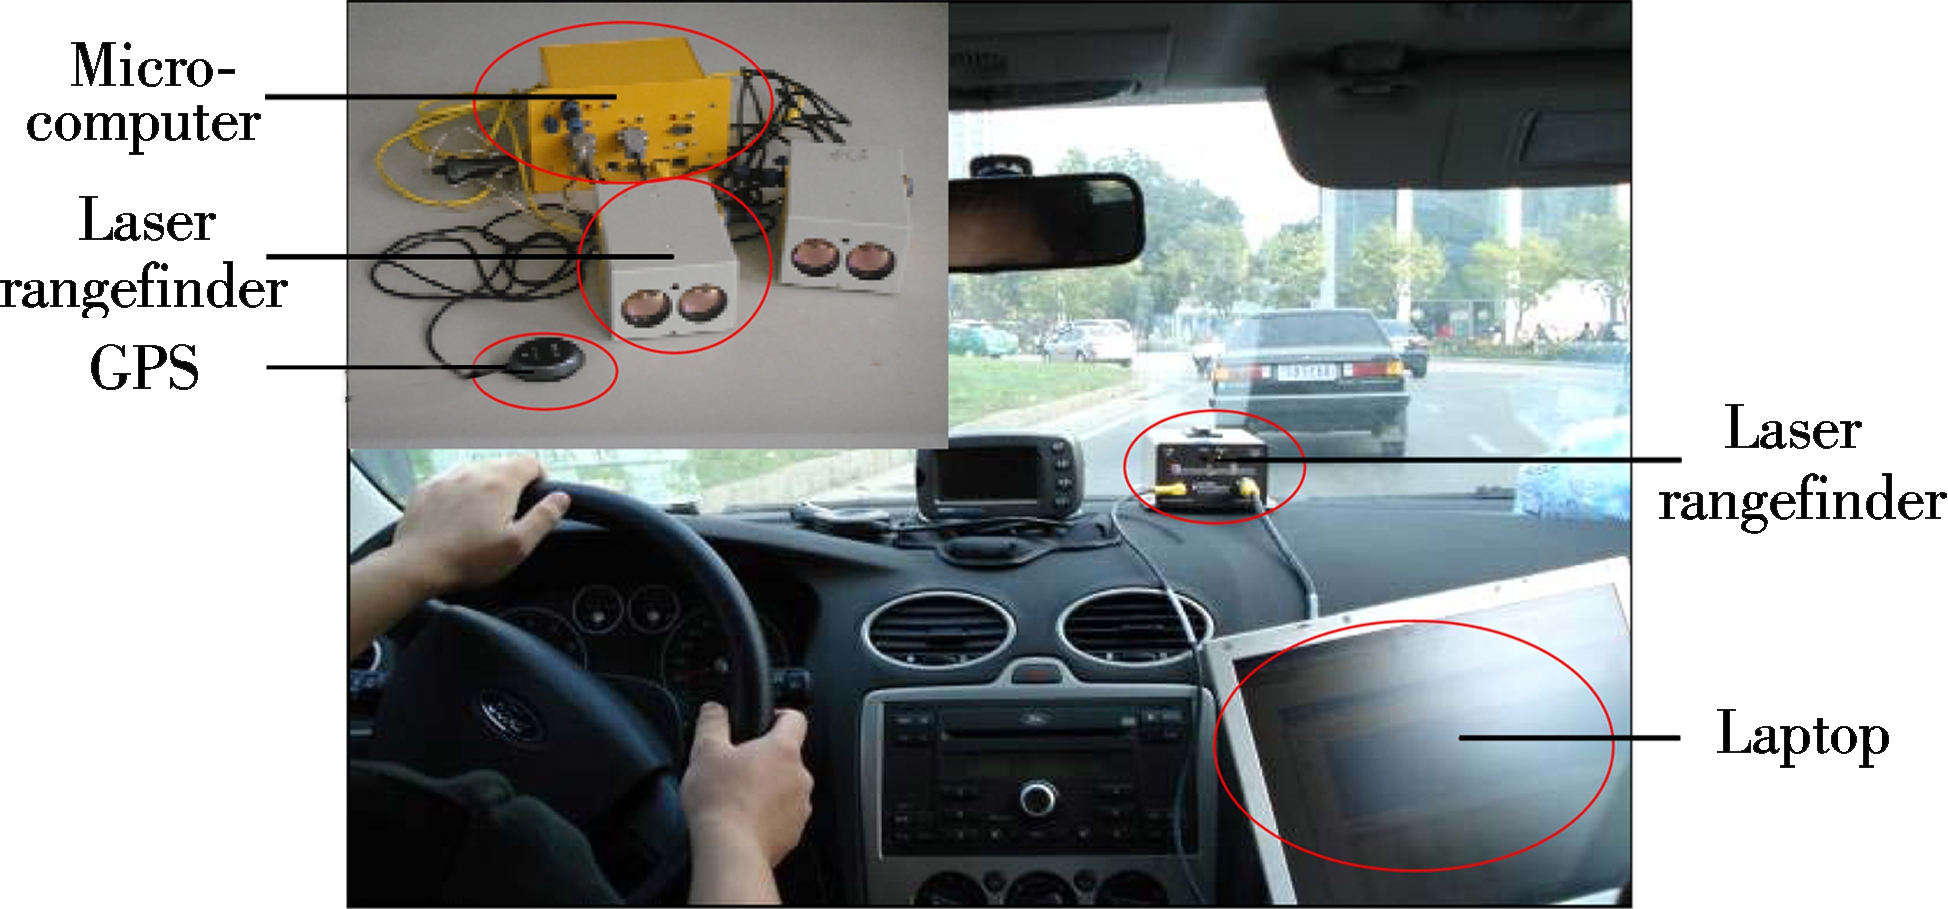
Fig.1 Experimental equipment
2.2 Experimental subjects
Subjects included 50 novice drivers and 50 experienced drivers. It should be pointed out that there is no uniform standard to distinguish between the novice and experienced drivers. In order to accurately reveal the car-following behavior of the novice and experienced drivers, two standards were used in this study to select the subjects: 1) Number of years for holding licenses and 2) Cumulative mileage. Drivers with a driving age of less than 2 years and a cumulative mileage less than 30 000 km were classified as the novice group, while drivers with the driving age more than 10 years and a cumulative mileage greater than 100 000 km were classified as the experienced group.
2.3 Experimental process
Half of the novice and experienced drivers drove the instrumented vehicle on the Longpan Road, while others drove on the Zhongshan East Road. Each subject drove on the selected route for about 45 min. In the experimental process, the following distances between the instrumented vehicle and its leading vehicle were measured by the laser rangefinder every 0.1 s, and the positions of the instrumented vehicle were located by the GPS every 0.1 s. Additionally, a video camera was used to record the traffic volume during the experimental period for each subject. Temporal trajectories of the instrumented vehicle and its following distance were immediately recorded. The raw data referred to position coordinates which were measured with high precision by GPS.
The following information was recorded for each subject in the experimental process: 1) Drivers’ individual characteristics; 2) Road characteristics; 3) Environment condition. Environment conditions include detailed information regarding the weather (clear, rain, fog, snow, and others) and the day of week (weekend, weekday). The road characteristics consist of the road surface condition (dry, wet, and others) and the number of available lanes. Driver characteristics include drivers’ age and gender.
2.4 Data pre-processing
Through the data processing proposed above, the data per second contained a following distance and two location coordinates corresponding to the instrumented vehicle and its leading vehicle. Then, we can directly calculate the speed and time gap. When the speed of the subject vehicle was higher than that of the leading vehicle at a particular time t, the TTC value can be calculated by Eq.(1). Note that the car-following state should be selected from the collected data to analyze the car-following behavior of each subject. According to the HCM2000[17], three seconds of the headway is used to identify the car-following state. This is to say, for each particular time t, if the headway is shorter than three seconds, we consider that the vehicle is in the stable car-following state. The headway can be calculated according to the relationship with gap.
(4)
Therefore, the data pre-processing for each subject mainly consists of the following four steps:1) Determine the time that the experimental vehicle is in the car-following state;2) Determine the time that the experimental vehicle is in the stable car-following state; 3) Calculate the TTC value of time which is selected by 2);4) Calculate the rear-end risk for each subject based on Eq.(2).
3.1 Statistical analysis of rear-end crash risk
Based on the collected data, one-way analysis of variance (ANOVA) is used in this paper to test whether the rear-end crash risks for novice and experienced drivers are statistically different. The statistical test results are presented in Tab.1.
As shown in Tab.1, the rear-end crash probability of novice drivers is statistically smaller than that of experienced drivers at a significance level of 0.05. The results indicate the fact that novice drivers are much more likely to maintain large TTC values compared with experienced drivers. This is mainly because the car-following behavior of the novice driver is more conservative due to a lack of driving skills, whereas the experienced drivers who have good driving skills are more likely to adopt a more aggressive attitude when traveling in car-following scenarios. Meanwhile, it is noted that the standard deviation of the novice drivers’ rear-end crash risk is significantly higher than that of the experienced drivers. It reveals that the dispersion degree of rear-end crash risk for the novice drivers is relatively higher than that of the experienced drivers.
Tab.1 Statistical comparison of rear-end crash risk for the novice and experienced drivers
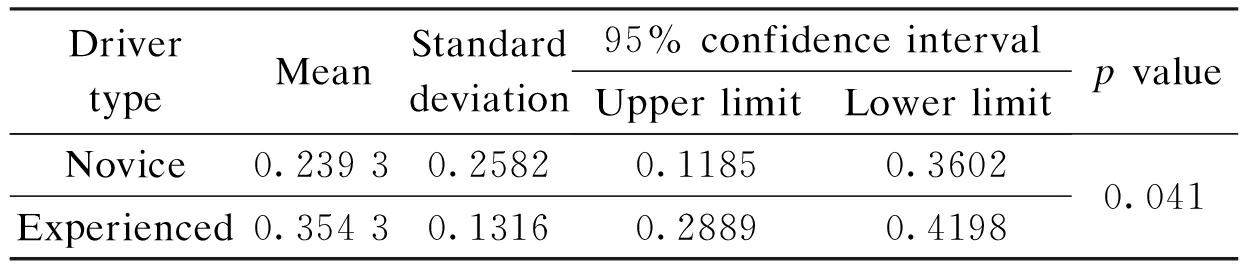
DrivertypeMeanStandarddeviation95%confidenceintervalUpperlimitLowerlimitpvalueNovice0.23930.25820.11850.3602Experienced0.35430.13160.28890.41980.041
3.2 Rear-end crash risk models
Two rear-end crash risk models are proposed, respectively, for novice and experienced drivers. Stepwise variable selection is adopted to select the explanatory variables and determine the coefficients of the selected variables for the rear-end crash risk model.
3.2.1 Rear-end crash risk model for novice drivers
Tab.2 presents the coefficients of explanatory variables which are included in the rear-end crash risk model for novice drivers. It can be seen that these three factors (traffic volume, number of lanes, gender) significantly impact on the rear-end crash risk for novice drivers. According to Tab.2, the rear-end crash risk model for novice drivers can be expressed as
RN=e-4.456+0.001x1+0.693x2-0.444x3
(5)
where RN denotes the rear-end crash risk of novice drivers; x1,x2,x3, respectively, denotes the explanatory variables of the traffic volume, number of lanes and gender. Note that the rear-end crash risk model is valid subject to three conditions: 1 338 veh/h≤x1≤3837 veh/h, 2≤x2≤3,1≤x3≤2 because the observed traffic volume, number of lanes and gender data are within these three ranges, respectively. As can be seen from Fig.2, the model has reasonable goodness-of-fit to field data.
The relative effects of variables on rear-end crash risk for novice drivers can be calculated by the model shown by Eq.(5). The estimated coefficient of the traffic volume is positive and statistically significant at the 0.10 level. This suggests that rear-end crash risk for the novice driver increases with the traffic volume. Specifically, a 1% increase in the average traffic volume of subjected novice drivers will increase the rear-end risk likelihood by 1.92%. This result is not surprising because the average gap between two vehicles becomes shorter as the number of vehicles per lane increases, which eventually increases the occurrence likelihood of rear-end crashes. The number of lanes is positively associated with the rear-end crash risk of novice drivers. It implies that rear-end crash risk for novice drivers on a road with two lanes is lower than that on a road with three lanes. In addition, the estimated coefficient of gender is negative, indicating that a male novice driver is strongly associated with higher rear-end crash risk. More specifically, a male novice driver (x3=1) has approximately two times the rear-end crash risk compared with a female novice driver (x3=2). This finding is reasonable due to the adventurous spirits of males.
Tab.2 Results of the rear-end crash risk model for novice drivers
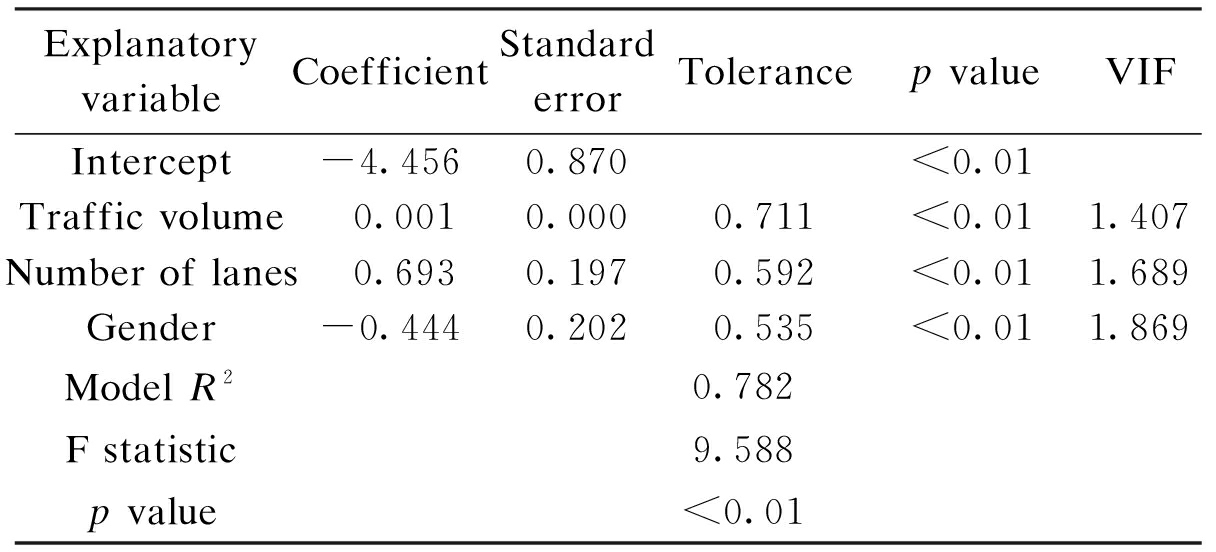
ExplanatoryvariableCoefficientStandarderrorTolerancepvalueVIFIntercept-4.4560.870<0.01Trafficvolume0.0010.0000.711<0.011.407Numberoflanes0.6930.1970.592<0.011.689Gender-0.4440.2020.535<0.011.869ModelR20.782Fstatistic9.588pvalue<0.01
Note: VIF represents the variable inflation factor which quantifies the severity of multicollinearity.
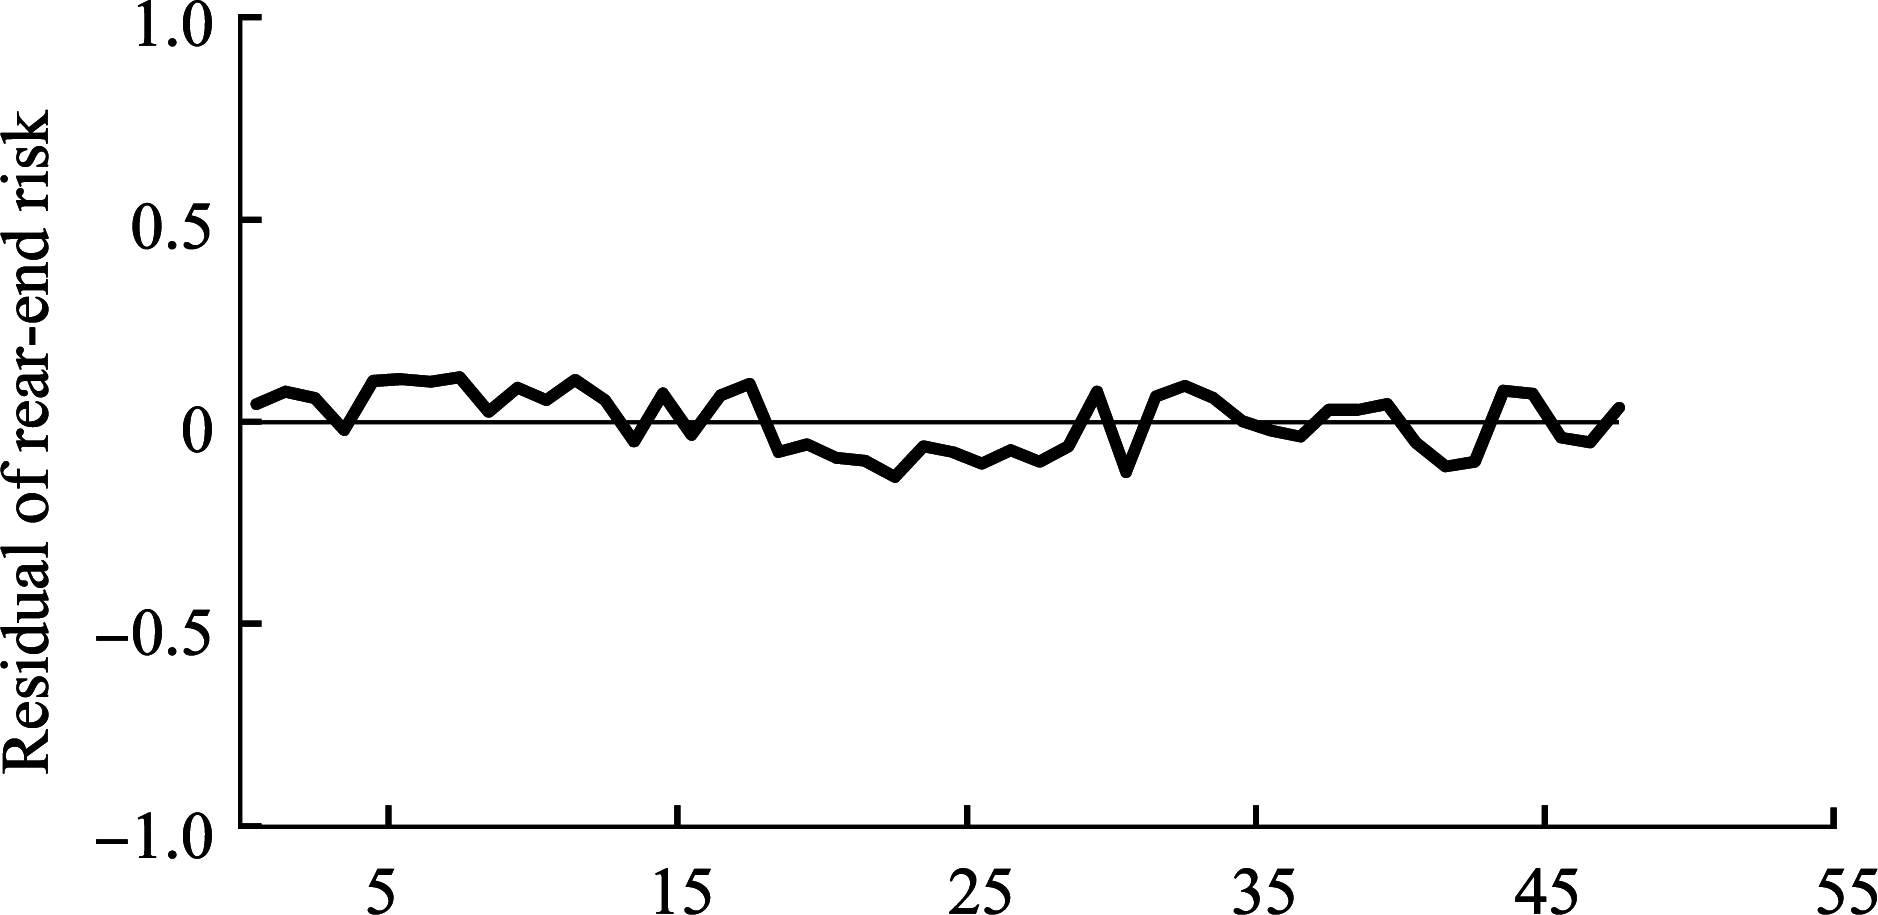
Fig.2 Plot of cumulative residuals against the rear-end risk model for novice drivers
3.2.2 Rear-end crash risk model for experienced drivers
The results of the rear-end crash risk model for experienced drivers are shown in Tab.3. The explanatory variable vehicle speed and traffic volume are selected to build this model. In comparison with the novice driver, the explanatory variable number of lanes and gender are not statistically significant. The rear-end crash risk model for the experienced driver can be expressed as follows:
RE=e-1.299-0.069x1+0.001x2
(6)
where RE denotes the rear-end crash risk of experienced drivers; x1 and x2, respectively, denote the explanatory vehicle speed and variable traffic volume. It should be noted that the rear-end crash risk model shown by Eq.(6) is valid subject to two conditions: 16.9 km/h≤x1≤45.4 km/h, 1 368 veh/h≤x2≤3 135 veh/h. The cumulative residual plot of the rear-end risk model for experienced drivers is shown in Fig.3. It shows that the predictive performance of the model is reasonably good.
Tab.3 Results of the rear-end crash risk model for experienced drivers
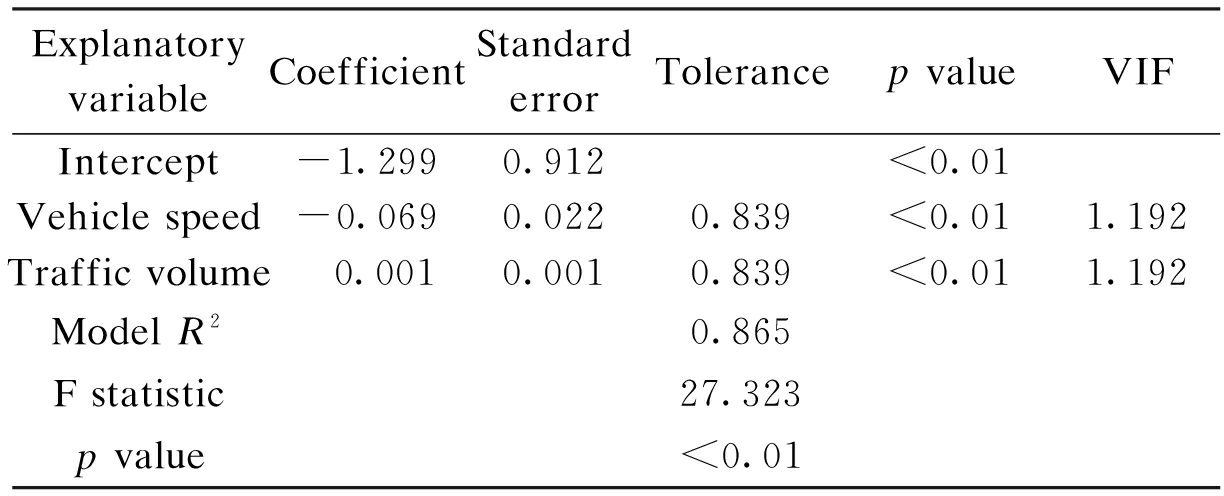
ExplanatoryvariableCoefficientStandarderrorTolerancepvalueVIFIntercept-1.2990.912<0.01Vehiclespeed-0.0690.0220.839<0.011.192Trafficvolume0.0010.0010.839<0.011.192ModelR20.865Fstatistic27.323pvalue<0.01
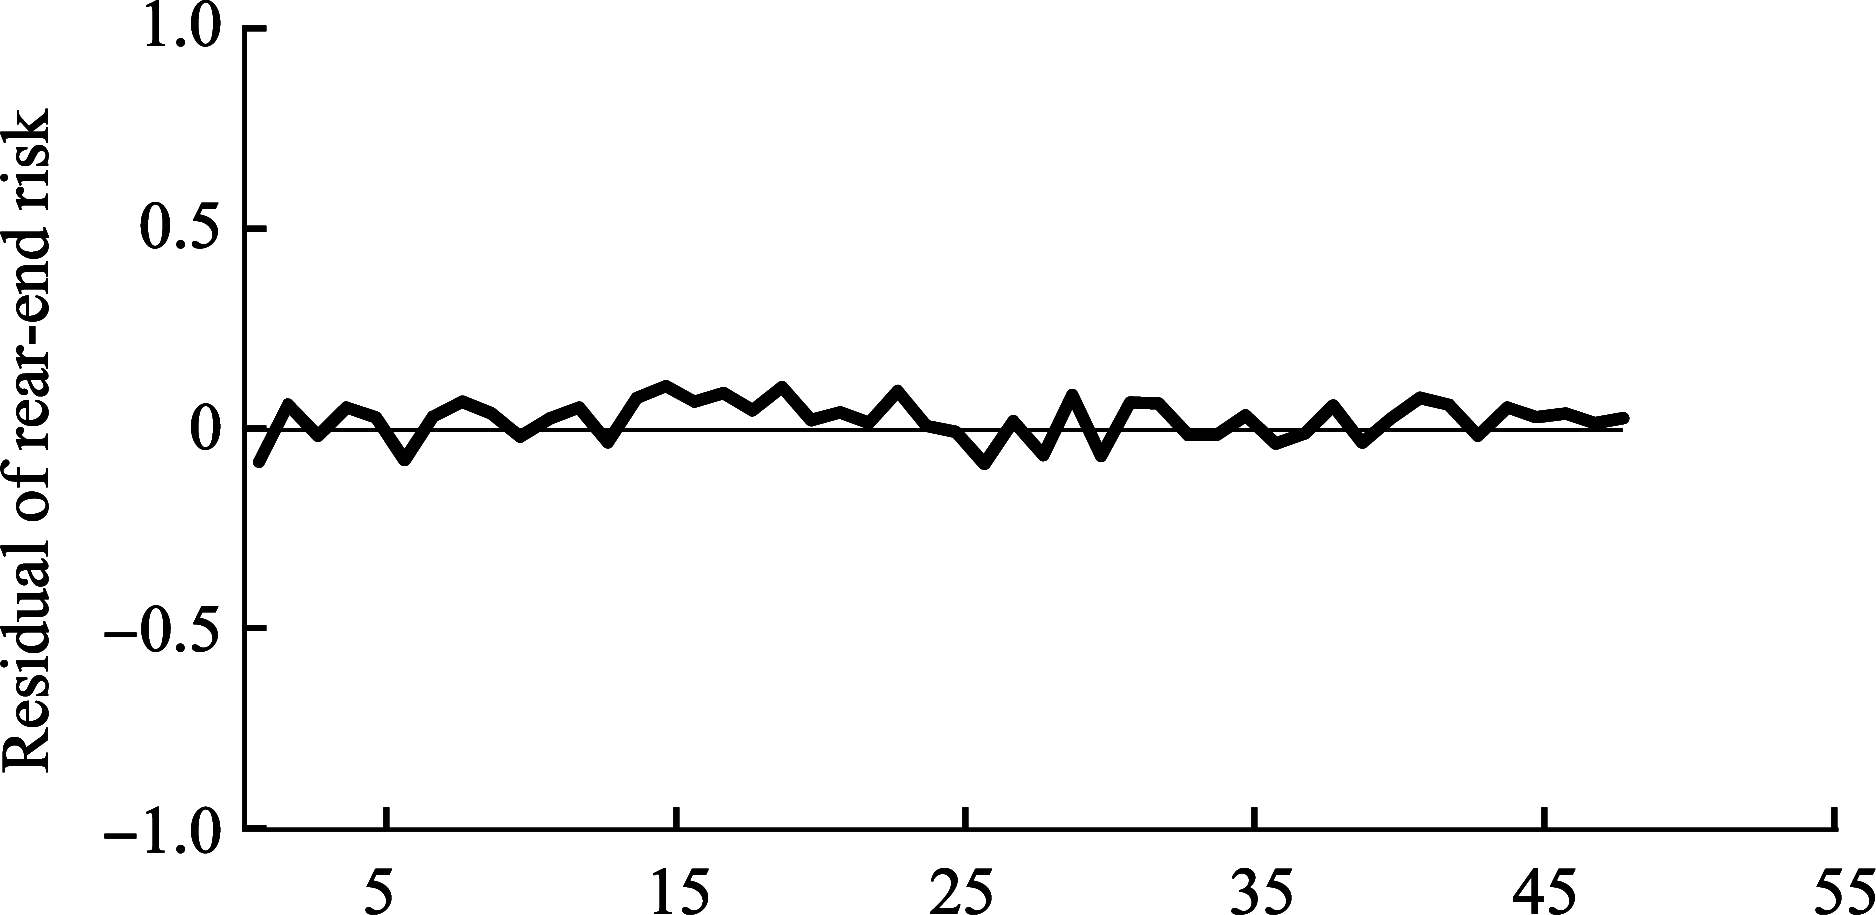
Fig.3 Plot of cumulative residuals against the rear-end risk model for experienced drivers.
According to Eq.(6), the relative effects of variables on the rear-end crash risk for the experienced driver can be calculated. The coefficient of the vehicle speed is negative and statistically significant at the 0.10 level, suggesting that an experienced driver driving at high speed is strongly associated with a higher rear-end crash risk. Similar to the novice driver, rear-end crash risk for the experienced driver is also adversely affected by the traffic volume.
Taking the differences in car-following behaviors between the novice and experienced drivers into account, a methodology is proposed to analyze the rear-end crash risk and the risk factors are investigated for these two driver types based on the individual vehicle trajectory data obtained by on-road experiments. The statistical test results show that experienced drivers have a higher rear-end crash risk than those of novice drivers.
The rear-end crash risk model is respectively developed for novice and experienced drivers in an attempt to investigate the relationship between rear-end crash risk and its influencing factors. According to the model results, three factors (traffic volume, number of lanes, gender) are found to significantly impact on the rear-end crash risk for novice drivers, while the vehicle speed and traffic volume are significant impact factors for experienced drivers. The results of cumulative residual test indicate that the proposed rear-end crash models perform well. The findings of this research can be very useful for driving education, particularly, for rear-end crash prevention.
It should be pointed out that the analysis with limited data samples in this study may not be adequate to validate the relationship between rear-end crash risk and its influencing factors. A further study with more data is needed to further calibrate the relationship.
[1]Weng J, Meng Q, Yan X. Analysis of work zone rear-end crash risk for different vehicle-following patterns[J]. Accident Analysis and Prevention, 2014, 72:449-457. DOI:10.1016/j.aap.2014.08.003.
[2]Ossen S, Hoogendoorn S P. Car-following behavior analysis from microscopic trajectory data[J]. Transportation Research Record: Journal of the Transportation Research Board, 2005, 1934:13-21.
[3]Przybyla J, Taylor J, Jupe J, et al. Estimating risk effects of driving distraction: A dynamic errorable car-following model[J]. Transportation Research Part C: Emerging Technologies, 2015, 50: 117-129. DOI:10.1016/j.trc.2014.07.013.
[4]Oh C, Kim T. Estimation of rear-end crash potential using vehicle trajectory data[J]. Accident Analysis and Prevention, 2010, 42(6):1888-1893. DOI:10.1016/j.aap.2010.05.009.
[5]Jiang J, Lu J. Car-following behavior of Chinese drivers’[C]//Transportation Research Board 94th Annual Meeting. Washington, DC,USA, 2015:15-1729.
[6]Zhang M H, Jiang Z H, Zhang Q. Study on novice drivers’ fixation features under different car-following risk levels[J]. Advanced Materials Research, 2014(1037): 481-485. DOI:10.4028/www.scientific.net/amr.1037.481.
[7]Alberti C F, Shahar A, Crundall D. Are experienced drivers more likely than novice drivers to benefit from driving simulations with a wide field of view?[J]. Transportation Research Part F: Traffic Psychology and Behaviour, 2014, 27: 124-132. DOI:10.1016/j.trf.2014.09.011.
[8]Lu J, Zhang W J, Yang H F, et al. Analysis of rear-end risk based on the indicator of time to collision[J]. China Journal of Transportation Information and Safety, 2014, 32(5): 58-64. (in Chinese)
[9]Lu J, Li Y P, Yang H F. Safety evaluation of the car-following behavior between the experienced and inexperienced drivers [J]. China Journal of Transportation Information and Safety, 2014, 32(5): 25-29. (in Chinese)
[10]Vogel, K. A comparison of headway and time to collision as safety indicators[J]. Accident Analysis and Prevention, 2003, 35(3): 427-433. DOI:10.1016/s0001-4575(02)00022-2.
[11]Minderhoud M M, Bovy P H L. Extended time-to-collision measures for road traffic safety assessment[J]. Accident Analysis and Prevention, 2001, 33(1): 89-97. DOI:10.1016/s0001-4575(00)00019-1.
[12]Meng Q, Qu X. Estimation of rear-end vehicle crash frequencies in urban road tunnels[J]. Accident Analysis and Prevention, 2012, 48: 254-263. DOI:10.1016/j.aap.2012.01.025.
[13]Kononov J, Durso C, Lyon C, et al. Level of service of safety revisited[J]. Transportation Research Record: Journal of the Transportation Research Board, 2015, 2514: 10-20. DOI:10.3141/2514-02.
[14]Jafari R, Hummer J E. Safety effects of access points near signalized intersections[C]//Transportation Research Board 92th Annual Meeting. Washington DC, USA, 2013:13-1218.
[15]Vangala P, Lord D, Geedipally S R. An application of the negative binomial-generalized exponential model for analyzing traffic crash data with excess zeros[C]//Transportation Research Board 92th Annual Meeting. Washington DC, USA, 2015:15-3383.
[16]Troyer D, Bradbury K, Juliano C. Strength of the variable: Calculating and evaluating safety performance function calibration factors for the State of Ohio[J]. Transportation Research Record: Journal of the Transportation Research Board, 2015, 2515: 86-93. DOI:10.3141/2515-12.
[17]National Research Council. Highway capacity manual 2000[R]. Washington DC, USA: Transportation Research Board, 2000.
References:
摘要:以探究专业及非专业驾驶人追尾碰撞风险影响因素为目的,通过采集真实道路环境下专业及非专业驾驶人跟驰行为轨迹数据,基于碰撞时间提出了表征追尾碰撞风险程度的追尾碰撞风险概率计算方法.利用单因素方差分析法对专业与非专业驾驶人追尾碰撞风险进行对比分析,并分别建立了专业与非专业驾驶人追尾碰撞风险模型,以识别专业与非专业驾驶人追尾碰撞风险影响因素,此外,基于累计残差法检验了模型的拟合优度.结果表明,专业及非专业驾驶人追尾碰撞风险存在显著差异.交通量、车道数及性别对非专业驾驶人追尾碰撞风险影响显著,而专业驾驶人追尾碰撞风险受车辆速度和交通显著影响.基于现有实验数据建立的驾驶人追尾碰撞风险模型具有较高的拟合优度.
关键词:追尾风险;非专业驾驶人;专业驾驶人;驾驶行为
中图分类号:U491
Received:2016-09-23.
Foundation item:The National Natural Science Foundation of China (No.51478110).
Citation::Li Yaping, Lu Jian.Analysis of rear-end risk for driver using vehicle trajectory data[J].Journal of Southeast University (English Edition),2017,33(2):236-240.
DOI:10.3969/j.issn.1003-7985.2017.02.018.
DOI:10.3969/j.issn.1003-7985.2017.02.018
Biographies:Li Yaping (1990—),female, graduate; Lu Jian (corresponding author), male, doctor, professor, lujian-1972@seu.edu.cn.