Abstract:In order to evaluate the service level of roundabouts intuitively, a new delay model of signalized roundabouts is established. According to traffic flow characteristics in the signalized roundabout, vehicle delays on roundabouts are divided into two parts: entrance delay and circulating lane delay. Entrance delay is calculated by the delay model in HCM2010. Circulating lane delay is studied by analyzing conflict behavior in signalized roundabouts, and the delay models of traffic flows turning in different directions are established based on the motorcade analysis method. Finally, the simulation software Vissim, calibrated with field data, is used to verify the model. The simulation results show that the average relative error of the model is 10.1%, meeting the accuracy requirements. Therefore, the delay model properly reflects the operation efficiency of a roundabout, and can thus provide a scientific basis for the design of control schemes.
Keywords:roundabout; signal control; delay; motorcade analysis method
Roundabouts play an important role in cities’ transportation development. However, with the increase in road traffic demand, the efficiency of roundabouts is decreasing. In order to improve the traffic situation on roundabouts, signal controls may be adopted to make full use of the roundabout’s resources in time and space. The signal control method can alleviate congestion on a roundabout under certain conditions, and delay analyses of roundabouts help to evaluate the control schemes and improve upon them.
According to the form of control used, the time resource allocation methods of roundabouts can mainly be divided into three types: 1) Signal controls for entering vehicles only, 2) Signal controls for entering vehicles and circulating vehicles in the roundabout and 3) Coordinated control of the roundabout and the adjacent intersections. The first control method is derived from the routine intersection. Bapat[1]introduced the signal control to London roundabouts. Wang et al.[2-3]compared the performance of roundabouts with different demands and with or without signals. Dong[4]analyzed the control method for roundabouts, and used time and space optimization in the timing. The main results of the second type of control method are as follows. Yang et al.[5]proposed the control method of left-turn vehicles with two stops and a corresponding timing optimization method. Yang et al.[6]pointed out the possibility that traffic flow in opposing directions might not be released at the same time. Maher[7]used a cross-entropy method to solve the signal optimization problem for roundabouts. Ma et al.[8]adopted a comprehensive optimization method to solve the timing parameters. For the third set of control methods, Hallmark et al.[9]designed corresponding simulation scenes for different types of traffic. Liu[10]separated the traffic flow on each branch of the roundabout through coordination control of upstream signal-controlled intersections.
Based on the above analyses, the following conclusions can be drawn: The first method only performs signal control for entering vehicles. It cannot completely eliminate traffic conflicts. The second method can reduce the conflicts within the roundabout to a certain extent. However, the multi-signal method can easily cause problems for the drivers. The third kind of control method requires the development of specific schemes for specific environments, so its applicability is not good. However, in domestic engineering practice, a large number of roundabouts are still following the routine intersection approach, with signal controls for entering vehicles only.
Research on the delay at roundabouts is as follows. Troutbeck et al.[11]analyzed the headway characteristics in stable flow and established a delay model for non-signalized roundabouts. Qu et al.[12]used the probability theory to analyze the effect of mixed traffic flow on the delay at roundabouts. Flannery et al.[13-14]developed models for vehicle delay and queue length. Ištoka Otkovi![]() et al.[15-16]compared the efficiency at signalized and non-signalized roundabouts and signalized intersections. Chang et al.[17]studied the effect of traffic flow, flow rate and other factors on the average delay. Gandhi et al.[18]applied empirical regression models and developed models of roundabout delay. Most existing delay models have been established for non-signalized roundabouts. However, the conflict characteristics, both at the entrance to and within signalized roundabouts, are significantly different to those of non-signalized roundabouts. Thus, delay models for non-signalized roundabouts do not apply to signalized roundabouts and it is necessary to establish delay models for signal-controlled roundabouts.
et al.[15-16]compared the efficiency at signalized and non-signalized roundabouts and signalized intersections. Chang et al.[17]studied the effect of traffic flow, flow rate and other factors on the average delay. Gandhi et al.[18]applied empirical regression models and developed models of roundabout delay. Most existing delay models have been established for non-signalized roundabouts. However, the conflict characteristics, both at the entrance to and within signalized roundabouts, are significantly different to those of non-signalized roundabouts. Thus, delay models for non-signalized roundabouts do not apply to signalized roundabouts and it is necessary to establish delay models for signal-controlled roundabouts.
Based on this background information, the delay at a roundabout is divided into the entrance delay and the circulating lane delay, according to the operating characteristics of the traffic at a signal-controlled roundabout[19-20]. For the two types of delay, the calculation method of HCM2010[21]and the motorcade analysis method[22]are applied to establish the delay model. In this way, a complete delay model of a signalized roundabout is determined. Finally, the parameters for the simulation software are calibrated according to survey data and the delay model is validated.
The operating behavior at a roundabout is different from that at a normal intersection. At a roundabout, vehicles travel in a counter-clockwise direction, and exit at different points around a central island. In China, the roundabouts are often located on main roads with multiple lanes, and the traffic flow is very heavy. With the increase in traffic demand, the capacity of non-signalized roundabouts can no longer meet that demand. So in many traffic management cases, setting up signal controls is used to ease the traffic congestion at roundabouts.
1.1 Analysis of the characteristics of traffic flow in signalized roundabouts
Signalized roundabouts can reduce the frequency and severity of conflicts compared with non-signalized roundabouts. In order to eliminate the conflict, suitable signal plans are necessary due to roundabouts’ geometrical properties. The method of single-branch release can avoid vehicle conflict at roundabouts, but greatly reduces efficiency, so it is seldom used. Multi-branch release at the same time causes some conflicts. Moreover, the conflicted flow at a roundabout is determined by the signal control scheme. With a different release order, the traffic flow conflict will be different.
In a signalized roundabout, conflicts will exist when two or more branches of the traffic flow enter the roundabout at the same time. In order to achieve a clearer analysis of vehicle operation and conflict in a roundabout, this paper sets up a specific traffic environment as follows: In a roundabout with four branches and three circulating lanes, the signal control scheme is a two-phase control. It is assumed that, in this roundabout, right-turning vehicles drive in the outside lane, and have no conflict with other traffic. Then, vehicle operation within the signal control of the roundabout is divided into three stages: the red time, the early green time and the later green time. As shown in Fig.1, the traffic flows in Branches 2 and 4 are released simultaneously in the green time. In the following, we explain the definition of each time period, using Branch 2 as an example. The red time is the time period during which the red lights at Branches 2 and 4 are turned on and the vehicles are prohibited from passing. The early green time is the time period during which the green light is turned on, up until the point at which the traffic flow from Branch 2 conflicts with the flow from Branch 4. The later green time is the time from the beginning of the conflict to the end of the green light phase.
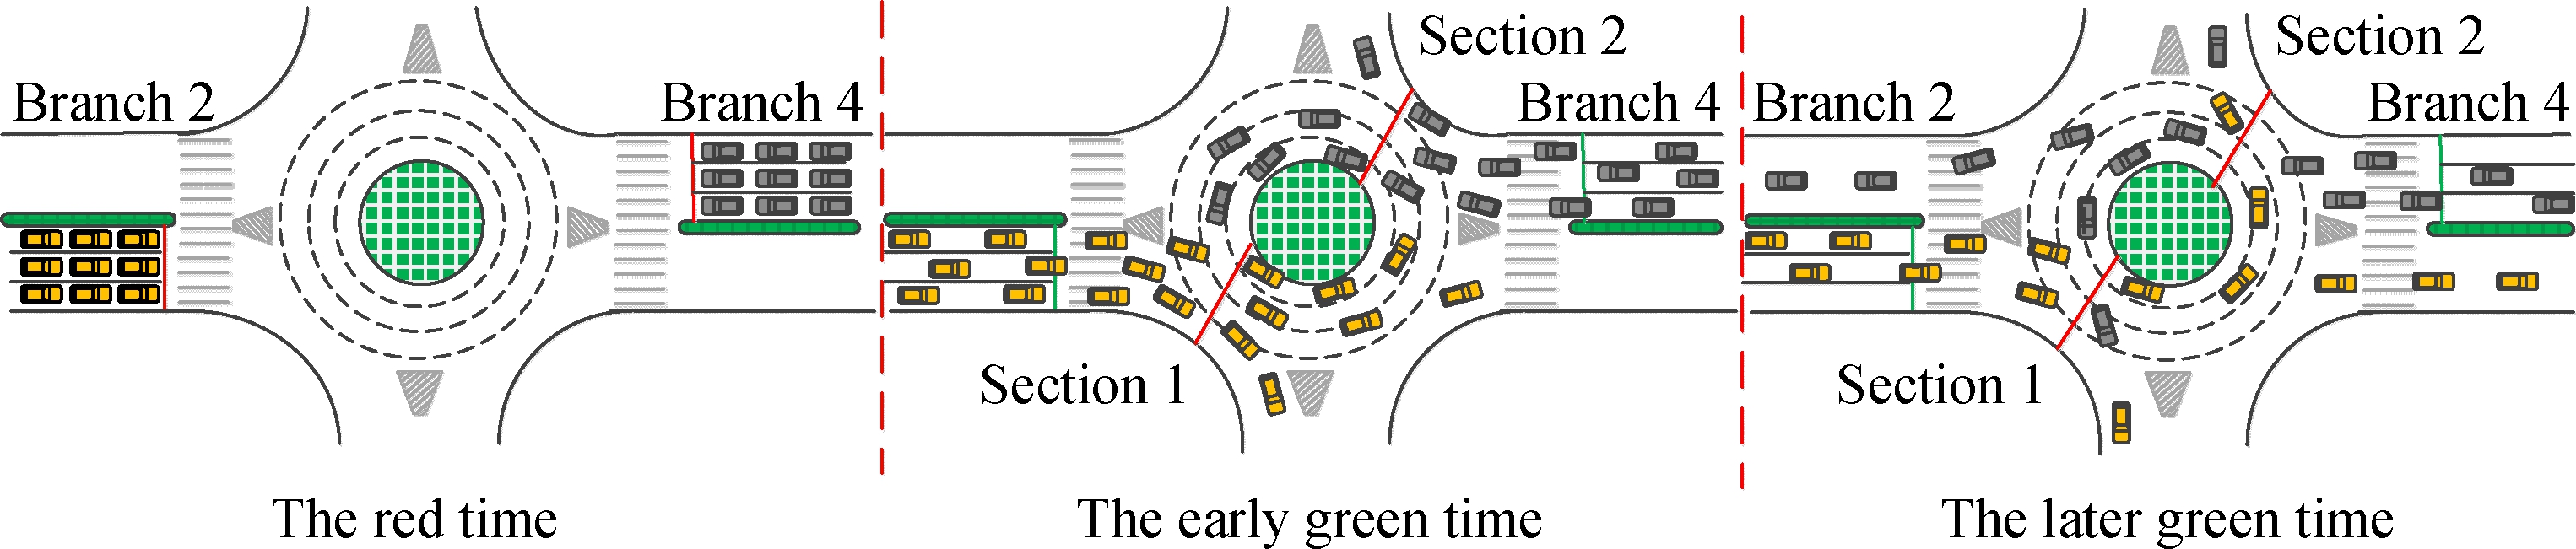
Fig.1 Diagram of vehicle operation at the signalized roundabout
As shown in Fig.1, Section 1 and Section 2 are the conflict sections in the case where Branches 2 and 4 are released at the same time. In the red time, all vehicles are waiting at the stop line, and the delay is called the entrance delay. In the early green time, the right-turning vehicles and straight flow of Branch 2 go through Section 1 with no conflict, thus having no delay. However, the left-turning vehicles will conflict with the traffic from Branch 4 in Section 2. In the later green time, as a result of left-turning vehicles from Branch 4 having reached Section 1, vehicles going through Section 1 are delayed (except those turning right). Delay within the roundabout during the green time is called circulating lane delay. Therefore, the vehicle delay in the signalized roundabout mainly consists of two parts: 1) The entrance delay, a fixed delay caused by the signal control; 2) The circulating lane delay caused by the interaction between traffic flows in the circulating lane.
1.2 Entrance delay
The entrance delay at the roundabout is the same as at the common signalized intersection. It is affected by the signal cycle, the green ratio, the saturation flow rate of the incoming road and the volume on the incoming road. Therefore, the entrance delay of the signalized roundabout is calculated using the formula in HCM2010. The average delay at the entrance to the roundabout can thus be written as

(1)
whereXis the saturation of the lane group;Cis the signal cycle,s;cis the traffic capacity of the lane group;gis the effective green time of the lane group,s;Tis the duration time of analysis, s.
1.3 Circulating lane delay
Section 1.1 shows that the circulating lane delay occurs during the green time, and different turning movements cause different conflicts in different time periods. Therefore, the analysis of the circulating lane delay will be discussed separately with respect to the early and later green time.
In the early green time, the traffic flow of Branch 2 reaches Section 1 first, and then the left-turning vehicles of Branch 4 arrive at Section 1 after timeT. In the early green time, vehicles from Branch 2 are released with a saturated flow rate. If the saturated headway is defined ast0, then the number of vehicles from Branch 1 going through Section 1 isQT. As shown in Fig.2, the part of the traffic flow has no conflicts with other vehicles, so their delay in Section 1 is zero.![]() is the number of left-turning vehicles within the total numberQT. The part of the traffic flow from Branch 2 will come into conflict with the traffic from Branch 4 in Section 2, resulting in delays.
is the number of left-turning vehicles within the total numberQT. The part of the traffic flow from Branch 2 will come into conflict with the traffic from Branch 4 in Section 2, resulting in delays.
QT=![]() m
m
(2)
T=![]()
(3)
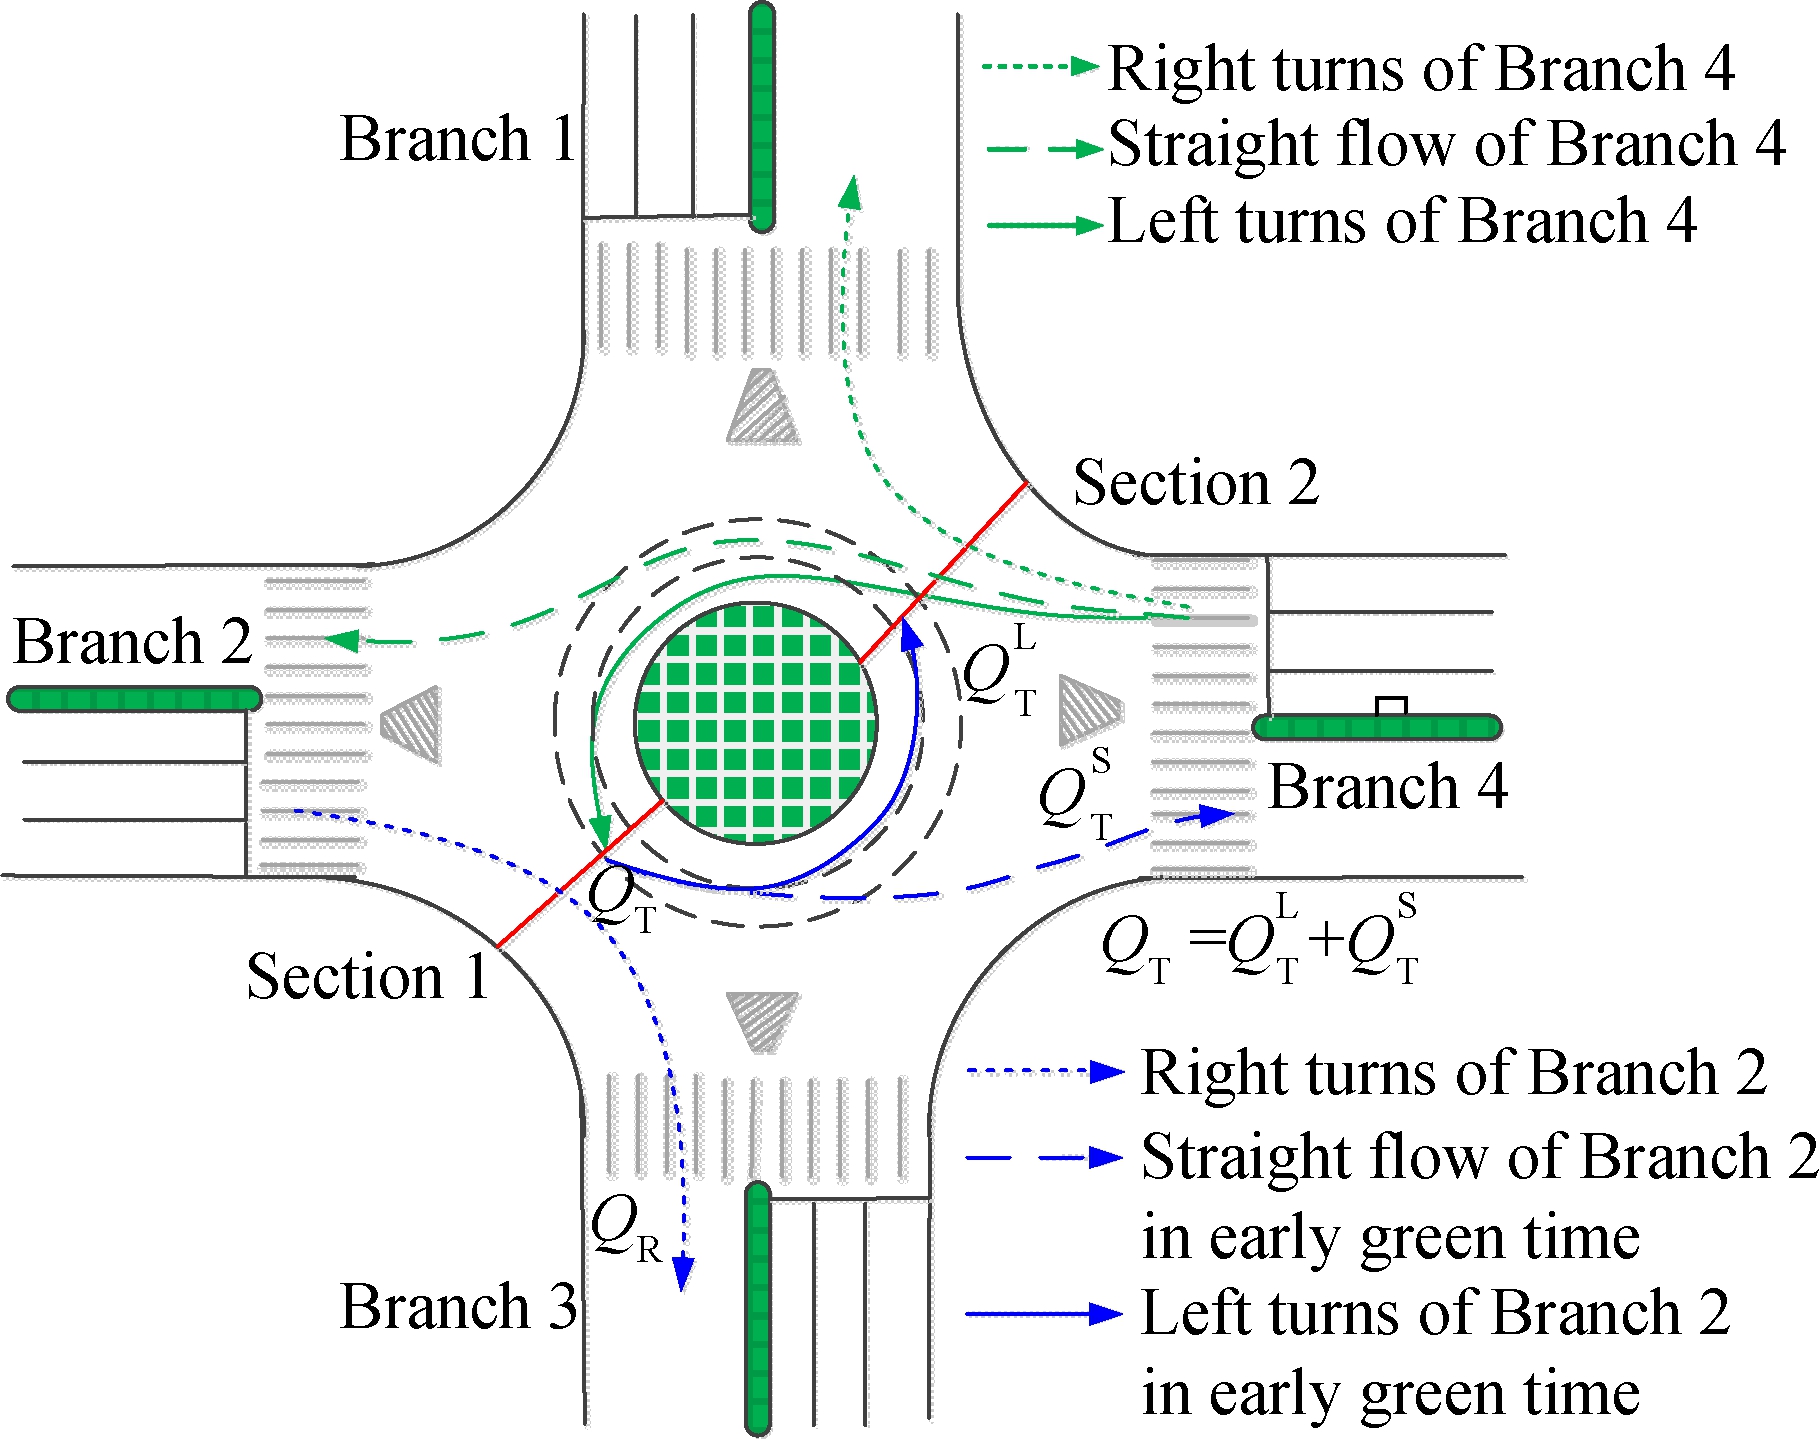
Fig.2 Schematic view of Branch 2 traffic operations in the early green time
wheremis the number of lanes;Ris the radius of the roundabout, m;vis the average speed of vehicles on the roundabout, m/s.
In the later green time, the traffic flows from Branches 2 and 4 come into conflict. In order to describe this simply, the traffic flow from Branch 2 going straight on or turning left is called Traffic A (QTis not included in this part), and the left-turning vehicles from Branch 4 are called Traffic B in the following, as shown in Fig.3. Traffic A and B interact and produce delays in the later green time. The motorcade analysis method is used to analyze the average delay for Traffic A and B. The motorcade here is generalized. It can be a motorcade with the same or different time headways, and can also be a single car (in this case the length of the motorcade will be 1).
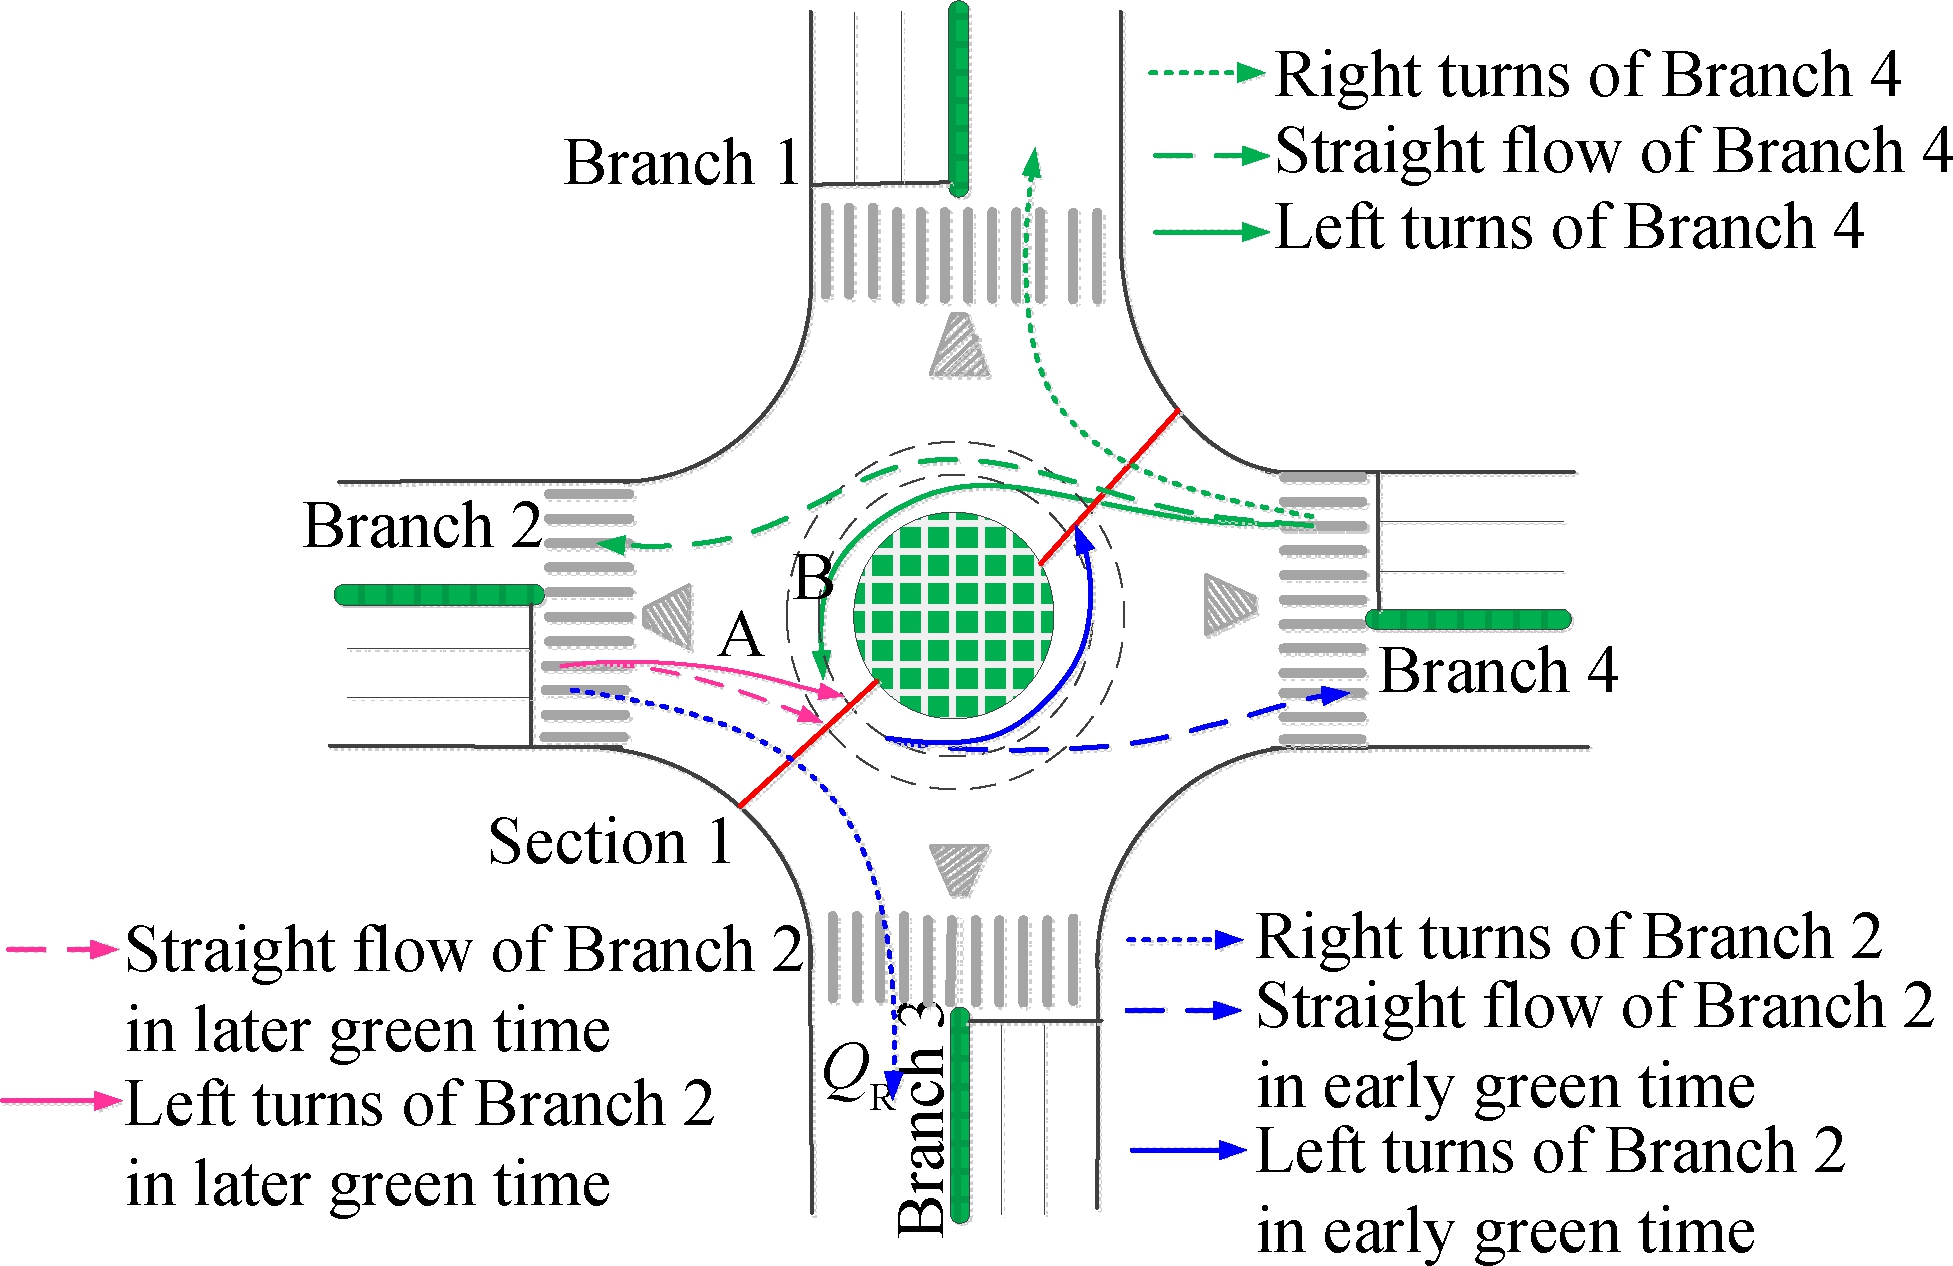
Fig.3 Schematic view of Traffic A and B in early green time
Assume that the arrival rates of Traffic A and B areqAandqB, and the number of of Traffic A released by the saturated flow rate isNSA. Thus,NSAis the amount of traffic that arrives in the period of time when Traffic B has passed and Traffic A is released at the saturated flow rate. This can be expressed as
NSA=TSAQSA=(TB+TSA)qA
(4)
whereNSAis the number of vehicles which traffic A released with a saturated flow rate when the motorcade passed alternately, pcu;TSAis the release time for Traffic A at the saturated flow rate, s;QSAis the saturation flow rate of Traffic A per lane, pcu/s;TBis the transmit time of Traffic B; andqAis the arrival rate of Traffic A, pcu/s. Then,
TSA=![]()
(5)
In the same way, we obtain
TSB=![]()
(6)
After the saturated release, the traffic flow will be released in a free flow form until there is an available gap for another traffic flow. The probability[23]thatnvehicles can pass through the gap when the traffic is released in free flow can be expressed as
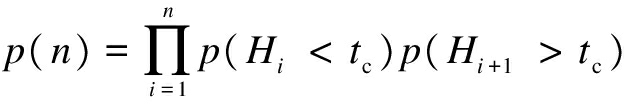
(7)
wherep(n) is the probability of one traffic flow releasingnvehicles in free flow at one time;p(Hi<tc) is the probability of the headway of thei-th vehicle being less than the critical gaptc, fori=1,2,…,n;tcis the critical gap, s;p(Hi+1>tc) is the probability of the (i+1)-th vehicle’s headway being greater than the critical gaptc.
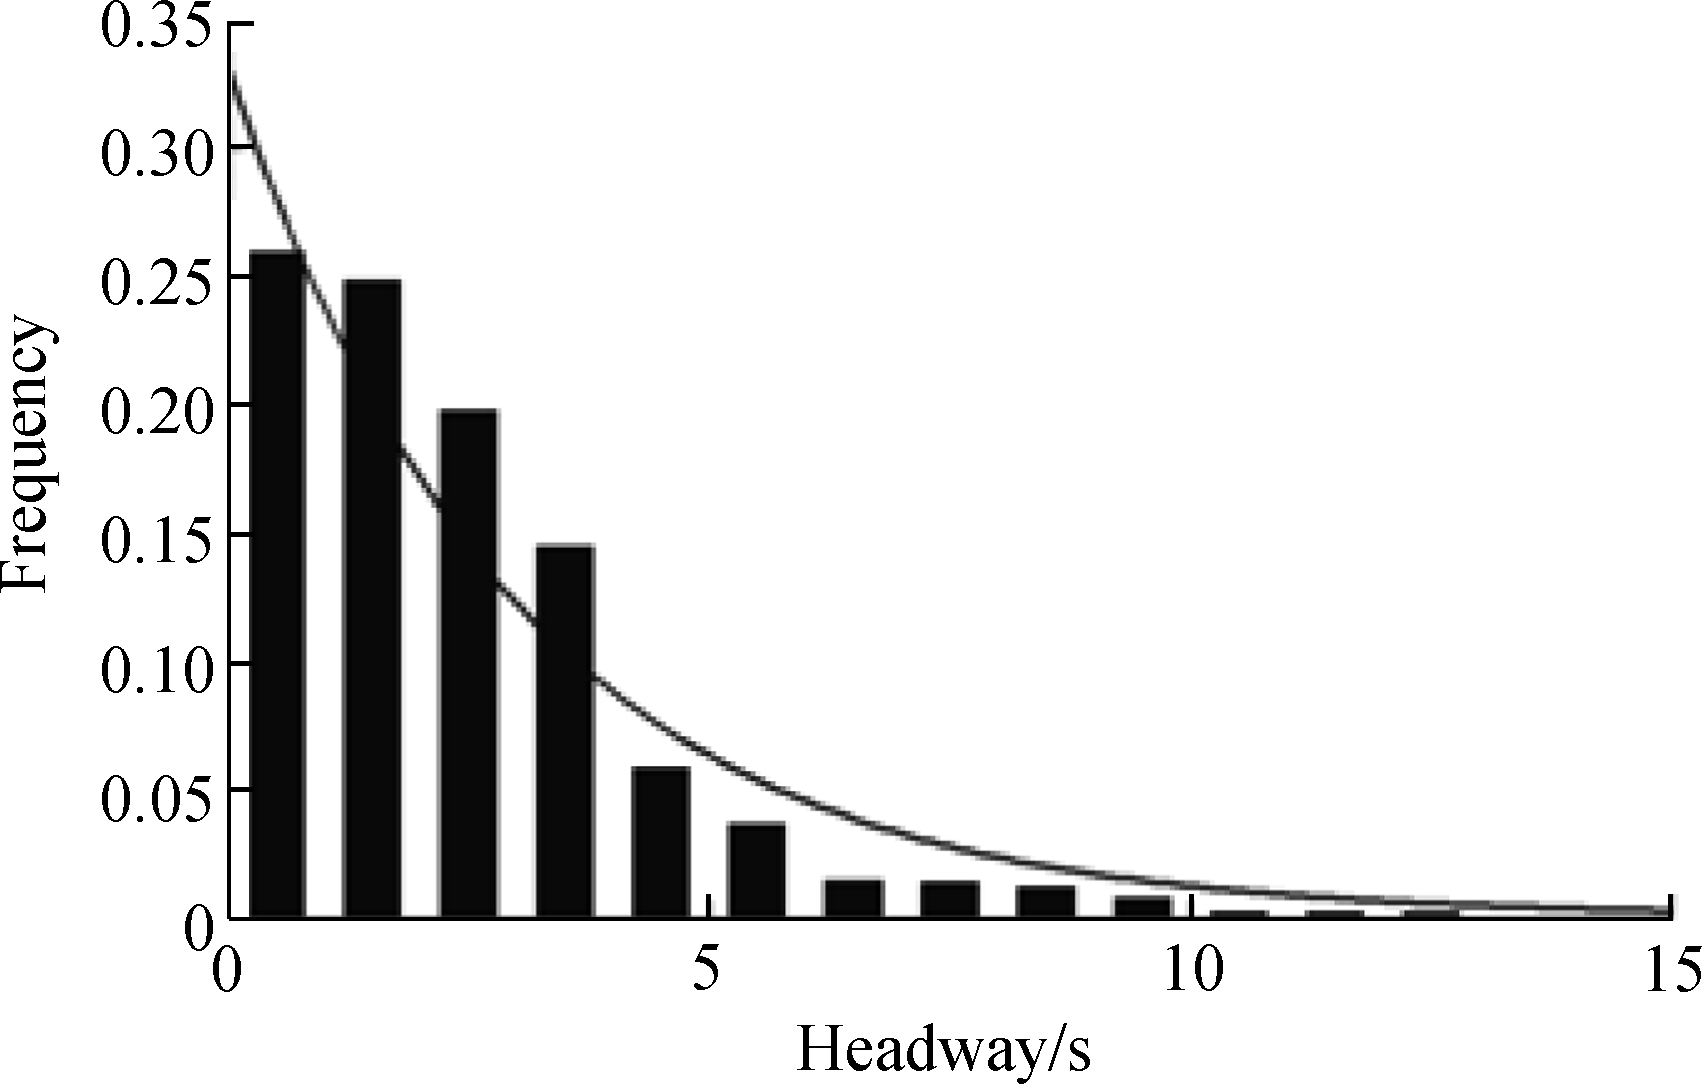
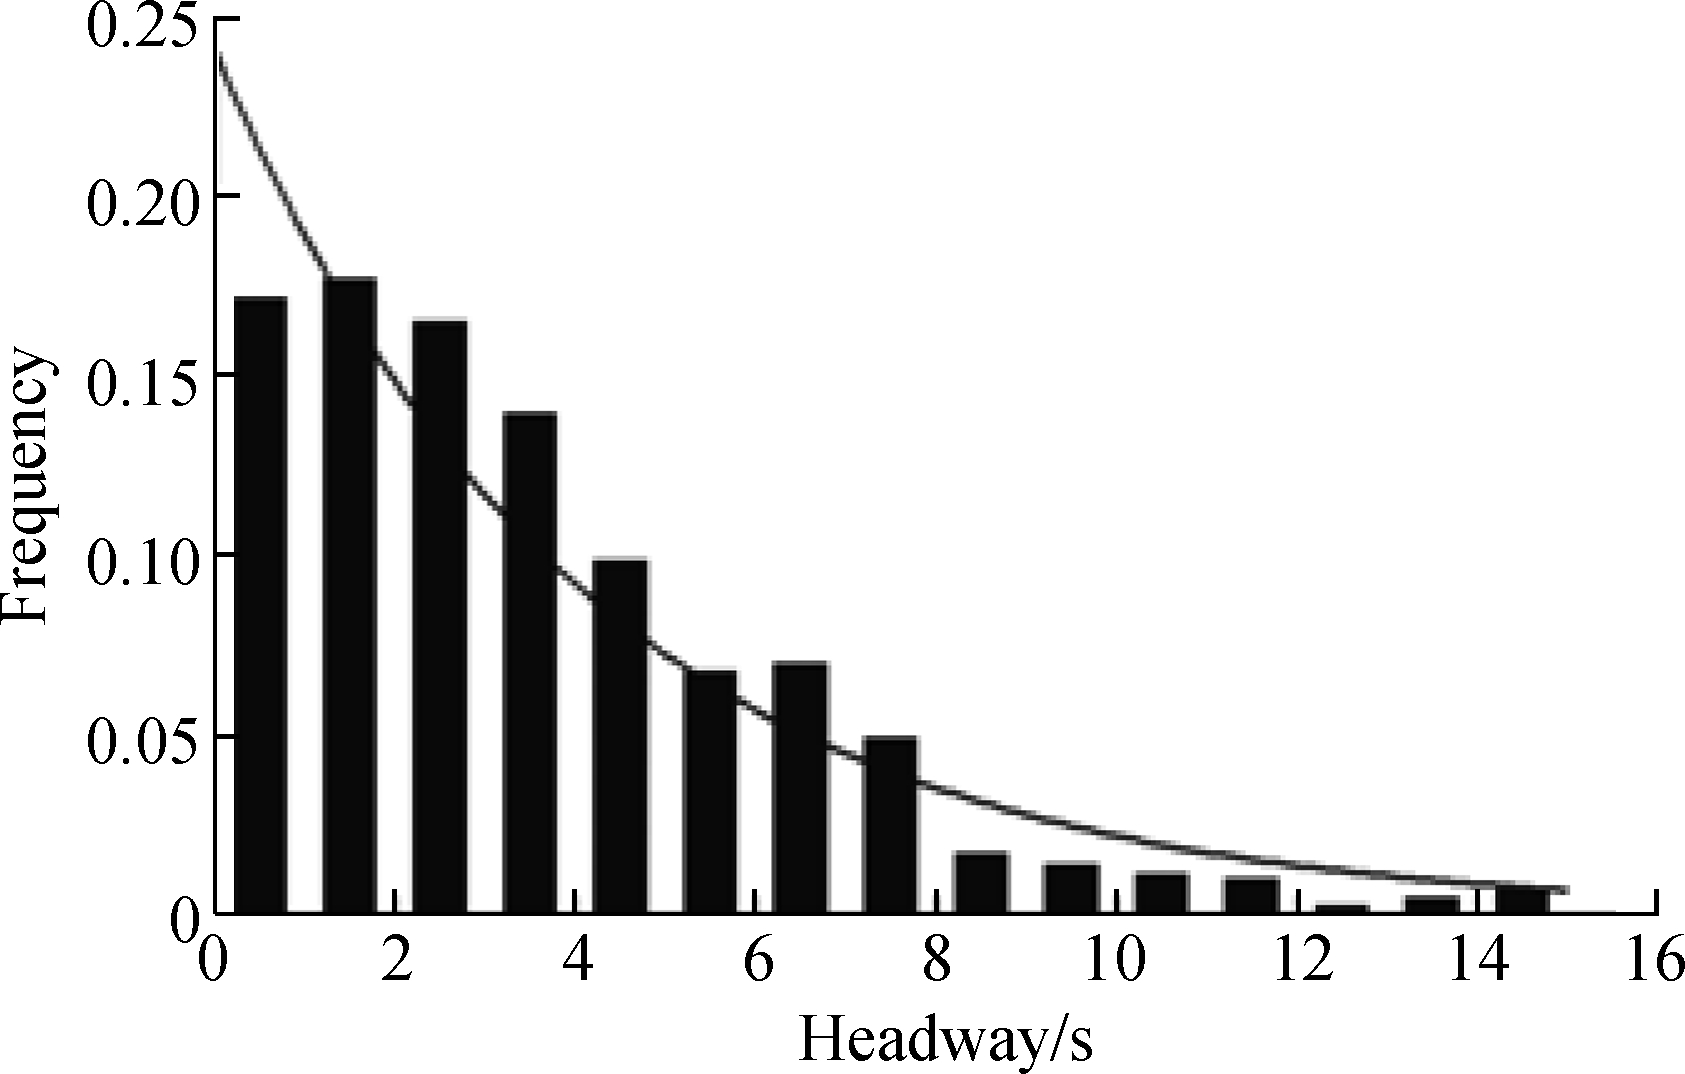
As shown in Eq.(7), the headway distribution model of conflict flow is needed for calculating the probability ofnvehicles being driven off when released in free flow. In this paper, Traffic A and B can be considered to be several small density flows. Therefore, it can be assumed that Traffic A and B follow the negative exponential distribution. In order to make a more persuasive argument, data was collected on the flow in order that the headway distribution of Traffic A and B could be tested.
Fig.4 shows that the distributions of Traffic A and B are similar to the negative exponential distribution, with![]() =0.87,
=0.87,![]() =0.85. For Traffic A, all of the products of the numbernmultiplied by the probability ofnvehicles passing when released freely at one time are accumulated. This gives the mathematical expectation of the number of vehicles of Traffic A released as free flow while the motorcade passes one at a time. The above description can be expressed as
=0.85. For Traffic A, all of the products of the numbernmultiplied by the probability ofnvehicles passing when released freely at one time are accumulated. This gives the mathematical expectation of the number of vehicles of Traffic A released as free flow while the motorcade passes one at a time. The above description can be expressed as
(a)
(b)
Fig.4 Headway distribution of Traffic A and B.(a) Traffic A; (b) Traffic B
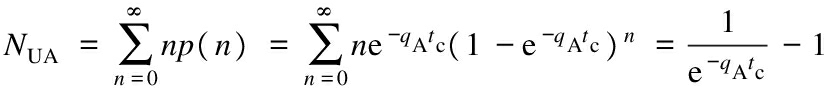
(8)
In the same way,
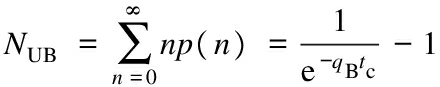
(9)
The distribution of the headway in free flow is between a minimum of 0 and the critical gaptc. Assuming that the average headways in free flow for Traffic A and B areHAandHB, then according to the gap acceptance theory, we have
HA=![]() -
-![]()
(10)
HB=![]() -
-![]()
(11)
(12)
(13)
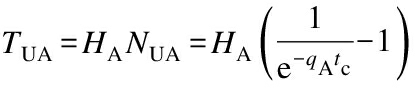
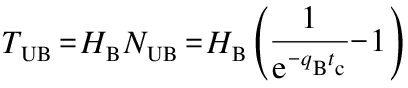
The number of crossing vehicles and their transit time in saturated and free flow were calculated above, so the number of vehicles and running time of Traffic A and B are as
NA=NSA+NUA
(14)
NB=NSB+NUB
(15)
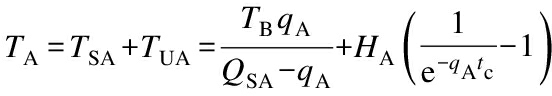
(16)
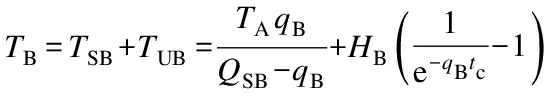
(17)
The saturated traffic flow suffers more from traffic friction than free flow does, and this will cause delays in conflict areas. Based on the delay formula for the equilibrium phase[23], for Traffic A, the cycle time isC=TA+TB, the red time isR=TB, and for Traffic B the red time isR=TA. Thus, Traffic B and A’s respective average delays, in Section 1, are as
DB=![]()
(18)
DA=![]()
(19)
Since Sections 1 and 2 are symmetrical,DAandDBcan be seen as the total delay for the whole roundabout. That is to say,DAis the delay to Traffic A in Section 1, andDBis the delay to left-turning vehicles from Traffic A in Section 2.
1.4 Modeling delay
Combining the above analysis, the average delay at the entrance to a signal-controlled roundabout isd, from Eq.(1). The delay to right-turning flowQRis 0 inside the roundabout, and the delay to straight and left-turning flow inside the roundabout should be introduced at different stages. If the directional rate is known, the numbers of vehicles turning right, going straight on and turning left can be calculated.
In the early green time, the number of vehiclesQTreleased from Branch 2 includes two parts: straight-on vehicles![]() and left-turning vehicles
and left-turning vehicles![]() . The average delays for those two groups of vehicles aredand (d+DB), respectively, as shown in Fig.6.
. The average delays for those two groups of vehicles aredand (d+DB), respectively, as shown in Fig.6.
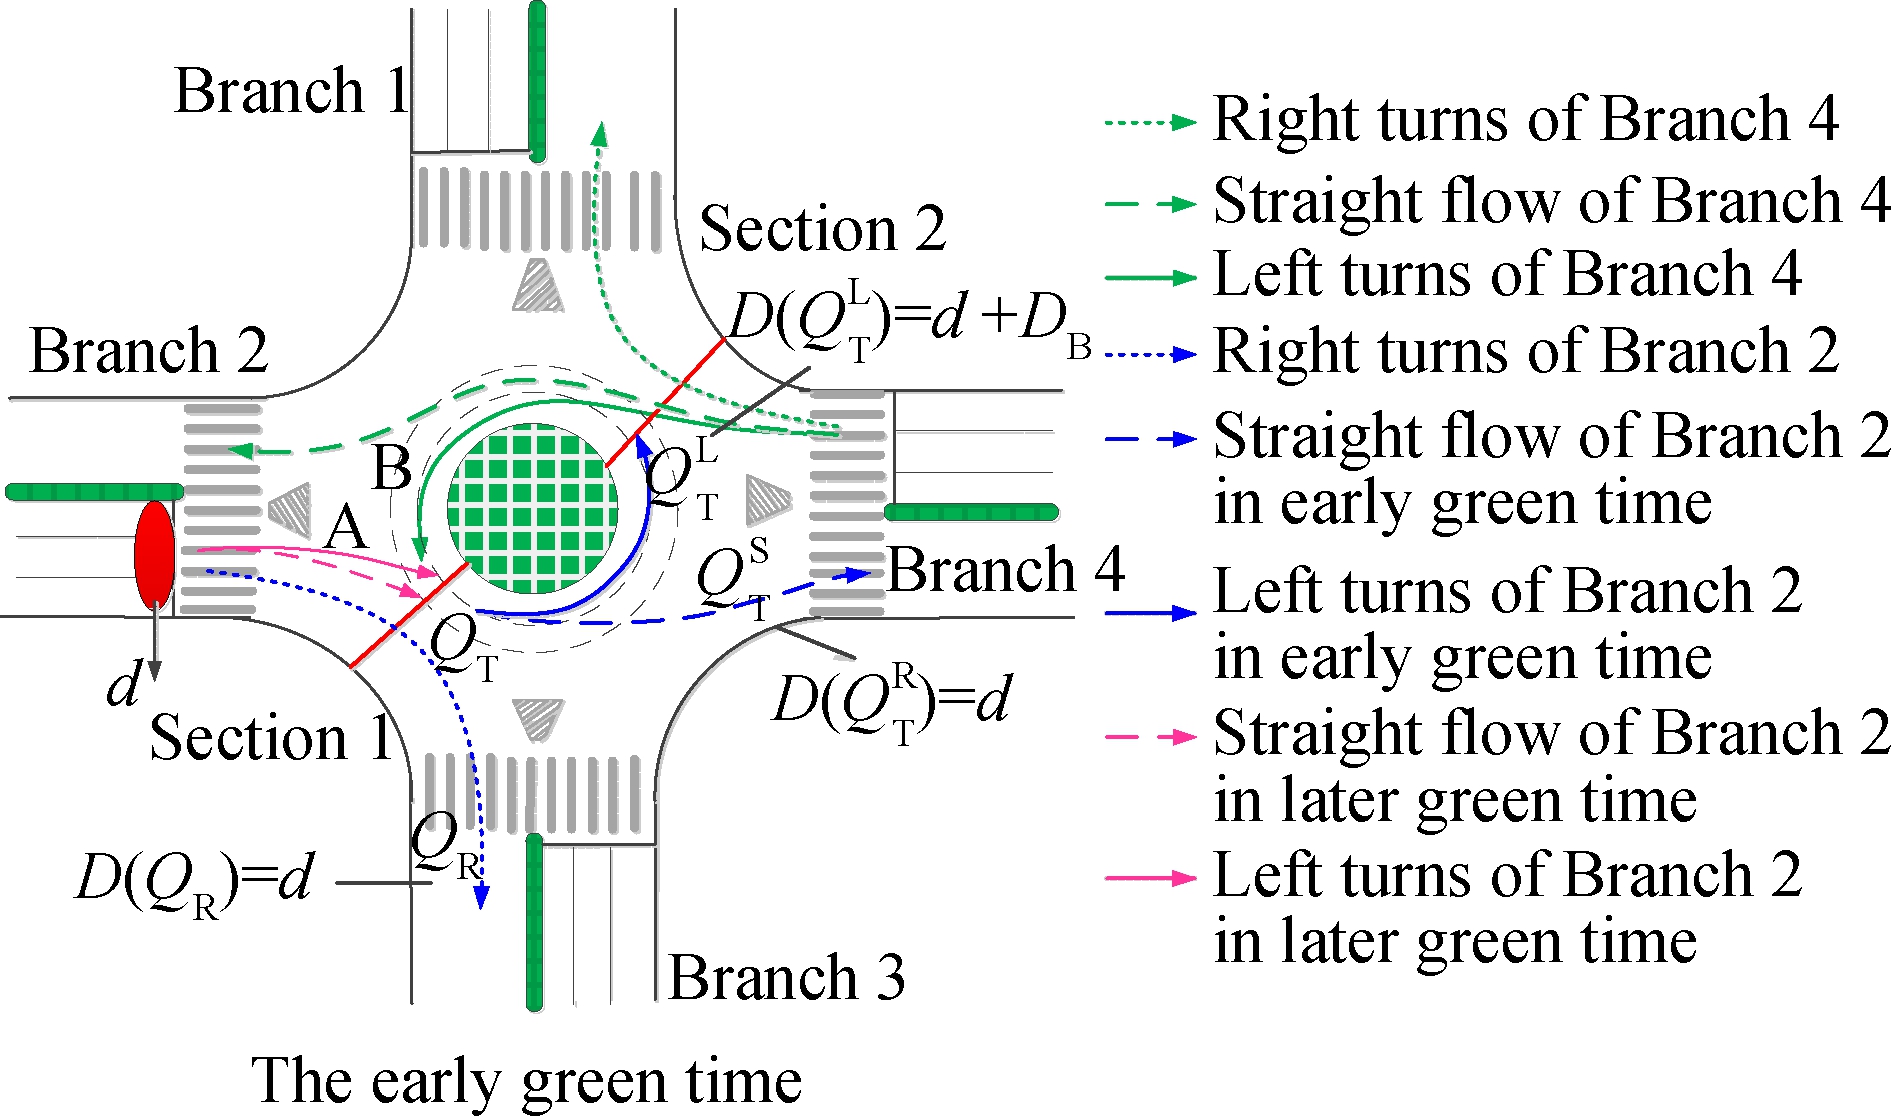
Fig.6 Schematic diagram of the combined vehicle delays in the early green time
In the later green time, Traffic A also consists of two parts: straight flow![]() and left-turning flow
and left-turning flow![]() . The average delays to the two parts of the flow are (d+DA) and (d+DA+DB), as shown in Fig.7.
. The average delays to the two parts of the flow are (d+DA) and (d+DA+DB), as shown in Fig.7.
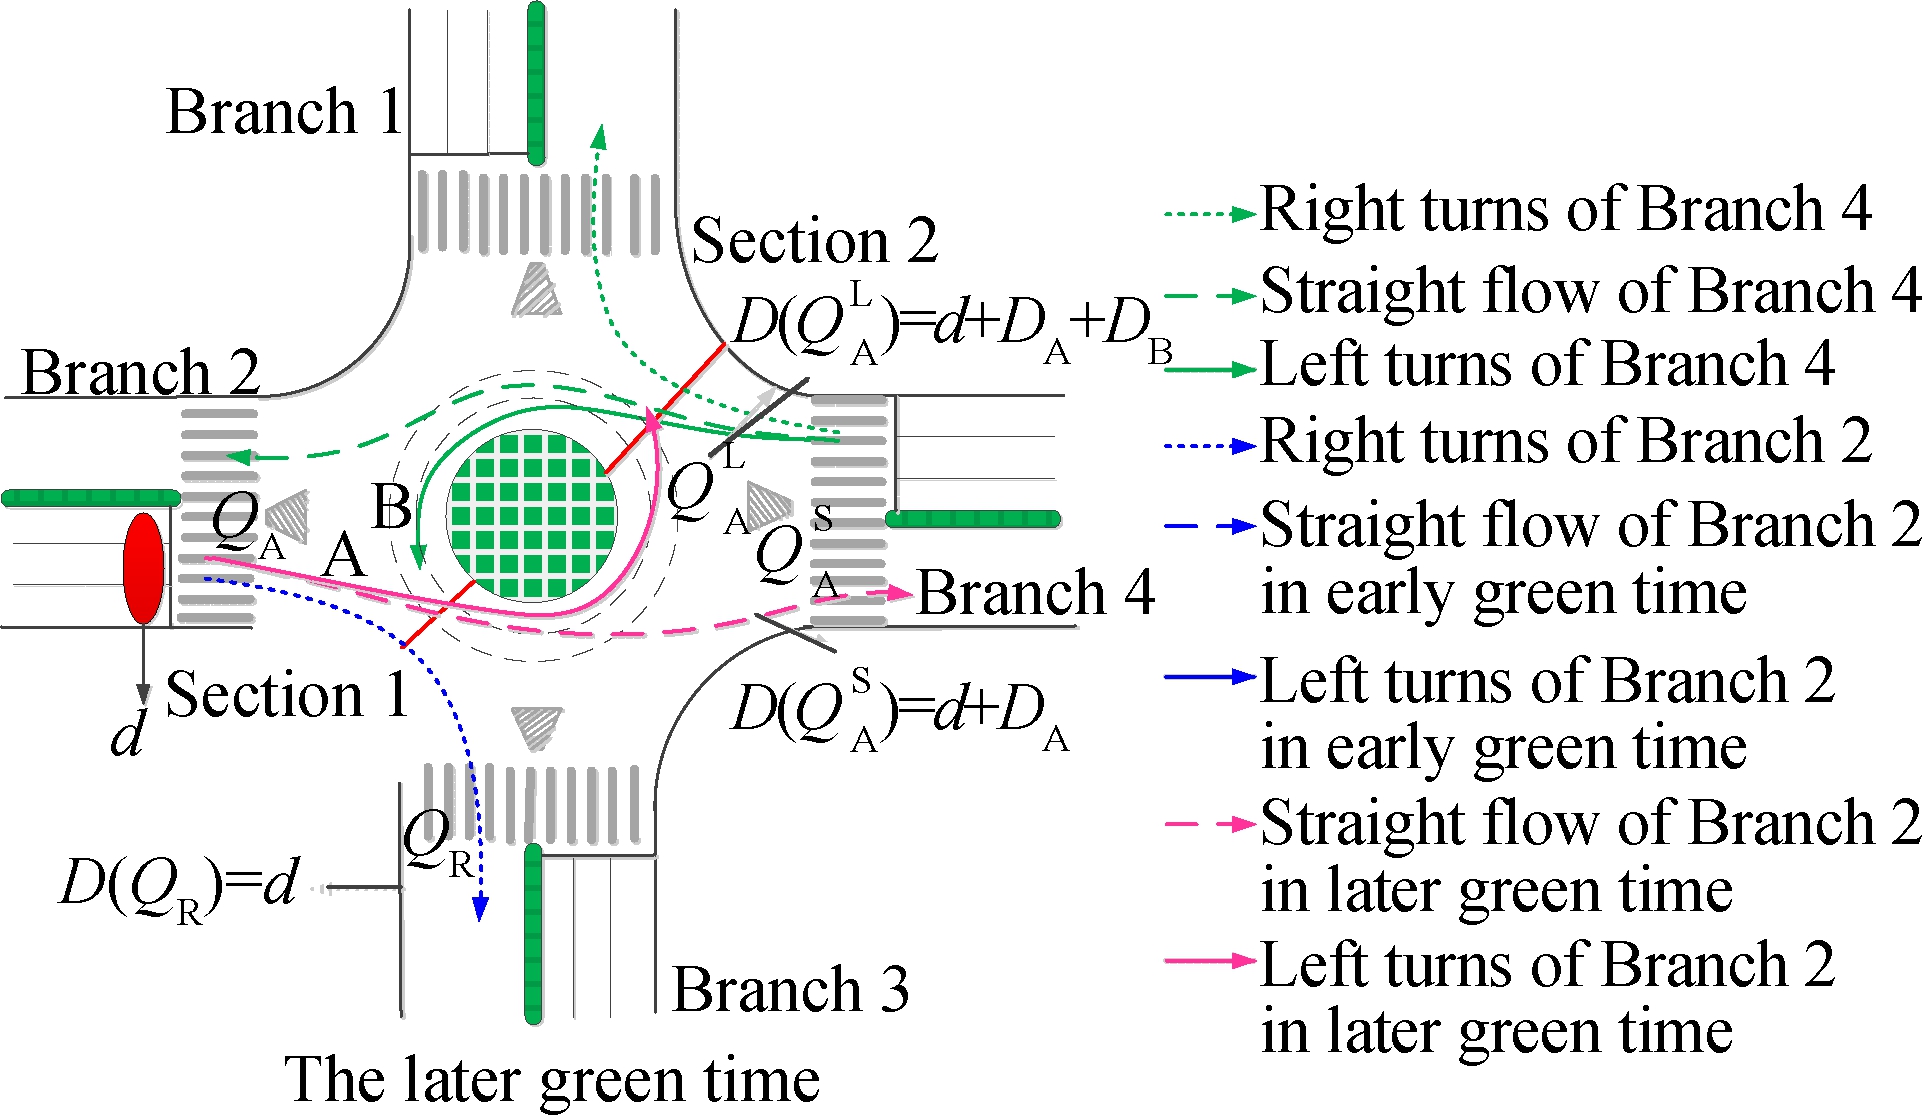
Fig.7 Schematic diagram of the combined vehicle delay in the later green time
In conclusion, the average delay across all vehicles entering from Branch 2 is
D=![]() =
=![]()
(20)
whereDTis the total delay;Nis the number of vehicles.
In the actual survey data, the change in traffic flow is small and insufficient for analyzing delays under different traffic situations. Therefore, actual survey data and simulations were combined. Actual data was used to calibrate the parameters of the model and the simulation software. Then, many experiments were carried out.
2.1 Parameter setting
2.1.1 Parameters of the model
From Section 1.2, testing the above model requires knowledge of the signal timings. The scheme of signaling was based on the traffic volume of each entrance to the roundabout. There are no particularly current findings regarding the signal timing of roundabouts in the existing research. Therefore, this paper uses the classic signal cycle method (Webster formula). Meanwhile, according to Section 1.3, the parameters needed for calculating the vehicle delays are the saturation flow rate, the critical gap and other parameters. The parameters were determined by combining specific experimental environments with the existing research results. The parameters were set as follows: 1) Assuming that in each branch, the proportions of vehicles turning left, going straight on and turning right were fixed, at a ratio of 3∶4∶3. The total flow of each branch was changed at each test, and the change interval was 100. 2) The critical gap was set to be 5 s. 3) The saturated time headway was set to be 2.25 s.
2.1.2 Simulation parameters
The experimental environment was built using the traffic simulation software VISSIM4.3. In order to improve the accuracy of the experiments, the simulation software was calibrated by the actual data. The survey date was used in the simulation software calibration so as to make the experimental environment as close to reality as possible.
2.2 Comparative verification
The roundabout used as the experimental background has a large radius and multiple lanes. There is no need to set a signal control when the volume is small. Therefore,in designing the experiments, the single entering flows began at 1 600 pcu/h. The signal control scheme in the model is a two-phase control scheme. In the scheme, two opposing traffic flows are released at the same time. Based on the above conditions, the experiment requires that the volumes of the two-way traffic are similar. That is, the volumes of Branches 2 and 4 are similar, and those of Branches 1 and 3 are similar. We performed the following experiments to analyze the average delay to vehicles from Branch 2. The first step was to determine the flow of Branches 1 and 3, and then the changes in the flow of Branches 2 and 4. Finally, experiments were conducted in groups.
The signal control scheme for the roundabout was based on different flow conditions. We calculated the vehicle delay at the entrance road, according to Eq.(1), and the results are shown in Tab.1.
Tab.1 The average delay to vehicles at the entrance roads of the roundabout
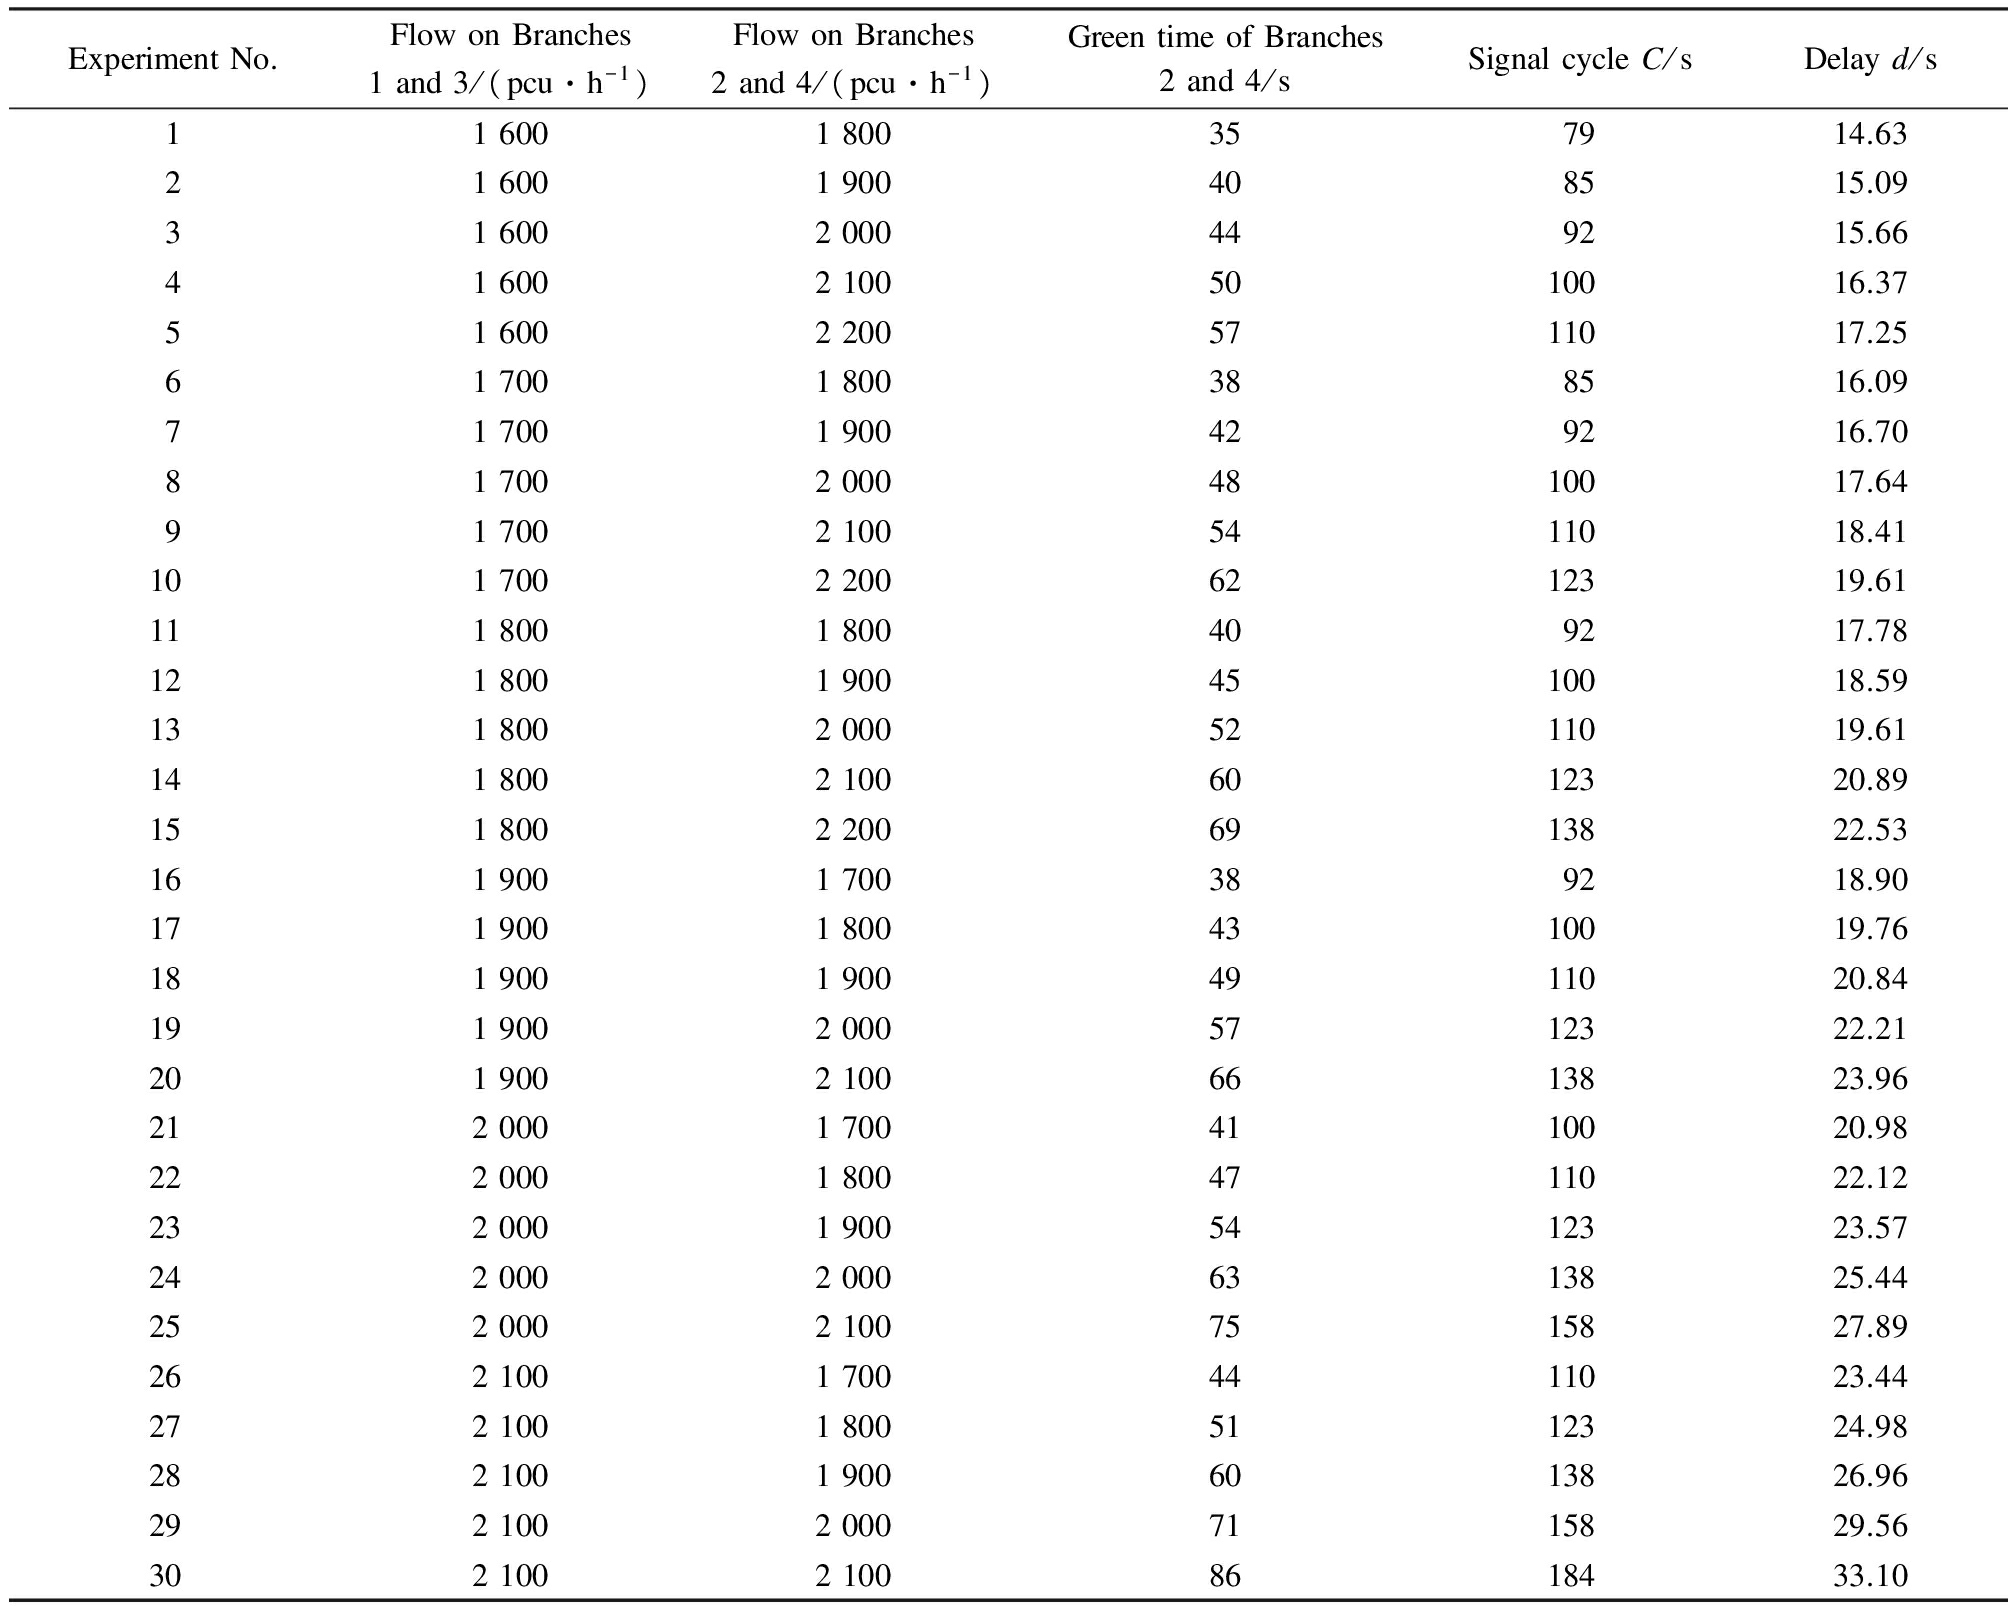
ExperimentNo.FlowonBranches1and3/(pcu·h-1)FlowonBranches2and4/(pcu·h-1)GreentimeofBranches2and4/sSignalcycleC/sDelayd/s116001800357914.63216001900408515.09316002000449215.664160021005010016.375160022005711017.25617001800388516.09717001900429216.708170020004810017.649170021005411018.4110170022006212319.611118001800409217.7812180019004510018.5913180020005211019.6114180021006012320.8915180022006913822.531619001700389218.9017190018004310019.7618190019004911020.8419190020005712322.2120190021006613823.9621200017004110020.9822200018004711022.1223200019005412323.5724200020006313825.4425200021007515827.8926210017004411023.4427210018005112324.9828210019006013826.9629210020007115829.5630210021008618433.10
In the delay model, the duration of the later green time and the number of vehicles passing through can be obtained according to the timing scheme of different traffic flows, and the arrival rates of Traffic A and B can be calculated. We calculated the values ofDAandDBaccording to Eqs.(18) and (19) and the experimental parameters given above. We combined the proportions of vehicles turning left, going straight on and turning right and applied the delay model given in Section 1.3. Thus, we can calculate the average delay to vehicles on the roundabout. The results are shown in Tab.2.
We compared the value of the average delay from the model with the simulation result, and then analyzed the error, as shown in Tab.3.
Comparing the value of average delay calculated by the model with the results of the simulation, the maximum relative error was 17.1%, the minimum relative error was 1.5%, and the average relative error was 10.1%.
Tab.2 The average delay to vehicles on the roundabout
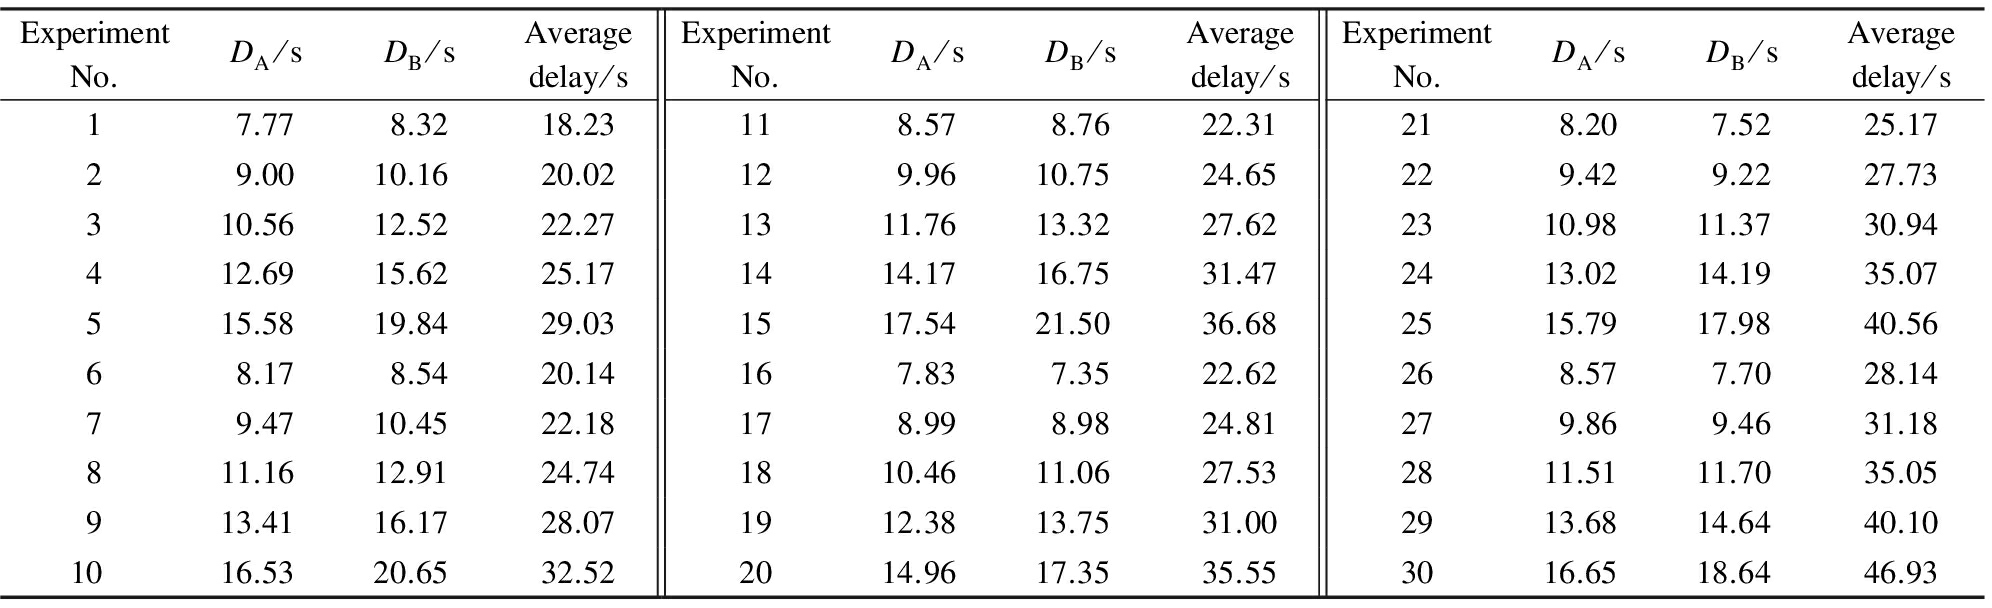
ExperimentNo.DA/sDB/sAveragedelay/sExperimentNo.DA/sDB/sAveragedelay/sExperimentNo.DA/sDB/sAveragedelay/s17.778.3218.23118.578.7622.31218.207.5225.1729.0010.1620.02129.9610.7524.65229.429.2227.73310.5612.5222.271311.7613.3227.622310.9811.3730.94412.6915.6225.171414.1716.7531.472413.0214.1935.07515.5819.8429.031517.5421.5036.682515.7917.9840.5668.178.5420.14167.837.3522.62268.577.7028.1479.4710.4522.18178.998.9824.81279.869.4631.18811.1612.9124.741810.4611.0627.532811.5111.7035.05913.4116.1728.071912.3813.7531.002913.6814.6440.101016.5320.6532.522014.9617.3535.553016.6518.6446.93
Tab.3 Comparison of average delay-calculated values and simulation values
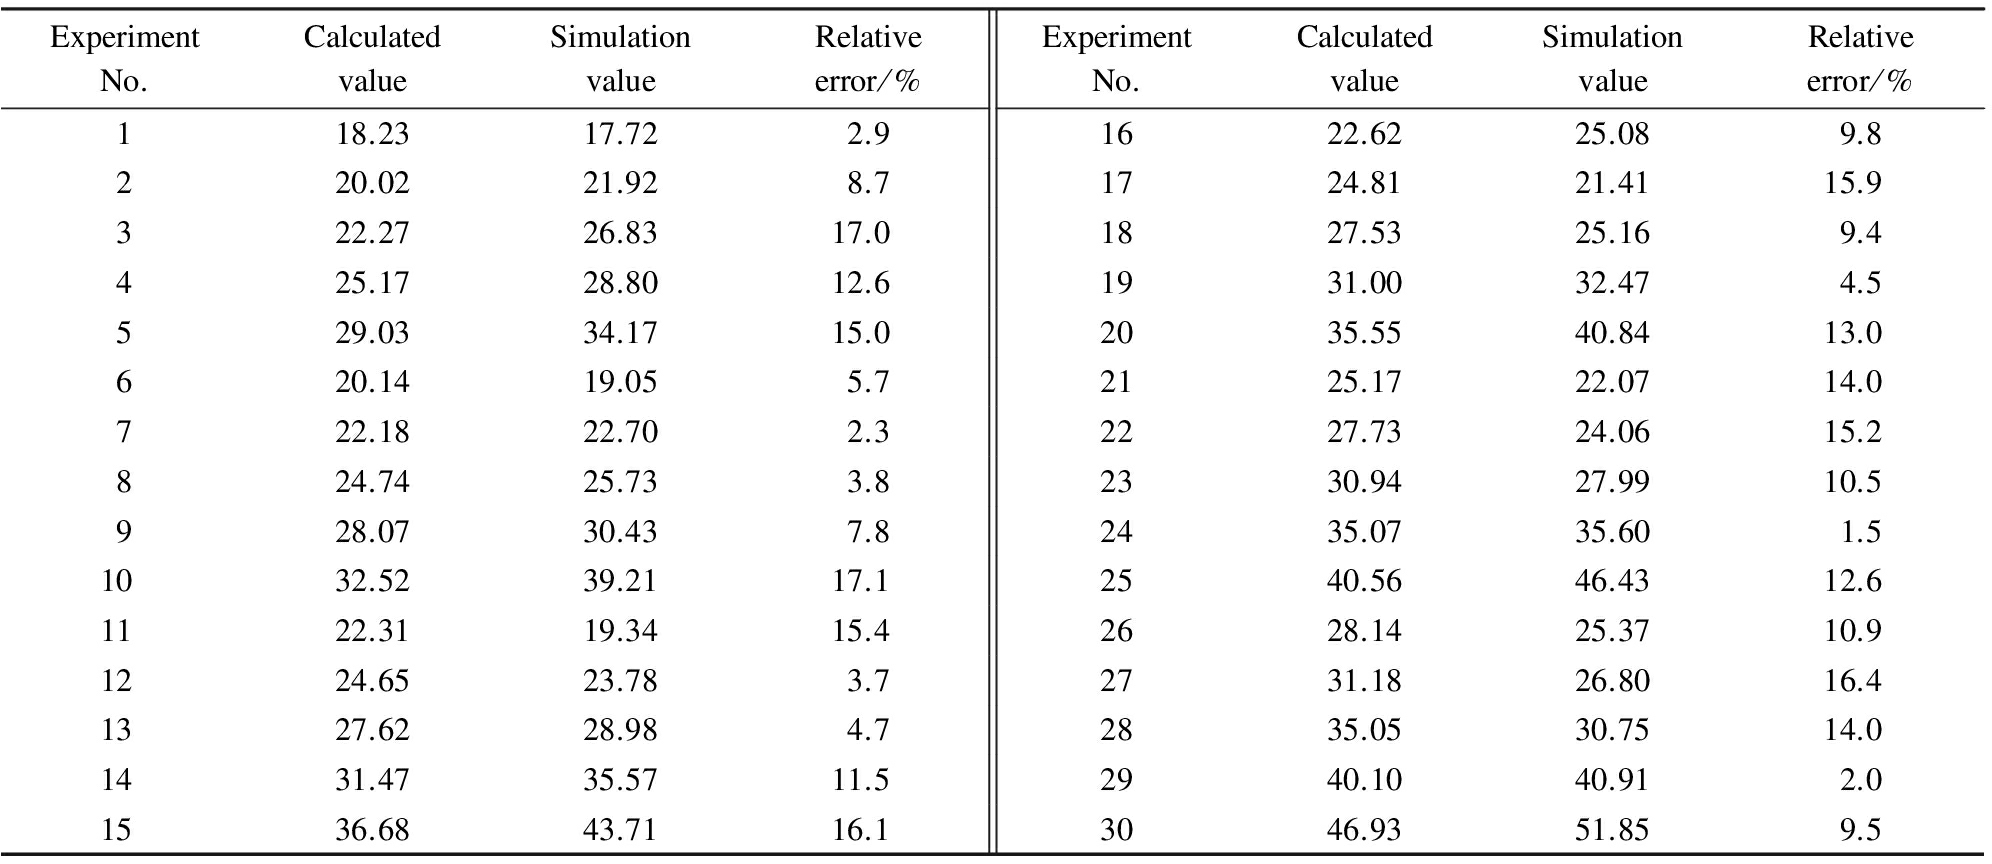
ExperimentNo.CalculatedvalueSimulationvalueRelativeerror/%ExperimentNo.CalculatedvalueSimulationvalueRelativeerror/%118.2317.722.91622.6225.089.8220.0221.928.71724.8121.4115.9322.2726.8317.01827.5325.169.4425.1728.8012.61931.0032.474.5529.0334.1715.02035.5540.8413.0620.1419.055.72125.1722.0714.0722.1822.702.32227.7324.0615.2824.7425.733.82330.9427.9910.5928.0730.437.82435.0735.601.51032.5239.2117.12540.5646.4312.61122.3119.3415.42628.1425.3710.91224.6523.783.72731.1826.8016.41327.6228.984.72835.0530.7514.01431.4735.5711.52940.1040.912.01536.6843.7116.13046.9351.859.5
These results are within the acceptable range, so the model of the delay calculation exhibits reliability.
1) This paper analyzes the vehicle delay across the entire process from entering the roundabout to leaving it, for a specific signal control scheme. A detailed analysis of the conflict process between the internal traffic in the signal-controlled roundabout is given, and then this paper focuses on the delay caused by this kind of conflict.
2) This paper establishes a delay model for the signal-controlled roundabout, and the verification shows that the error in the method proposed in this paper is 10.1%, meeting the accuracy requirement.
3) The delay model for a signalized roundabout proposed above can be used to evaluate the LOS based on the delay value. At the same time, the effects of various control schemes can be compared using this method. Thus, it can provide the basis for traffic management, and a reference for the design of roundabouts.
4) This paper takes one kind of control scheme as an example and analyzes the internal conflict behavior in the roundabout. Using the same principles, this method can be applied to various control schemes. This paper mainly analyzes the delay caused by conflict in the internal phase of the signal-controlled roundabout, without considering the interaction of traffic flow between phases. Therefore, a more comprehensive analysis of delays in signal-controlled roundabouts is planned for the future.
[1]Bapat P. Signal on roundabout-case study of robin-hood-roundabout surrey [J].HighwayEngineer,1974,21(6): 23.
[2]Wang X H. Optimal control of roundabout[J].ActaScientiarumNaturaliumUniversitatisSunyatseni, 2009,48(4):141-144.
[3]Hummer J, Milazzo J, Schroeder B, et al. Potential for metering to help roundabouts manage peak period demands in the United States[J].TransportationResearchRecord:JournaloftheTransportationResearchBoard, 2014,2402: 56-66. DOI:10.3141/2402-07.
[4]Dong Ruijuan. Research on control mode selection and time space design method of roundabout in city road[D]. Hefei: College of Automobile and Traffic Engineering, Hefei University of Technology, 2009. (in Chinese)
[5]Yang X G, Li X G, Xue K. A new traffic-signal control for modern roundabouts: Method and application[J].IEEETransactionsonIntelligentTransportationSystems, 2004,5(4): 282-287. DOI:10.1109/tits.2004.838181.
[6]Yang J D, Yang X G, Peng G X. Model of traffic control in ring-intersection[J].JournalofHighwayandTransportationResearchandDevelopment, 2000,17(3):47-51. (in Chinese)
[7]Maher M. The optimization of signal settings on a signalized roundabout using the cross-entropy method[J].Computer-AidedCivilandInfrastructureEngineering, 2008,23(2): 76-85. DOI:10.1111/j.1467-8667.2007.00524.x.
[8]Ma W J, Liu Y, Head L, et al. Integrated optimization of lane markings and timings for signalized roundabouts[J].TransportationResearchPartC:EmergingTechnologies, 2013,36: 307-323. DOI:10.1016/j.trc.2013.08.013.
[9]Hallmark S L, Fitzsimmons E J, Isebrands H N, et al. Roundabouts in signalized corridors[J].TransportationResearchRecord:JournaloftheTransportationResearchBoard, 2010,2182(1):139-147.
[10]Liu Y. Research on signal control method of Xinmin roundabout[D]. Changchun: College of Transportation, Jilin University, 2014. (in Chinese)
[11]Troutbeck R J, Kako S. Limited priority merge at unsignalized intersections[J].TransportationResearchPartA:PolicyandPractice, 1999,33(3): 291-304. DOI:10.1016/s0965-8564(98)00046-9.
[12]Qu Z W, Duan Y Z, Hu H Y, et al. Capacity and delay estimation for roundabouts using conflict theory[J].ScientificWorldJournal, 2014, 2014: 710938. DOI:10.1155/2014/710938.
[13]Flannery A, Kharoufeh J P, Gautam N, et al. Queuing delay model for single-lane roundabout [J].CivilEngineeringandEnvironmentalSystems, 2005,22(3):133-150.
[14]Bie Y, Mao C, Yang M. Development of vehicle delay and queue length models for adaptive traffic control at signalized roundabout[J].ProcediaEngineering, 2016,137: 141-150. DOI:10.1016/j.proeng.2016.01.244.
[15]Ištoka Otkovi![]() I, Dadi
I, Dadi![]() I. Comparison of delays at signal-controlled intersection and roundabout[J].PROMET—Traffic&Transportation, 2009,21(3):157-165. DOI:10.7307/ptt.v21i3.221.
I. Comparison of delays at signal-controlled intersection and roundabout[J].PROMET—Traffic&Transportation, 2009,21(3):157-165. DOI:10.7307/ptt.v21i3.221.
[16]Chimdessa Y, Kassa S M, Lemecha L. Efficiency of roundabouts as compared to traffic light controlled intersections in urban road networks[J].MomonaEthiopianJournalofScience, 2013,5(2): 81-100.
[17]Chang I, Ahn S Y, Hahn J S. Analysis of delay reduction effects on modern roundabouts according to the entry traffic volume[J].KSCEJournalofCivilEngineering, 2013,17(7): 1782-1787. DOI:10.1007/s12205-013-0338-5.
[18]Gandhi G, Abdulhaq H, Israa S. Development of delay models for roundabouts [J].JournalofEngineeringandDevelopment, 2012,16(1): 75-91.
[19]Eshragh S, Faghri A, DuRoss M. Roundabout performance evaluation in a network evacuation[J].TransportationResearchRecord:JournaloftheTransportationResearchBoard, 2013,2376: 63-70. DOI:10.3141/2376-08.
[20]Isebrands H, Hallmark S, Hawkins N. Effects of approach speed at rural high-speed intersections: Roundabouts versus two-way-stop control[J].TransportationResearchRecord:JournaloftheTransportationResearchBoard, 2014,2402: 67-77. DOI:10.3141/2402-08.
[21]Transportation Research Board. Highway capacity manual[R]. Washington, DC, USA: National Research Council, 2010.
[22]Ma D F, Wang D H, Song X M. Determination method of critical traffic volume for signal setting at T-intersections[J].JournalofSouthChinaUniversityofTechnology, 2011,39(10):105-110.
[23]Guo Ruijun. Study on capacity of roundabouts based on gap acceptance theory [D]. Beijing: School of Traffic and Transportation, Beijing Jiaotong University, 2013. (in Chinese)
References
摘要:为直观评价信号控制的环形交叉口服务水平,建立了一种信号控制的环形交叉口延误计算模型.首先根据车流运行状况,将车辆在信号控制环形交叉口内的延误分为入口道延误与环道延误.针对车辆在环形交叉口入口处的运行特性,结合HCM2010中的延误计算方法分析入口道延误.通过分析信号控制的环形交叉口的车流冲突行为,运用车队法,计算得到不同转向车流在环道上的延误模型,进而建立了信号控制的环形交叉口延误计算模型.最后,采用实测数据标定仿真参数,利用软件对模型进行验证,得到该模型相对误差为10.1%,满足精度要求.因此,该模型的计算结果能够直观体现环形交叉口的运行效率,可为环形交叉口控制方案提供设计依据.
关键词:环形交叉口;信号控制;延误;车队法
中图分类号:U491.1
![]()
JournalofSoutheastUniversity(EnglishEdition) Vol.33,No.3,pp.330⁃334Sept.2017 ISSN1003—7985
DOI:10.3969/j.issn.1003-7985.2017.03.011
Foundationitems:The National Natural Science Foundation of China(No.51278520, 51278220), the Postdoctoral Science Foundation of China(No.2014M551178), the Science and Technology Development Project of Jilin Province(No.20130206093SF).
Citation:Liu Huanfeng, Song Xianmin, Zhang Libin, et al.Delay model of signalized roundabouts[J].Journal of Southeast University (English Edition),2017,33(3):322-329.
DOI:10.3969/j.issn.1003-7985.2017.03.011.