Abstract: The impacts of four different car-following types on rear-end crash risks at a freeway weaving section were evaluated using trajectory data, in which Type 1 represents car following car, Type 2 represents car following truck, Type 3 represents truck following car and Type 4 represents truck following truck. The time to collision (TTC) was introduced as the surrogate safety measure to determine the rear-end crash risks. Then, the trajectory data at a freeway weaving section was used for the case-controlled analysis. Three logistic regression models were developed with different TTC thresholds to quantify the impacts of different car-following types. The explanatory factors were also analyzed to investigate possible reasons for the results of logistic regressions. Results show that the rear-end crash risk of Type 3 is 3.167 times higher than that of Type 1 when the TTC threshold is 2 s. However, the odds ratios of Type 2 and Type 4 are both smaller than 1, which indicates a safer condition. The analysis of explanatory factors also shows that Type 3 has the largest speed differences and the smallest net gaps. This is consistent with vehicle operation features at a weaving section and is also the reason for the larger rear-end crash risks. The results of this study reflect the mechanism of rear-end crash risks of different car-following types at the freeway weaving section.
Keywords:freeway; safety; logistic regression; time to collision; risk
The weaving section is the fundamental segment of freeway, at which two traffic streams traveling in the same direction cross each other. Due to the frequent lane changes of merging and diverging vehicles, the weaving section often results in traffic accidents, such as rear end, sideswipe and hit object. According to previous studies, while sideswipe accidents intuitively occur at weaving sections, the rear-end accidents still have the highest likelihood among all the accident types[1-2].
Previously, most of the research has focused on how different weaving section designs affect traffic capacity[3-4]and how to precisely model lane-changing behaviors occurring at the weaving sections[5-7]. Compared with numerous studies centralized in other segments[8-11], relatively few studies were conducted to investigate rear-end accidents at weaving sections[1-2,12]. The major reason is that historical crash data is difficult to collect in such a certain position and the crash data’s quality is also difficult to guarantee[13].
With the extensive development of the portable traffic surveillance system, there is an increasing trend for researchers to evaluate rear-end crash risks using vehicle trajectory data[13-17]. In contrast to the historical crash data, trajectory data includes detailed vehicle information such as velocity, position, and acceleration on every second or sub-second. Based on this data, the real time safety condition can be easily measured and evaluated. For example, Oh and Kim[14]used the Premier Pro 2.0 software to extract vehicle trajectory data and estimated the rear-end crash potential. Weng et al.[13]analyzed the rear-end crash risk of work zones for different vehicle-following patterns using trajectory data. Thus, the rear-end crash risks at the weaving section can also be investigated through vehicle trajectory data.
On the other hand, an important branch of rear-end accident studies is to evaluate the impacts of different car-following patterns. Council et al.[18]analyzed the North Carolina car and truck crashes data and pointed out that the truck drivers were at fault more often than the car drivers in rear-end accidents. Abdel-Aty and Abdelwahab[8]used three statistical models to investigate the role of light truck vehicles in rear-end crashes. Yan et al.[19]developed a multinomial logistic regression model to analyze the truck-involved rear-end accidents. Romo et al.[20]developed a mixed logit model to estimate the probability of rear-end and identify precrash factors for cars and trucks. However, to the best of our knowledge, there is no study focused on the impacts of different car-following types at a freeway weaving section. It is necessary to compare the effects of distinct car-following types on rear-end crash risks with the high quality trajectory data, and to explore the explanatory factors of the crash risks.
1.1 Surrogate safety measure
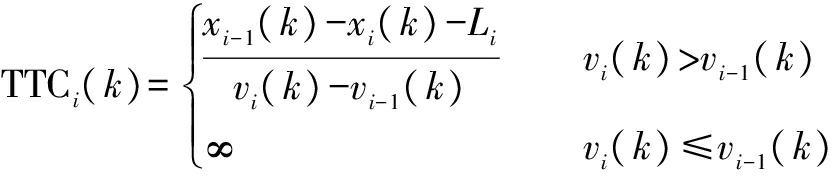
In contrast to using historical accident data, an appropriate surrogate safety measure should be used to evaluate the rear-end crash risk, which establishes the relationship between crash risks and vehicle trajectory data. In previous studies, several surrogate safety measures were proposed, such as time headway[21], deceleration rate to avoid a crash (DRAC)[15-17]and TTC[14,17,22-23]. TTC is the most common indicator, which was also used as the surrogate safety measure in this study. The TTC notion was introduced by Hayward[24]and afterward applied in many studies to evaluate rear-end crash risk[14,23]. TTC represents the time required for two successive vehicles to collide if they do not change their present operational conditions. Thus, the TTC of a following vehicleiat time stepkwith respect to the leading vehiclei-1 can be calculated as
(1)
wherexis the position of the vehicles;vis the speed of the vehicles;Lis the length of the vehicles.
A smaller TTC value indicates a more dangerous condition of the following vehicle, and vice versa. In order to distinguish the safe and unsafe situation of vehicles, a threshold TTC*should be determined. Previous studies suggested that TTC*varies from 2 to 4 s[21,23-24]. These values were derived from a large amount of empirical driving data and were extensively applied in previous research. In this study, a TTC value lower than the threshold is considered to be exposure to rear-end crash risk, which is also set to be the risk case. Three different values of TTC*are also analyzed, equalling 2, 3 and 4 s, respectively.
1.2 Data sources
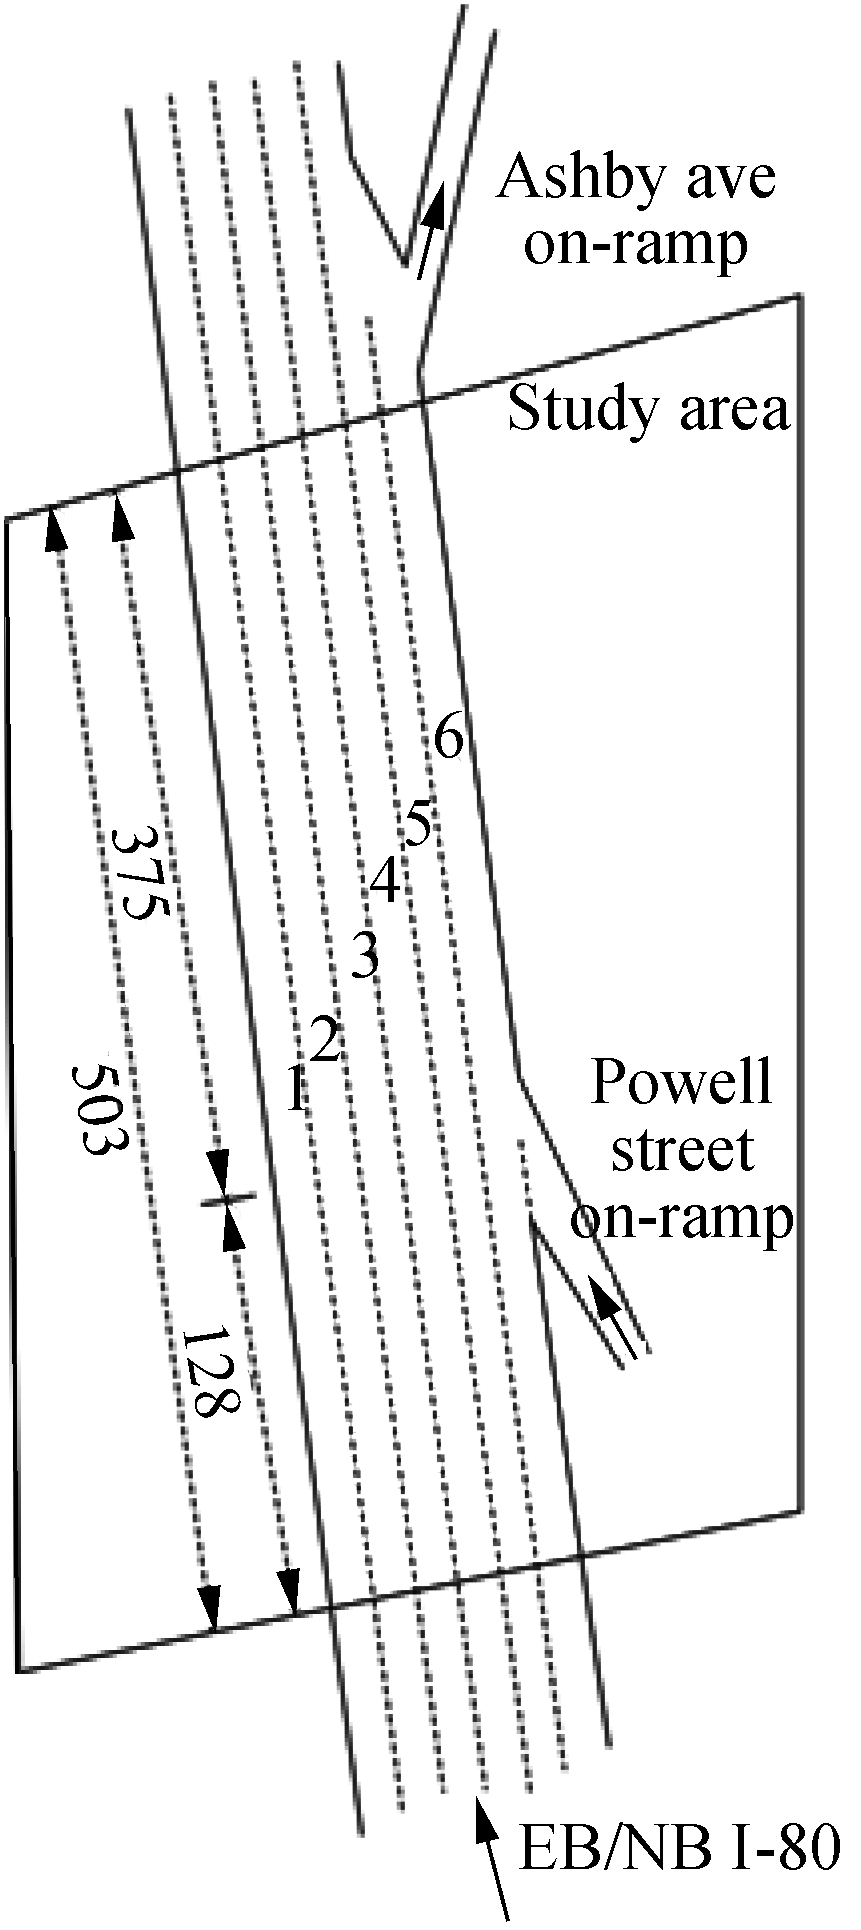
The weaving section trajectory dataset is provided by the Federal Highway Administration’s Next Generation Simulation (NGSIM) project[25]. The dataset covers a weaving segment of Interstate 80 in Emeryville, California collected between 16:00 and 16:15 on April 13, 2005. Vehicles merge from the Powell Street on-ramp and diverge from the Ashby Ave off-ramp (see Fig.1). Note that, although the off-ramp is not included in the dataset, the study area covers the major section for weaving behaviors. The data of the major weaving section is still useful considering the objective of this study. The video data is firstly collected by seven video cameras fixed on a 30-story building near the studied roadway. Then, customized software developed by NGSIM is used to automatically detect and track vehicle trajectories. Complete vehicle trajectories are transcribed at a resolution of 10 frame/s with high quality, which are precise enough for our analysis. The data of one vehicle’s trajectory includes position, velocity and acceleration every 0.1 s. More details about the trajectory information can be referred to in the reports of NGSIM[25].
(a)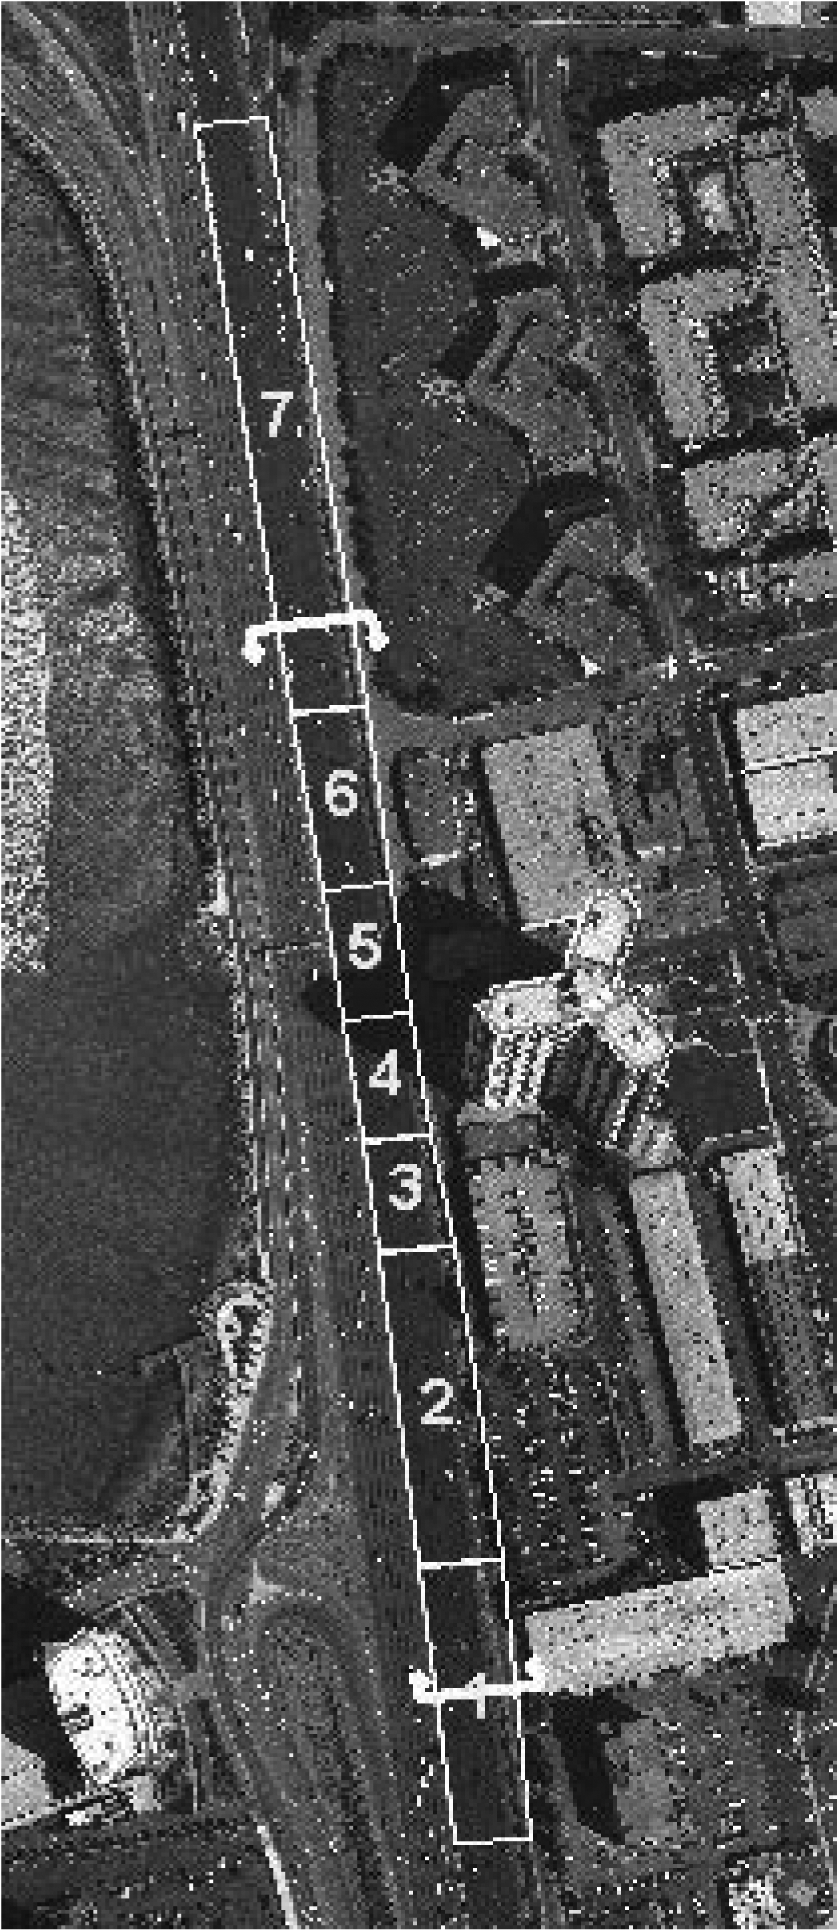
(b)
Fig.1 Illustration of the studied weaving section[25]. (a) Geographic information of studied road (unit: m); (b) Data collection ranges of seven cameras
The studied roadway is approximately 503 m in length, with six lanes at the weaving section. The left-most lane is a high-occupancy vehicle lane. The average flow of the segment is about 7 592 veh/h. The time mean speed is about 35.58 km/h and space mean speed is 28.50 km/h[25]. So, the traffic condition is quite congested. However, the mean speed of the high-occupancy vehicle lane is larger than that of other lanes. Three different vehicle types are classified in the dataset: motorcycles, passenger cars and trucks. Due to the rare fraction of motorcycles, only the passenger cars and trucks are taken into consideration. Four car-following types are included as illustrated in Fig.2, i.e. Type 1 refers to C-C (car follows car), Type 2 refers to C-T (car follows truck), Type 3 refers to T-C (truck follows car), and Type 4 refers to T-T (truck follows truck).
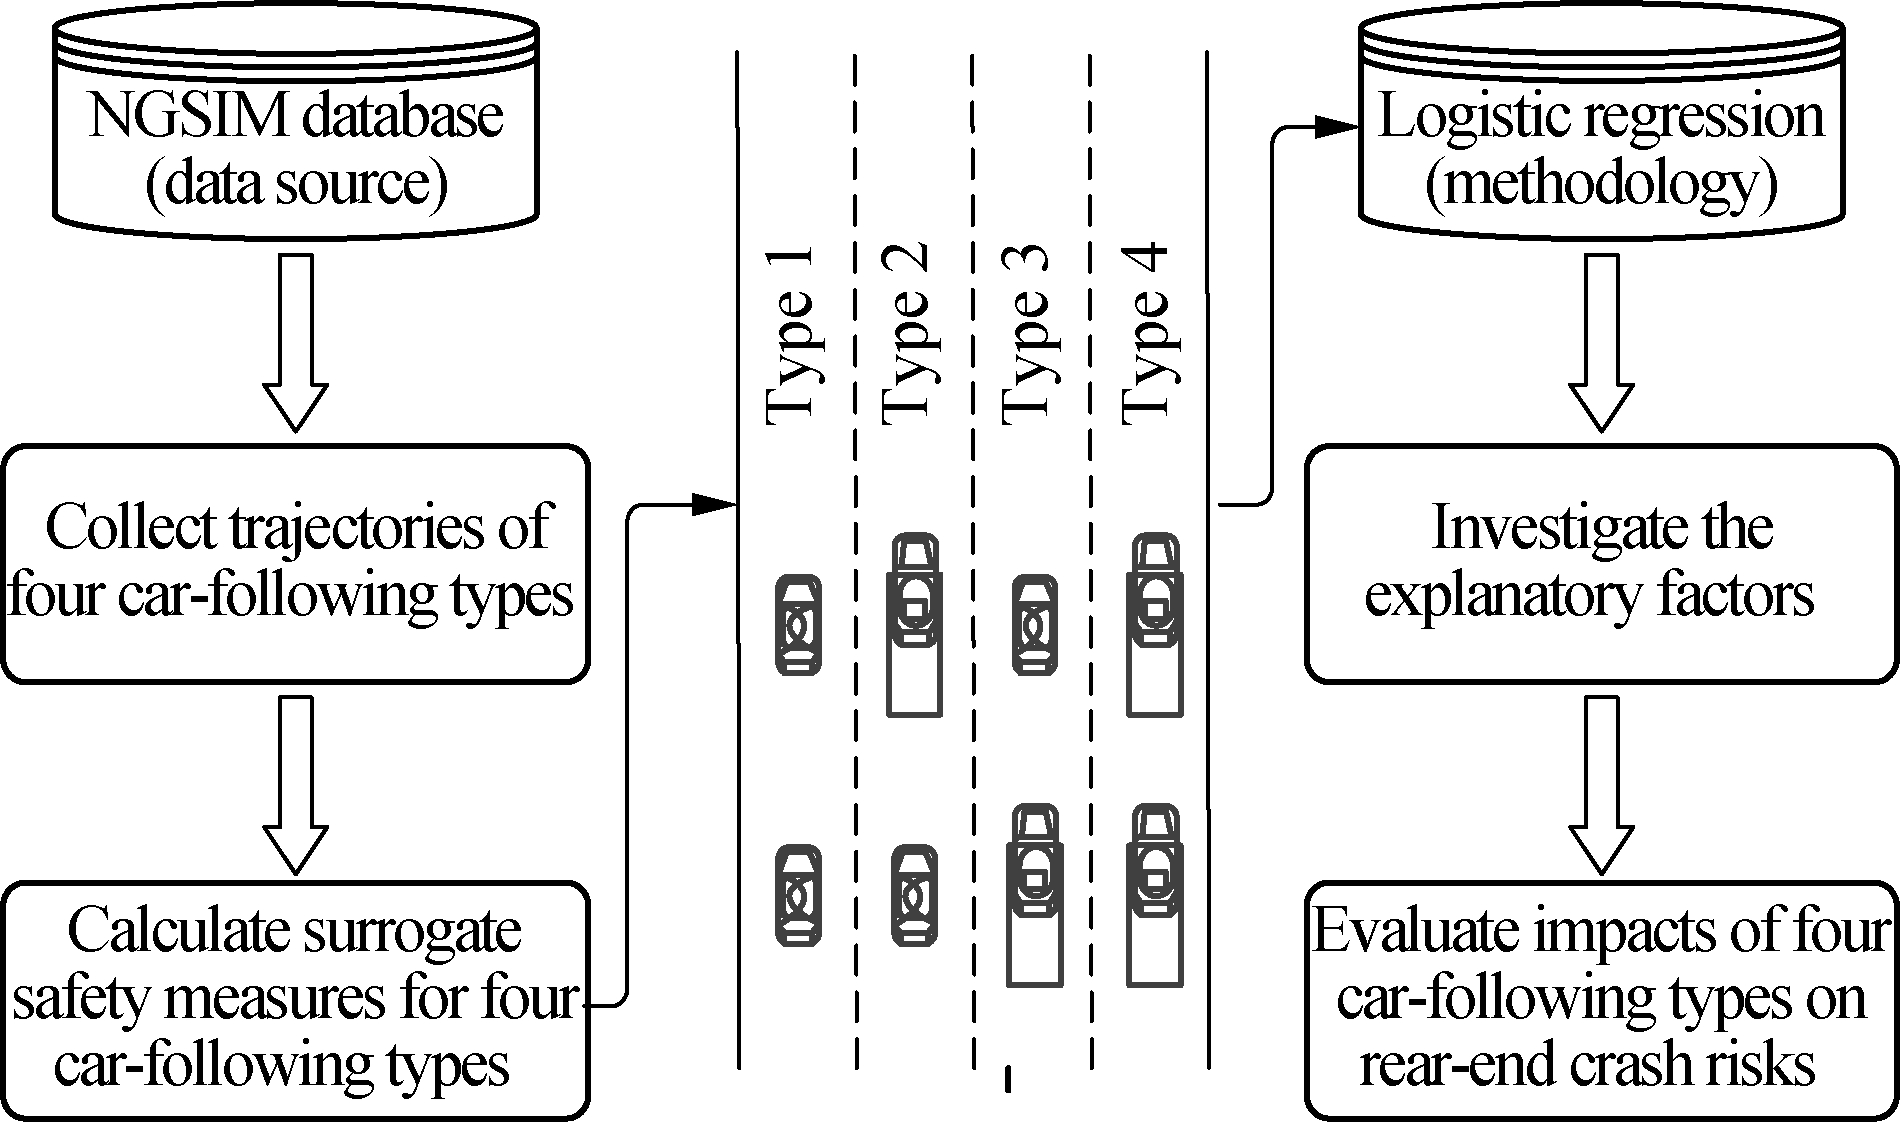
Fig.2 Illustration of data sources and methodology
For each car-following type, the case that the TTC value smaller than the threshold TTC*is set as the risk case (cases). The Matlab software was used to track the data from the original NGSIM dataset. All the vehicles involving lane-changing behaviors were removed. In addition, the complete car-following processes whose duration time is larger than 15 s were collected for our study. After data collection, as shown in Tab.1, a total of 12 627 cases were included in the dataset when TTC*is 2 s. Then, a control-to-case ratio of 4∶1 was used which randomly selected the paired crash free data (TTC is larger than TTC*) as the non-risk cases (controls). The detailed data of different vehicle-following types and TTC*are illustrated in Tab.1.
Tab.1 Data of four car-following types based on control-to-case
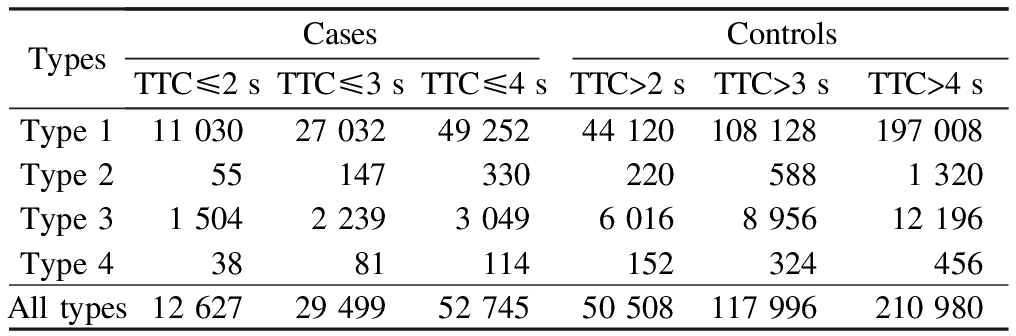
TypesCasesControlsTTC≤2sTTC≤3sTTC≤4sTTC>2sTTC>3sTTC>4sType111030 27032 49252 44120 108128 197008 Type255 147 330 220 588 1320 Type31504 2239 3049 6016 8956 12196 Type438 81 114 152 324 456 Alltypes12627 29499 52745 50508 117996 210980
1.3 Logistic regression models
To investigate the relationship between different car-following types and rear-end collision risks, a regression model is necessary. Considering that the TTC value can distinguish safe and dangerous conditions, it is easy to use a binary regression model for analysis. Thus, the logistic regression model is applied in this study. Three logistic regression models are developed using the case-controlled data with three different TTCs*. The odds ratios estimated by the regression models are used to quantitatively evaluate the impacts on rear-end crash risks. Generally, logistic regression models are often used to examine the relationship between explanatory variables and a discrete response variable. In this study, the response variableYtakes two values:Y=1 for crash risk cases andY=0 for non-risk cases. The logistic regression model is expressed as
Logit(P(Y=1))=log![]() =β0+β1x (2)
=β0+β1x (2)
whereP(Y=1) represents the probability of crash risk occurrences;xrepresents different car-following types;β1is the coefficient of the explanatory variable;β0is a constant. Note that, although other factors may be related to the rear-end crash risks, only the different car-following types are focused on due to our study aim.
2.1 Results of logistic regressions
The logistic regression models are specified using R3.2.5 software. The results of logistic regressions with three TTC*values are given in Tab.2. Type 1 (C-C) car-following pattern is used as the reference level and the odds ratios are calculated to quantify the impact of other three types. TheP-value shows that all the explanatory variables significantly affect rear-end crash risks.
Tab.2 Results of the logistic regression for three TTC*

ModelsParameterCoefficientβOddsratioeβOddsratio(95%confidenceinterval)ZvaluePvalueTTC∗=2sβ0(intercept)-1.4410.237[0.232,0.242]-136.100<0.001β1(Type2vs.Type1)-2.1460.117[0.088,0.151]-15.650<0.001β2(Type3vs.Type1) 1.4274.167[3.869,4.488] 37.710<0.001β3(Type4vs.Type1)-0.8820.414[0.292,0.570] -5.180<0.001TTC∗=3sβ0(intercept)-2.8870.056[0.055,0.056]-462.033<0.001β1(Type2vs.Type1)-2.1090.121[0.103,0.142]-25.419<0.001β2(Type3vs.Type1) 0.9512.588[2.471,2.709] 40.544<0.001β3(Type4vs.Type1)-1.0640.345[0.275,0.427] -9.471<0.001TTC∗=4sβ0(intercept)-1.3720.254[0.251,0.256]-271.980<0.001β1(Type2vs.Type1)-1.9260.146[0.130,0.162]-34.240<0.001β2(Type3vs.Type1) 0.6791.973[1.886,2.062] 29.860<0.001β3(Type4vs.Type1)-1.3380.262[0.216,0.316]-13.810<0.001
1) TTC threshold is 2 s
Type 3 (T-C) is taken as an example. The probability of crash risk occurrences of Type 3 isβ0+β1and that of Type 1 isβ0. Thus, the probability difference of these two types isβ1and the odds ratio of Type 3 is eβ1=4.167. The odds ratio indicates that the rear-end crash risk of Type 3 is 3.167 times higher than that of Type 1. One possible explanation is that lane-changing, such as the cut-in behavior, occurs frequently at the weaving section. Compared to cars, the following truck has inferior braking ability, resulting in larger speed differences and a smaller net gap with the leading car. The odds ratios of Type 2 (C-T) and Type 4 (T-T) are only 0.117 and 0.414, respectively. Both odds ratios smaller than 1 indicate that the rear-end risks of Type 2 and Type 4 are lower than that of Type 1. The possible explanation may be also related to the different operational conditions in a weaving section. The following car in Type 2 notices the unsafe condition caused by the leading truck. Then, it may maintain a larger gap distance with the truck beforehand to avoid the rear-end crash risks. Moreover, the swift response and superior decelerating ability also protects cars from rear-end crash risks even if the cut-in behaviors of adjacent vehicles occur suddenly. However, for Type 4, due to the inferior speed ability of trucks, the velocity differences between two successive trucks may be smaller than those of two cars. The small speed differences may be the reason for a safer performance. All these possible reasons will be investigated in the later section.
2) TTC threshold is 3 s
The result of TTC*of 3 s is similar to that of 2 s. The odds ratio for Type 3 is 2.588, which indicates that the rear-end crash risk of it is 1.588 times higher than that of Type 1. The odds ratios of Type 2 and Type 3 are also smaller than 1, which are 0.121 and 0.345, respectively. The smaller odds ratios also indicate the lower rear-end crash risks of Type 2 and Type 3.
3) TTC threshold is 4 s
When TTC*is 4 s, the odds ratio for vehicle following Type 3 is 1.973, which indicates that the rear-end crash risk are 0.973 times higher than that of Type 1. The odds ratios of Type 3 decrease from 4.167 to 2.588 and to 1.973, with the increased TCC*. The odds ratios of Type 2 and Type 3 are 0.146 and 0.262, respectively, which also indicate the lower rear-end crash risks of Type 2 and Type 3.
2.2 Analysis of explanatory factors
Similar results can be obtained from the above logistic regressions with three different TTCs*. At the freeway weaving section, Type 3 has a larger rear-end crash risk compared with Type 1, while Type 2 and Type 4 have smaller risk. In order to investigate the possible causes, the detailed data of TTCs, speed differences and net gaps are analyzed.
As shown in Fig.3, the histograms were given for the three factors. It is clear that the TTC values of Type 2 are larger than those of Type 1 from the distribution trend. The same result can be found for Type 4. However, the TTC values of Type 3 are smaller than those of Type 1, which are consistent with the results of the logistic regressions. The descriptive statistics in Tab.3 also verify the results.

Tab.3 Descriptive statistics of TTC, speed difference and net gap
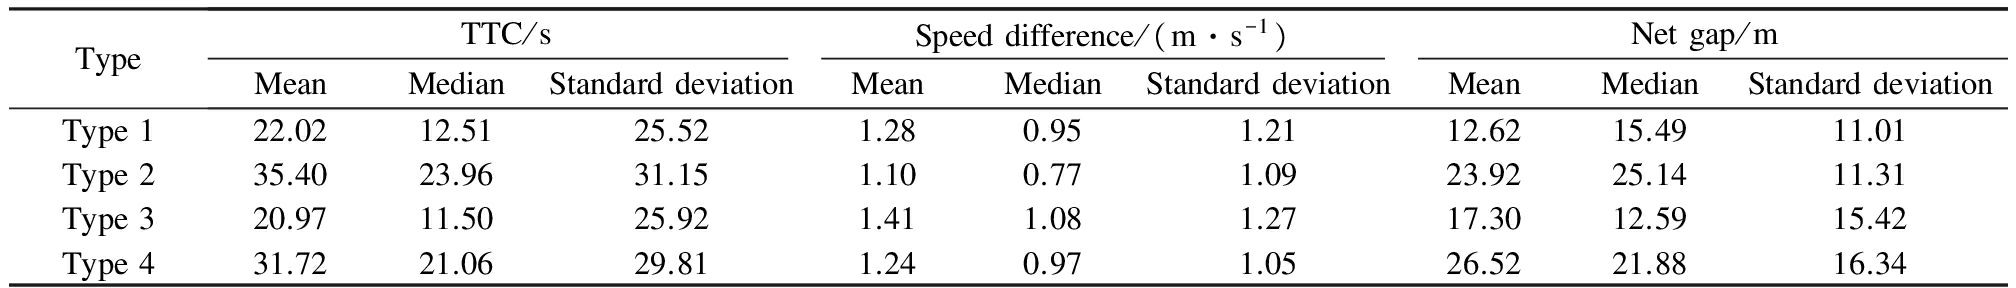
TypeTTC/sSpeeddifference/(m·s-1)Netgap/mMeanMedianStandarddeviationMeanMedianStandarddeviationMeanMedianStandarddeviationType122.0212.5125.521.280.951.2112.6215.4911.01Type235.4023.9631.151.100.771.0923.9225.1411.31Type320.9711.5025.921.411.081.2717.3012.5915.42Type431.7221.0629.811.240.971.0526.5221.8816.34
The speed differences indicate that Type 2 has smaller speed differences than those of Type 1. Due to its superior accelerating and braking abilities, the following cars of Type 2 can maintain small speed differences with the leading trucks, compared with Type 1. The smaller differences of velocities are one of the contributing factors to the lower rear-end crash risks. The mean and median of speed difference of Type 2 are 1.10 and 0.77, smaller than 1.28 and 0.95 of Type 1, respectively.
Fig.3 also shows that the velocity differences of Type 3 are larger than those of Type 1. At weaving sections, frequent lane-changes often lead to sudden accelerations and decelerations of the leading car. However, the following truck with inferior vehicle performance cannot respond to hazardous traffic conditions in time. Therefore, the speed difference between the successive two vehicles is larger than that of Type 1. A similar result can be found for Type 4, while the difference between Type 1 and Type 4 is not so large as that between Type 1 and Type 3.
The differences of net gap are more apparent when comparing the other three types with Type 1. In the perspective of the distribution trend, Type 2 and Type 4 have larger net gaps than Type 1. The average net gaps of those two types are 23.92 and 17.30, larger than 12.62 of Type 1. The result is intuitive because the leading trucks cause restricted visibility and compel the following cars or trucks to maintain larger net gaps to avoid accidents.
However, Type 3 has smaller net gaps than Type 1. At the weaving section, the large net gaps between the following trucks and leading cars will provide cars on adjacent lanes with accepted gaps for lane-changing. Therefore, trucks have to maintain smaller gaps to guarantee their operations. When the leading vehicles are trucks, such as Type 2 and Type 4, adjacent vehicles can recognize the danger of cut-in behaviors and avoid driving into the more hazardous conditions. Consequently, the net gaps of these two types can be maintained large enough. Considering the combinations of the larger speed differences and the smaller net gaps, the TTC values of Type 3 are much lower than those of Type 1. This may be a good explanation for the high rear-end crash risks of T-C vehicle following types.
1) The rear-end crash risk of Type 3 is 3.167 times higher than that of Type 1 when TTC*is 2 s. However, the odds ratios of Type 2 and Type 4 are smaller than 1, which represent safer conditions compared with Type 1. Similar results are also found when the TTC*is 3 or 4 s.
2) Three explanatory factors are then investigated to figure out the in-depth reasons. It is clear that Type 3 has the largest speed differences and smallest net gaps, which cause the largest TTC values.
3) The results of this study reflect the mechanism of rear-end crash risks of different car-following types at the freeway weaving section. The speed differences and net gaps of different car-following types are crucial factors for the rear-end crash risks.
[1]Li Z, Li Y, Liu P, et al. Development of a variable speed limit strategy to reduce secondary collision risks during inclement weathers [J].AccidentAnalysis&Prevention, 2014,72: 134-145. DOI:10.1016/j.aap.2014.06.018.
[2]Li Y, Wang H, Wang W, et al. Evaluation of the impacts of cooperative adaptive cruise control on reducing rear-end collision risks on freeways [J].AccidentAnalysis&Prevention, 2017,98: 87-95. DOI:10.1016/j.aap.2016.09.015.
[3]Skabardonis A, Mauch M. Evaluation of methodologies for analyzing freeway ramp weaving [J].TransportationResearchRecord:JournaloftheTransportationResearchBoard, 2015,2483: 130-139.
[4]Li Y, Wang H, Wang W, et al. Reducing the risk of rear-end collisions with infrastructure-to-vehicle (I2V) integration of variable speed limit control and adaptive cruise control system [J].TrafficInjuryPrevention, 2016,17(6): 597-603. DOI:10.1080/15389588.2015.1121384.
[5]Kusuma A, Liu R, Choudhury C, et al. Lane-changing characteristics at weaving section [C/OL]//TransportationResearchBoard94thAnnualMeeting. Washington, DC, USA, 2015. https://www.researchgate.net/publication/303617349_Lane-changing_characteristics_at_weaving_section.
[6]Wan X, Jin P J, Yang F, et al. Merging preparation behavior of drivers: How they choose and approach their merge positions at a congested weaving area[J].JournalofTransportationEngineering, 2016,142(9): 05016005. DOI:10.1061/(asce)te.1943-5436.0000864.
[7]He H, Menendez M. Distribution and impacts of lane changes at a freeway weaving section: An empirical study [C]//TransportationResearchBoard95thAnnualMeeting. Washington, DC, USA, 2016: 01595109.
[8]Abdel-Aty M, Abdelwahab H. Configuration analysis of two-vehicle rear-end crashes[J].TransportationResearchRecord:JournaloftheTransportationResearchBoard, 2003,1840: 140-147. DOI:10.3141/1840-16.
[9]Pande A, Abdel-Aty M. Comprehensive analysis of the relationship between real-time traffic surveillancedata and rear-end crashes on freeways[J].TransportationResearchRecord:JournaloftheTransportationResearchBoard, 2006,1953: 31-40. DOI:10.3141/1953-04.
[10]Wang X, Abdel-Aty M. Temporal and spatial analyses of rear-end crashes at signalized intersections [J].AccidentAnalysis&Prevention, 2006,38(6): 1137-1150. DOI:10.1016/j.aap.2006.04.022.
[11]Kim J K, Wang Y, Ulfarsson G F. Modeling the probability of freeway rear-end crash occurrence[J].JournalofTransportationEngineering, 2007,133(1): 11-19. DOI:10.1061/(asce)0733-947x(2007)133:1(11).
[12]Iliadi A, Farah H, Schepers P, et al. A crash prediction model for weaving sections in the Netherlands [C]//TransportationResearchBoard95thAnnualMeeting. Washington, DC, USA, 2016: 486-487.
[13]Weng J, Meng Q, Yan X. Analysis of work zone rear-end crash risk for different vehicle-following patterns[J].AccidAnalPrev, 2014,72: 449-457. DOI:10.1016/j.aap.2014.08.003.
[14]Oh C, Kim T. Estimation of rear-end crash potential using vehicle trajectory data [J].AccidentAnalysis&Prevention, 2010,42(6): 1888-1893. DOI:10.1016/j.aap.2010.05.009.
[15]Meng Q, Weng J. Evaluation of rear-end crash risk at work zone using work zone traffic data [J].AccidentAnalysis&Prevention, 2011,43(4): 1291-1300. DOI:10.1016/j.aap.2011.01.011.
[16]Aghabayk K, Sarvi M, Young W. Attribute selection for modelling driver’s car-following behaviour in heterogeneous congested traffic conditions [J].TransportmetricaA:TransportScience, 2014,10(5): 457-468. DOI:10.1080/23249935.2013.787558.
[17]Weng J, Xue S, Yang Y, et al. In-depth analysis of drivers’ merging behavior and rear-end crash risks in work zone merging areas [J].AccidentAnalysis&Prevention, 2015,77: 51-61. DOI:10.1016/j.aap.2015.02.002.
[18]Council F, Harkey D, Nabors D, et al. Examination of fault, unsafe driving acts, and total harm in car-truck collisions[J].TransportationResearchRecord:JournaloftheTransportationResearchBoard, 2003,1830: 63-71. DOI:10.3141/1830-09.
[19]Yan X, Radwan E, Mannila K K. Analysis of truck-involved rear-end crashes using multinomial logistic regression [J].AdvancesinTransportationStudies, 2009,2009(17): 39-52.
[20]Romo A, Hernandez S, Cheu R L. Identifying precrash factors for cars and trucks on interstate highways: Mixed logit model approach[J].JournalofTransportationEngineering, 2014,140(3): 04013016. DOI:10.1061/(asce)te.1943-5436.0000621.
[21]Vogel K. A comparison of headway and time to collision as safety indicators [J].AccidentAnalysis&Prevention, 2003,35(3): 427-433. DOI:10.1016/s0001-4575(02)00022-2.
[22]Kiefer R J, LeBlanc D J, Flannagan C A, et al. Developing an inverse time-to-collision crash alert timing approach based on drivers’ last-second braking and steering judgments [J].AccidentAnalysis&Prevention, 2005,37(2): 295-303. DOI:10.1016/j.aap.2004.09.003.
[23]Meng Q, Qu X. Estimation of rear-end vehicle crash frequencies in urban road tunnels [J].AccidentAnalysis&Prevention, 2012,48: 254-263. DOI:10.1016/j.aap.2012.01.025.
[24]Hayward J C. Near-miss determination through use of a scale of danger [J/OL].HighwayResearchRecord, 1972. http://onlinepubs.trb.org/Onlinepubs/hrr/1972/384/384-004.pdf
[25]Federal Highway Administration. Next generation simulation (NGSIM) [EB/OL]. (2002)[2016-09-15]. https://ops.fhwa.dot.gov/trafficanalysistools/ngsim.htm.
References
摘要:使用轨迹数据评价4种不同跟驰类型(类型1~4分别为小汽车跟随小汽车、小汽车跟随货车、货车跟随小汽车、货车跟随货车)对高速公路交织区追尾事故风险的影响.介绍了碰撞时间,并将其作为判断追尾事故风险的替代性安全指标,然后使用高速公路交织区的轨迹数据进行病例对照分析,在不同碰撞时间阈值下建立了3个logistic回归模型用于定量评价不同跟驰类型的影响,并对解释变量进行分析以期研究导致回归模型结果的可能原因.结果表明,当碰撞时间阈值等于2 s时,第3种跟驰类型的追尾事故风险比第1种跟驰类型高3.167倍,而第2种类型和第4种类型的优势比都小于1,该结果代表更安全的状态.对解释变量的分析显示第3种类型拥有最大的速度差和最小的净距,这与交织区车辆运行特征相一致,也是更大追尾事故风险的原因.该研究揭示了高速公路交织区不同跟驰类型追尾事故风险的机理.
关键词:高速公路;安全;logistic回归;碰撞时间;风险
中图分类号:U491
![]()
JournalofSoutheastUniversity(EnglishEdition) Vol.33,No.3,pp.341⁃347Sept.2017 ISSN1003—7985
DOI:10.3969/j.issn.1003-7985.2017.03.013
Foundationitem:The National Natural Science Foundation of China (No. 51638004, 51338003, 51478113).
Citation:Li Ye, Xing Lu, Wang Wei, et al. Evaluating impacts of different car-following types on rear-end crashes at freeway weaving section[J].Journal of Southeast University (English Edition),2017,33(3):335-340.
DOI:10.3969/j.issn.1003-7985.2017.03.013.