Abstract:To increase airspace capacity, alleviate flight delay, and improve network robustness, an optimization method of multi-layer air transportation networks is put forward based on Laplacian energy maximization. The effectiveness of taking Laplacian energy as a measure of network robustness is validated through numerical experiments. The flight routes addition optimization model is proposed with the principle of maximizing Laplacian energy. Three methods including the depth-first search (DFS) algorithm, greedy algorithm and Monte-Carlo tree search (MCTS) algorithm are applied to solve the proposed problem. The trade-off between system performance and computational efficiency is compared through simulation experiments. Finally, a case study on Chinese airport network (CAN) is conducted using the proposed model. Through encapsulating it into multi-layer infrastructure viak-core decomposition algorithm, Laplacian energy maximization for the sub-networks is discussed which can provide a useful tool for the decision-makers to optimize the robustness of the air transportation network on different scales.
Keywords:air transportation network; Laplacian energy; robustness; multi-layer networks
Air transportation network (ATN) is one of the most important and critical infrastructures in today’s global economy. It is responsible for the transportation of millions of people every day and still expects to expand in the future. The rapid growth of air traffic demand on the current air transportation network will lead to serious problems such as flight delays, airspace congestion, and flight cancelation due to limited airport resources and airspace capacities. Hence, more robust air transportation networks are required to sustain increasing travel demand, which is able to endure the failure of airports and routes.
In recent years, there has been a growing concern in the air transportation network and assessment of its robustness. Most of these studies applied the complex network theory to characterize the topological structure and the dynamic behavior of air transportation networks. In these studies, airports are denoted by nodes and flights between airports are denoted by edges. Guimera et al.[1]found that the worldwide airline network (WAN) is a scale-free network with small-world properties. Barrat et al.[2]studied the correlations between weighted quantities of the WAN and found a strong correlation between the traffic flow and the network’s topological properties. Zhang et al.[3]investigated the development of the Chinese airport network, including the topology, the traffic and the interplay between them. Cardillo et al.[4]pointed out that the air transportation network is a multilayer network. The characteristics and properties of different layers may vary from each other.
More recent work has examined the reliability of the air transportation network facing either errors or attacks. Lordan et al.[5]presented a methodology for the detection of critical airports in the global ATN and compared the effectiveness of several node selection criteria to effectively attack the network. Wandelt et al.[6]proposed a dynamic robustness measure considering the rerouting of the passengers and presented techniques for efficient analysis of the network attack. Wijdeveld[7]made a detailed study of the robustness of both the airline networks and alliance networks in Europe. Most of this research simulates a random attack or intentional attack on the network and evaluates the robustness through network metric such as the largest giant component, clustering coefficient, efficiency, etc. However, a very limited number of studies focus on topology optimization. Dunn et al.[8]adopted two strategies to improve the resilience of air traffic networks to spatial hazard. Wei et al.[9]proposed solving the flight routes addition problem by maximizing the algebraic connectivity. Yang et al.[10]first introduced Laplacian energy to air transportation networks, which is considered to be a fairness measure of the network.
Inspired by previous research, in this paper, we intend to measure the robustness of the air transportation network with a flight routes addition challenge by testing Laplacian energy. Three algorithms are applied to search for the maximum Laplacian energy and the corresponding optimal network design. By dividing the ATN into multi-layer networks, the optimal route addition strategies for different layers are achieved by the proposed algorithm. The results can provide design strategies for the future development of the air transportation network.
1.1 Laplacian energy for air transportation network
A graphG=(V,E,W) is used to describe the air transportation network. The vertex setV={vi:i=1,2,…,n};n=![]() denotes the number of distinct airports, and the edge setE=(ei:i=1,2,…,m);m=
denotes the number of distinct airports, and the edge setE=(ei:i=1,2,…,m);m=![]() represents the number of direct flight routes between pairs of airports. Each edgee=(vi,vj) is attached with a weightwijto measure the robustness of the flight route. If there is no edge betweenviandvj,wij=0. In most cases, there is a return route between pair of airports. Therefore, we assume thatGis an undirected network, in whichwij=wji.
represents the number of direct flight routes between pairs of airports. Each edgee=(vi,vj) is attached with a weightwijto measure the robustness of the flight route. If there is no edge betweenviandvj,wij=0. In most cases, there is a return route between pair of airports. Therefore, we assume thatGis an undirected network, in whichwij=wji.
Then, the weighted adjacent matrixA(G) can be expressed as follows:
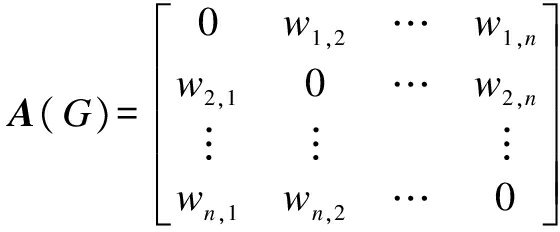
(1)
The weighted Laplacian matrixL(G) is defined based on the adjacent matrixA(G). Each itemlijofL(G) can be written as
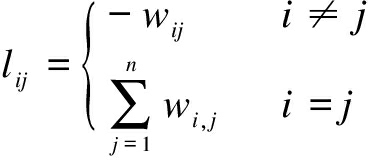
(2)
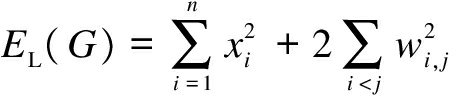
Assume thatGis a weighted network withnvertices, andλ1,λ2,…,λnbe the eigenvalues of its Laplacian matrix. The Laplacian energy is defined as the sum of the squares of all the eigenvalues:
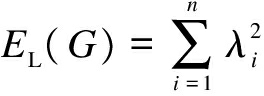
(3)
1.2 Laplacian energy and network robustness
Traditionally, the node connectivity and edge connectivity are the two metrics to evaluate a graph’s robustness. The node (edge) connectivity of a graph is the minimum number of node (edge) deletions sufficient to disconnect it.
In order to show the limitation of node (edge) connectivity metric and the better performance of the Laplacian energy, two different topologies are shown, where Fig.1(a) is the line topology and Fig.1(b) is the star topology. It is clear that the node connectivity and edge connectivity for both topology are 1. However, the star topology should be more robust because in Fig.1(b) only the failure of Node 1 can disconnect the network, while in Fig.1(a) either Node 2 or Node 3 fails can cause the network to disconnect. The robustness features of the two topologies are intuitively different. However, neither the node connectivity nor edge connectivity can reflect the difference between these two topologies. Nevertheless, the Laplacian energies of Figs.1(a) and (b) are 16 and 18, respectively, which show that the star topology is more robust than the line topology. This example demonstrates that the Laplacian energy is a finer measurement for network robustness.
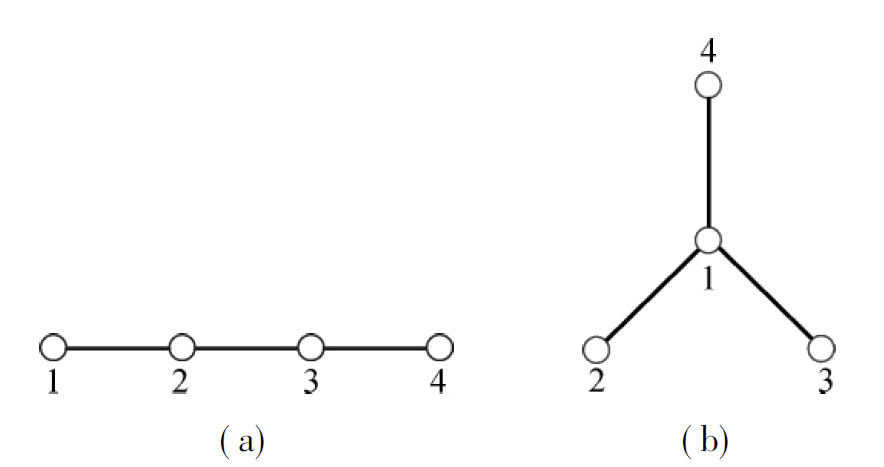
Fig.1 Line topology and star topology. (a) Line topology; (b) Star topology
We further demonstrate that the weight of the edges also have a direct influence on the robustness of the network through a numerical experiment. In the experiment, we generate 62 different networks in the same topology with different weight distributions. These networks are all scale-free networks with 200 vertices, in which weights are assigned to one of three typeswij={1,2,3} in different proportions. The weight of links represents its invulnerability. We assign weight 1 to the edges with the edge failure probability of 5%, weight 2 to the edges with the edge failure probability of 3% and weight 3 to the edges with the edge failure probability of 1%. Then the edges deletion process is conducted for every network in 1×10⁴trails. We count the times of network failure (network becomes disconnected) in terms of Laplacian energy. The results are shown in Fig.2. It can be easily observed that the network failure times has a negative linear correlation with the Laplacian energy. This is because a greater Laplacian energy represents a high percentage of large weight, which leads to a high invulnerability of the network. Thus, the Laplacian energy can be considered to be a good measurement for the robustness of weighted networks.
1.3 Laplacian energy maximization for flight routes addition problem
In real-life operation, it is actually impossible to rebuild an entirely new air transportation network for both regional and national scopes. Instead, in order to maintain and improve the robustness of the existing network,
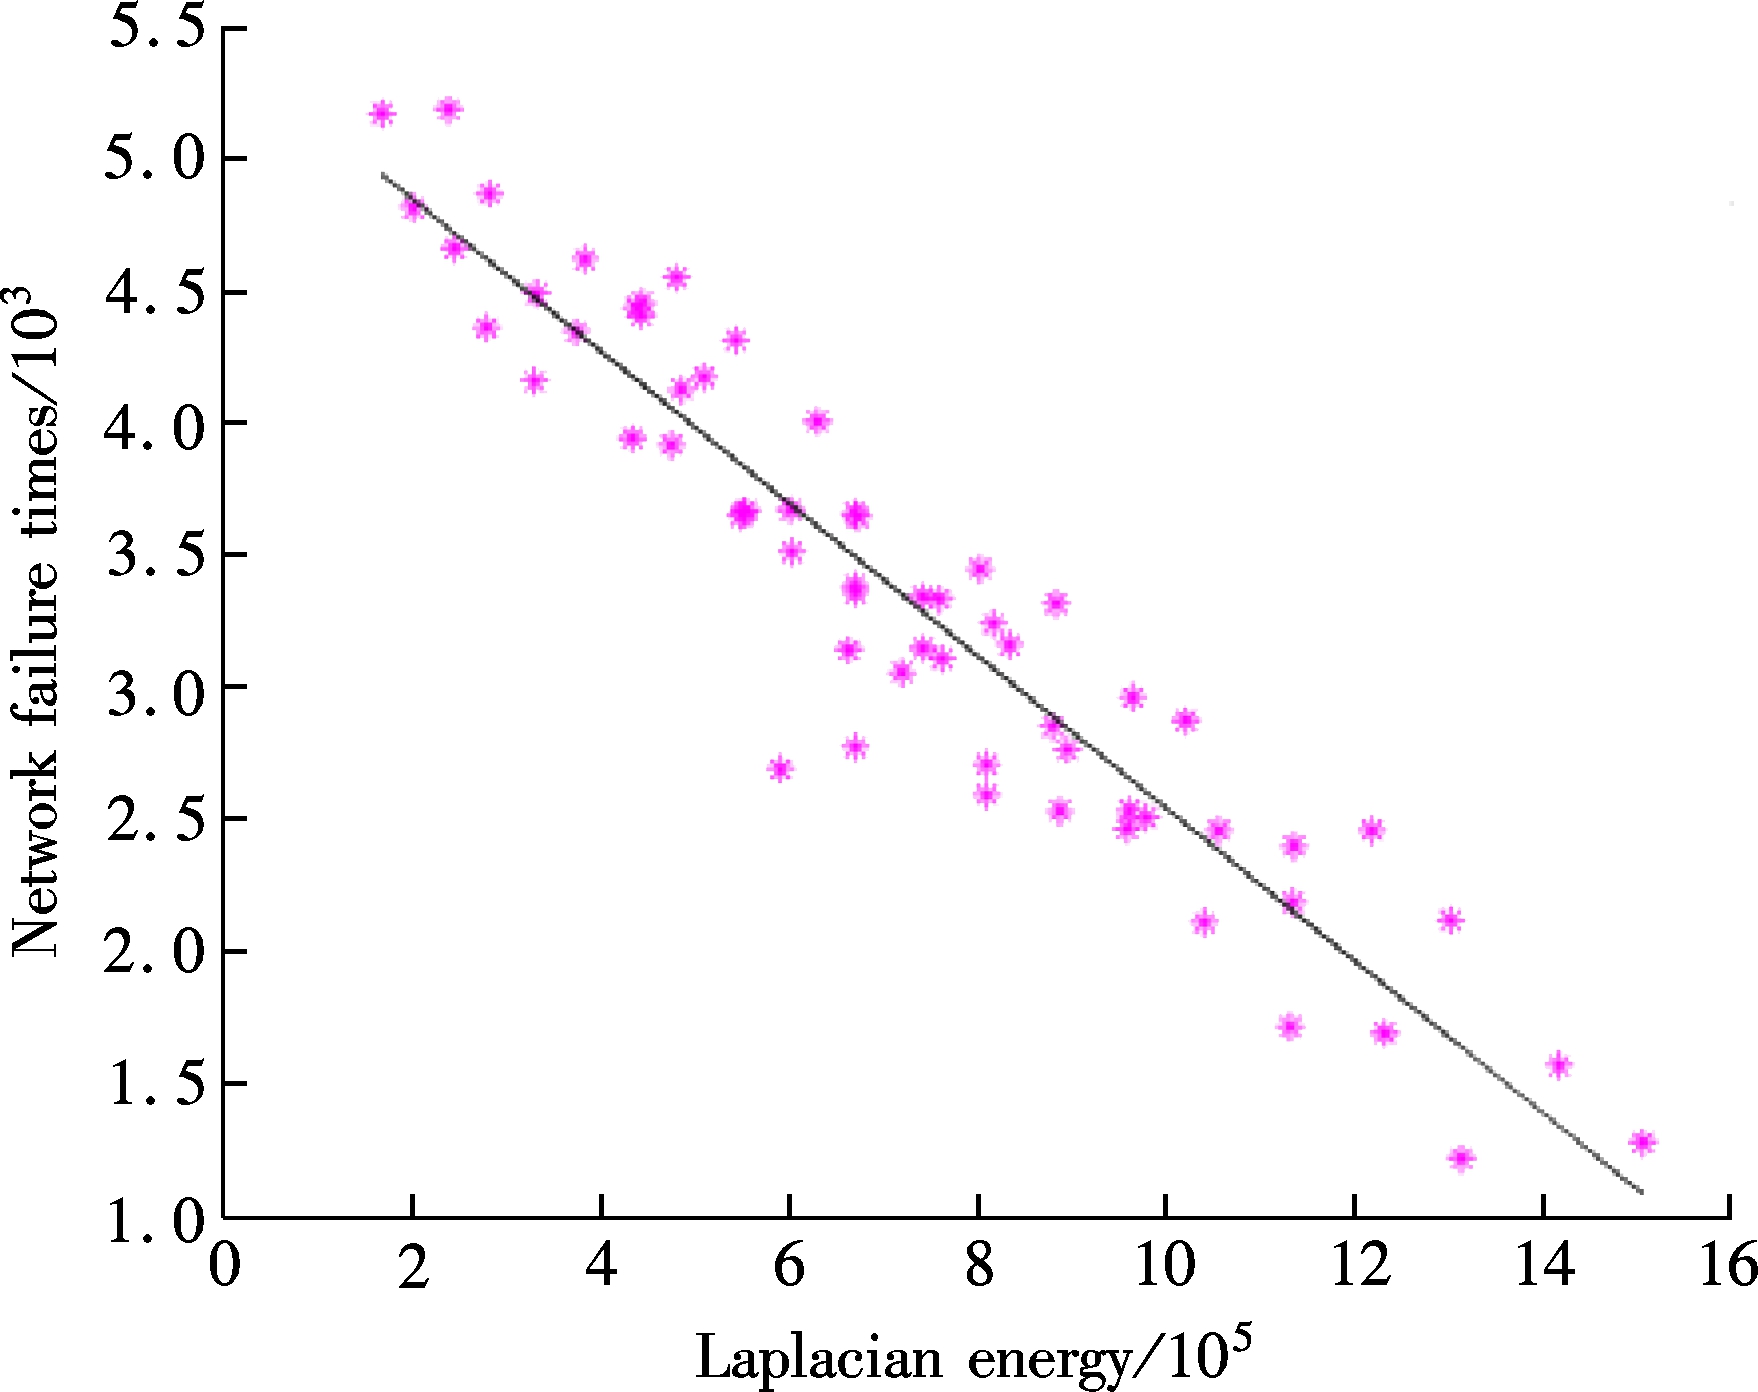
Fig.2 Network failure times in terms of Laplacian energy
adding a few routes (edges) restricted by airline budgets, weather conditions, etc., is imperative. The Laplacian energy, which can be regarded as one kind of graph entropy[11], takes into account not only the local environment but also the global environment information of the network. Hence, it is possible to use the Laplacian energy to measure and optimize the robustness of the air transportation network, which has been proved to be a reliable measurement for the robustness of both unweighted and weighted networks. The goal of this research is to find the optimal strategy for the selection of the potential edges which can maximize the Laplacian energy of the air transportation network.
As discussed early in this paper,G=(V,E0) is the graphical description of the existing weighted air transportation network, where the node setVis the collection of all the airports in this network and the edge setE0contains the existing edges between airport pairs. The size of setVisnand the size ofE0ism. The objective is to maximize the Laplacian energyEL(G) with a fixed numberkof edge additions based onE0. The edges to be added are given in the pre-determined setP. All the weights of the edges in setE0andPare non-negative integer values betweenwminandwmax. We denote the routes to be added as a set of ΔE. For the addition edges, as it may be impossible to establish a new route between two extremely close airports, the distance of the candidate routeD(ΔEi)should be longer than the minimum distanceDmin. Therefore, the flight routes addition problem can be expressed as
maxEL(G(V,E0+ΔE))
(4)
s.t. ![]() =k
=k
ΔE⊆P P∩E0=∅
wi,j∈{0,{wmin,wmax}}
D(ΔEi)>Dmin i=1,2,…,k
For the given air transportation networkG(V,E0), the goal of the optimization is to addkedge from setPwith the maximalEL(G(V,E0+ΔE)). According to the proof by Wei et al.[9], the flight routes addition problem is NP-hard. With the increase of![]() andk, the computing time is extremely long. Therefore, two heuristic algorithms are proposed for solving this problem and the depth-first search (DFS) technique is also used for the comparison of the optimal solution.
andk, the computing time is extremely long. Therefore, two heuristic algorithms are proposed for solving this problem and the depth-first search (DFS) technique is also used for the comparison of the optimal solution.
2.1 Depth-first search algorithm
Solving the flight routes addition problem is very computationally expensive. However, since we only search for the best addition of a given lengthk, it is capable of recursively implementing a standard DFS technique, which always addskroutes. DFS can always find the optimal solution of the problem, and thus can be used as the baseline for the evaluation of the other two heuristic algorithms introduced later. The drawback of the DFS is that the time complexity increases exponentially with the size ofk. Therefore, the DFS can only be used for a small network and a limited routes addition problem.
2.2 Greedy algorithm
The greedy algorithm is an algorithm that follows the problem solving heuristic of making the locally optimal choice at each stage with the hope of finding a global optimum. In many problems, a greedy strategy probably does not produce an optimal solution, but it may yield locally optimal solutions that approximate a global optimal solution in a reasonable time. For the flight routes addition problem, we add one edgeei,jwhich triggers the largest increase inEL(G) for each iteration. The loop terminates whenkedges are added to the original network.
As it is proved by Qi et al.[11], the Laplacian energy can also be described as
(5)
withxi=![]() wi,j=
wi,j=![]() wvi,u, whereN(vi) is the neighborhood ofvi.
wvi,u, whereN(vi) is the neighborhood ofvi.
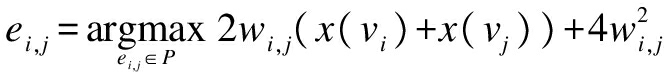
Based on Eq.(5), we can easily prove that after the addition of edgeei,j, the increase of the Laplacian energy (ΔEL)i,jcan be expressed as

(6)
As it can be seen from Eq.(6), the increase ofEL(G) is associated with the weight of the additional edge and the sum weight of the vertices that constitute the additional edge. Hence, we can design the greedy method based on the equation which always selects the edgeei,jfromPwith the maximal (ΔEL)i,jfor each step. The complete algorithm is listed in Algorithm 1.
Algorithm1 Greedy algorithm
Given graphG=(V,E), candidate edge setPand all the edges weights inE0andP
LetE=E0
for 1 tokdo
E=E+ei,j;P=P-ei,j
end for
OutputG=(V,E)
2.3 Monte-Carlo tree search (MCTS) algorithm
As an alternative to the exhaustive search, another search heuristic method named the Monte-Carlo tree search algorithm which was recently introduced in general game playing[12]was used for solving the flight routes addition problem. The algorithm consists of two parts: exploration and exploitation. In the first phase, the game tree is explored by executing several random runs to evaluate the scores of each move. After several random runs, many typical moves are associated with stable scores. These scores are utilized in the exploitation phase. Then random runs are executed again, but this time scores are taken into account for deciding which move to make.
We adapt the idea behind MCTS to find a promising solution, which containskroutes to be added to the air transportation network. Our algorithm is shown in Algorithm 2. In the exploration phase, some random solutions are performed (Lines 2 to 7). For each potential solutionA, we record how much addition of a route upgrades the Laplacian energy (encoded inR, Line 5). Here,Ris the map from route indices to ΔEL. The overall result for all candidate solutions is stored in RES. The second part of the algorithms is the exploitation (Lines 8 to 26). First, we group all ΔELper route (Lines 10 to 15). Afterwards, we compute the average ΔELfor each candidate route (Lines 16 to 18). Finally, we run new random solutions with the average ΔELas weights for the random choice of routes (Lines 19 to 25). Intuitively, the exploration phase assigns weights to the routes (higher weights imply larger ΔEL) and the exploitation phase picks randomly routes but with a bias towards a higher weight. It is worth mentioning that the number of the iterations in exploration and exploitation has a considerable impact on the accuracy of the best solution. The larger the number of iterations, the closer the solution is to the optimum.
Algorithm2 Monte-Carlo tree search (MCTS) algorithm
1 Let RES=[];
2 //Exploration phase
3 forl∈(1,2,…,X) do
4 Create a random routes addition listAof lengthk
5 LetRbe the evaluation ofA
6 RES.append(R)
7 end for
8 //Exploitation phase
9 while not finished do
10 WR=[]
11 forl∈(1,2,…,X) do
12 forl2∈(1,2,…,k) do
13 WR[RES[l].route].append (RES[l].ΔEL)
14 end for
15 end for
16 forl∈(1,2,…,![]() )
)
17 WR[l]=AVG(WR[l])
18 end for
19 let RES=[];A=[]
20 while len(A)<kdo
21 Random pick a routeufromPwith probability WR[u] which has not yet occurred inA
22 A. append(u)
23 end while
24 LetRbe the evaluation ofA
25 RES.append(R)
26 end while
2.4 Algorithms comparison
Simulations are conducted to compare the performance and computation time of the DFS algorithm, greedy algorithm and MCTS algorithm for the flight routes addition problem. A small-word network withn=20 is applied in our experiments since the DFS takes an extremely long computation time when the size of the candidate edge setPis large. The generated network is denoted asG(V,E0). The existing edges inE0and the candidate edge setPare assigned with three types of weightwi,j={1,2,3}which represent the robustness of the edges.
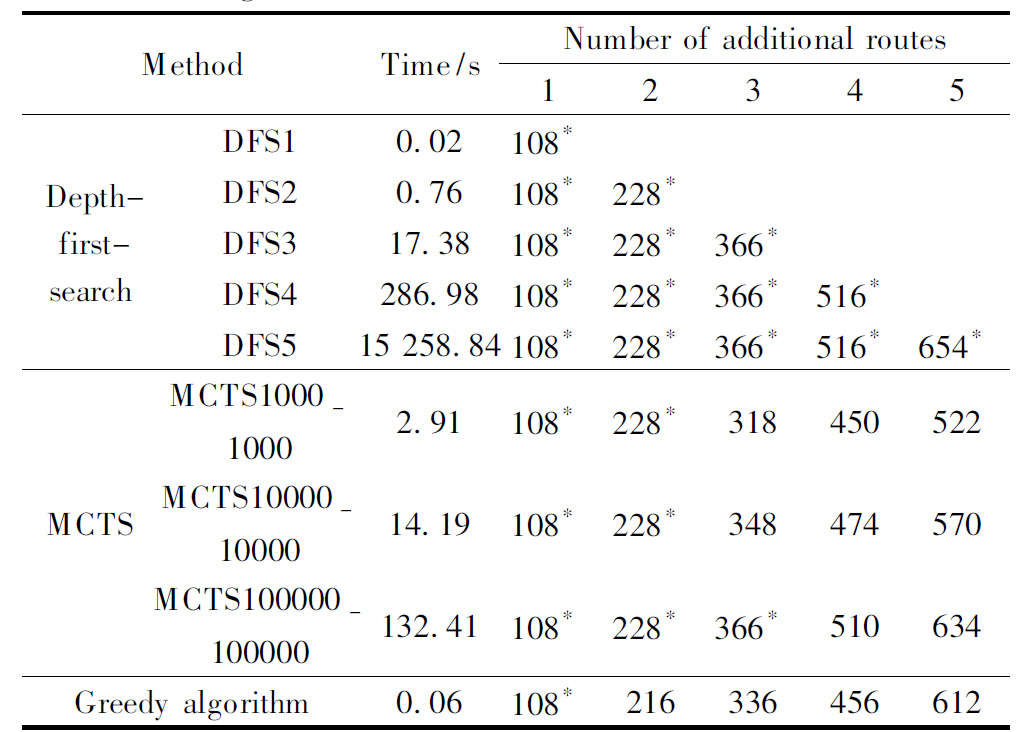
We evaluate the performance (measured by ΔEL) and computation time of the three algorithms with different numbers ofk. The results in Tab.1 show that the DFS always yields the best performance. However, the running time increases exponentially withk. It takes a few hours for computation whenkis 5. Hence, the DFS can only be used for a limited route addition problem and here it is taken as the baseline for the evaluation of the other two heuristic algorithms. The performance of the MCTS increases with the increase in the number of iterations in exploration and exploitation, but the running time needs to be sacrificed to achieve a better solution. The MCTS with 1×10⁵runs has the second best performance with an acceptable running time. The greedy algorithm has the worst performance whenkis less than three. However, with the increase ofk, the performance of the greedy algorithm gradually overtakes that of the MCTS with 1×10³runs whenk=3 and the MCTS with 1×10⁴runs whenk=6.
In summary, no matter whatkis, the DFS always yields a better solution than others do. However, the long computation time is unacceptable whenkis above 4. Whenkis small, the MCTS with 1×10⁵runs shows a similar performance to the DFS. If we select a small number of edges fromP, the MCTS should be selected to maximize the network robustness. Ifkbecomes larger, the greedy algorithm should be adopted to provide the efficient computation speed with an acceptable performance.
Tab.1 Comparison of the performance and computation time of the three algorithms
K(W〛MethodTime/sNumberofadditionalroutes12345Depth⁃first⁃searchDFS1002108∗DFS2076108∗228∗DFS31738108∗228∗366∗DFS428698108∗228∗366∗516∗DFS51525884108∗228∗366∗516∗654∗MCTSMCTS1000-1000291108∗228∗318450522MCTS10000-100001419108∗228∗348474570MCTS100000-10000013241108∗228∗366∗510634Greedyalgorithm006108∗216336456612
Note: *means the best performance.
In this section, the Chinese airport network (CAN) is investigated as the case study. Differently to the previous work[9-10], we divide the CAN into multi-layer infrastructures which can give some insights to the underlying properties of different sub-networks. Then, we give the advice that the top 5 routes should be added within the layer and between two layers to increase robustness.
3.1 CAN introduction
According to the data provided by the civil aviation administration of China (CAAC) in 2015, there are 200 airports and 1 755 air routes in the CAN. We first define the CAN as an unweighted and undirected network whose nodes are the airports and the edges are the air routes between two airports. To represent the network, the adjacent matrixAis temporarily taken as a binary adjacent matrix, in which elementaij=1 when there is a flight link between city-pairiandjandaij=0 otherwise.kirepresents the degree of nodei.
3.2 CAN decomposition
A previous study[13]discovered that the airport network can be divided into multi-layer networks which can reveal some underlying properties of the air transportation network. Here, we analyze the CAN through thek-core decomposition algorithm, which is used to exact the most densely connected community. The steps of the algorithm can be expressed as follows:
Step1 All the nodes withki=1 are removed. These nodes form the periphery layer. The nodes that become isolated after the removal process are also included in the periphery layer.
Step2 In the next iterations, all the nodes with![]() =p(p=2,3,…)are removed, if the removal in stepptriggers a new node with the degree less thanp, it is removed in the current iteration as well (
=p(p=2,3,…)are removed, if the removal in stepptriggers a new node with the degree less thanp, it is removed in the current iteration as well (![]() is the degree of nodeiafter removing nodes from previous iterations).
is the degree of nodeiafter removing nodes from previous iterations).
Step3 The algorithm stops in iterationspmaxwhen all nodes are removed from the network. In the CAN,pmax=26. The nodes removed in iterationspmaxform the core layer. Except for the nodes in the periphery layer and core layer, all the rest of the nodes form the bridge layer.
As it is shown in Fig.3, there are 35 airports in the core layer which are 17.9% of airports in the CAN. These airports are mainly located in eastern China and are densely connected and bear 66.43% of the total traffic flow. Most cities are located in provincial capital cities or the economically developed cities in China.
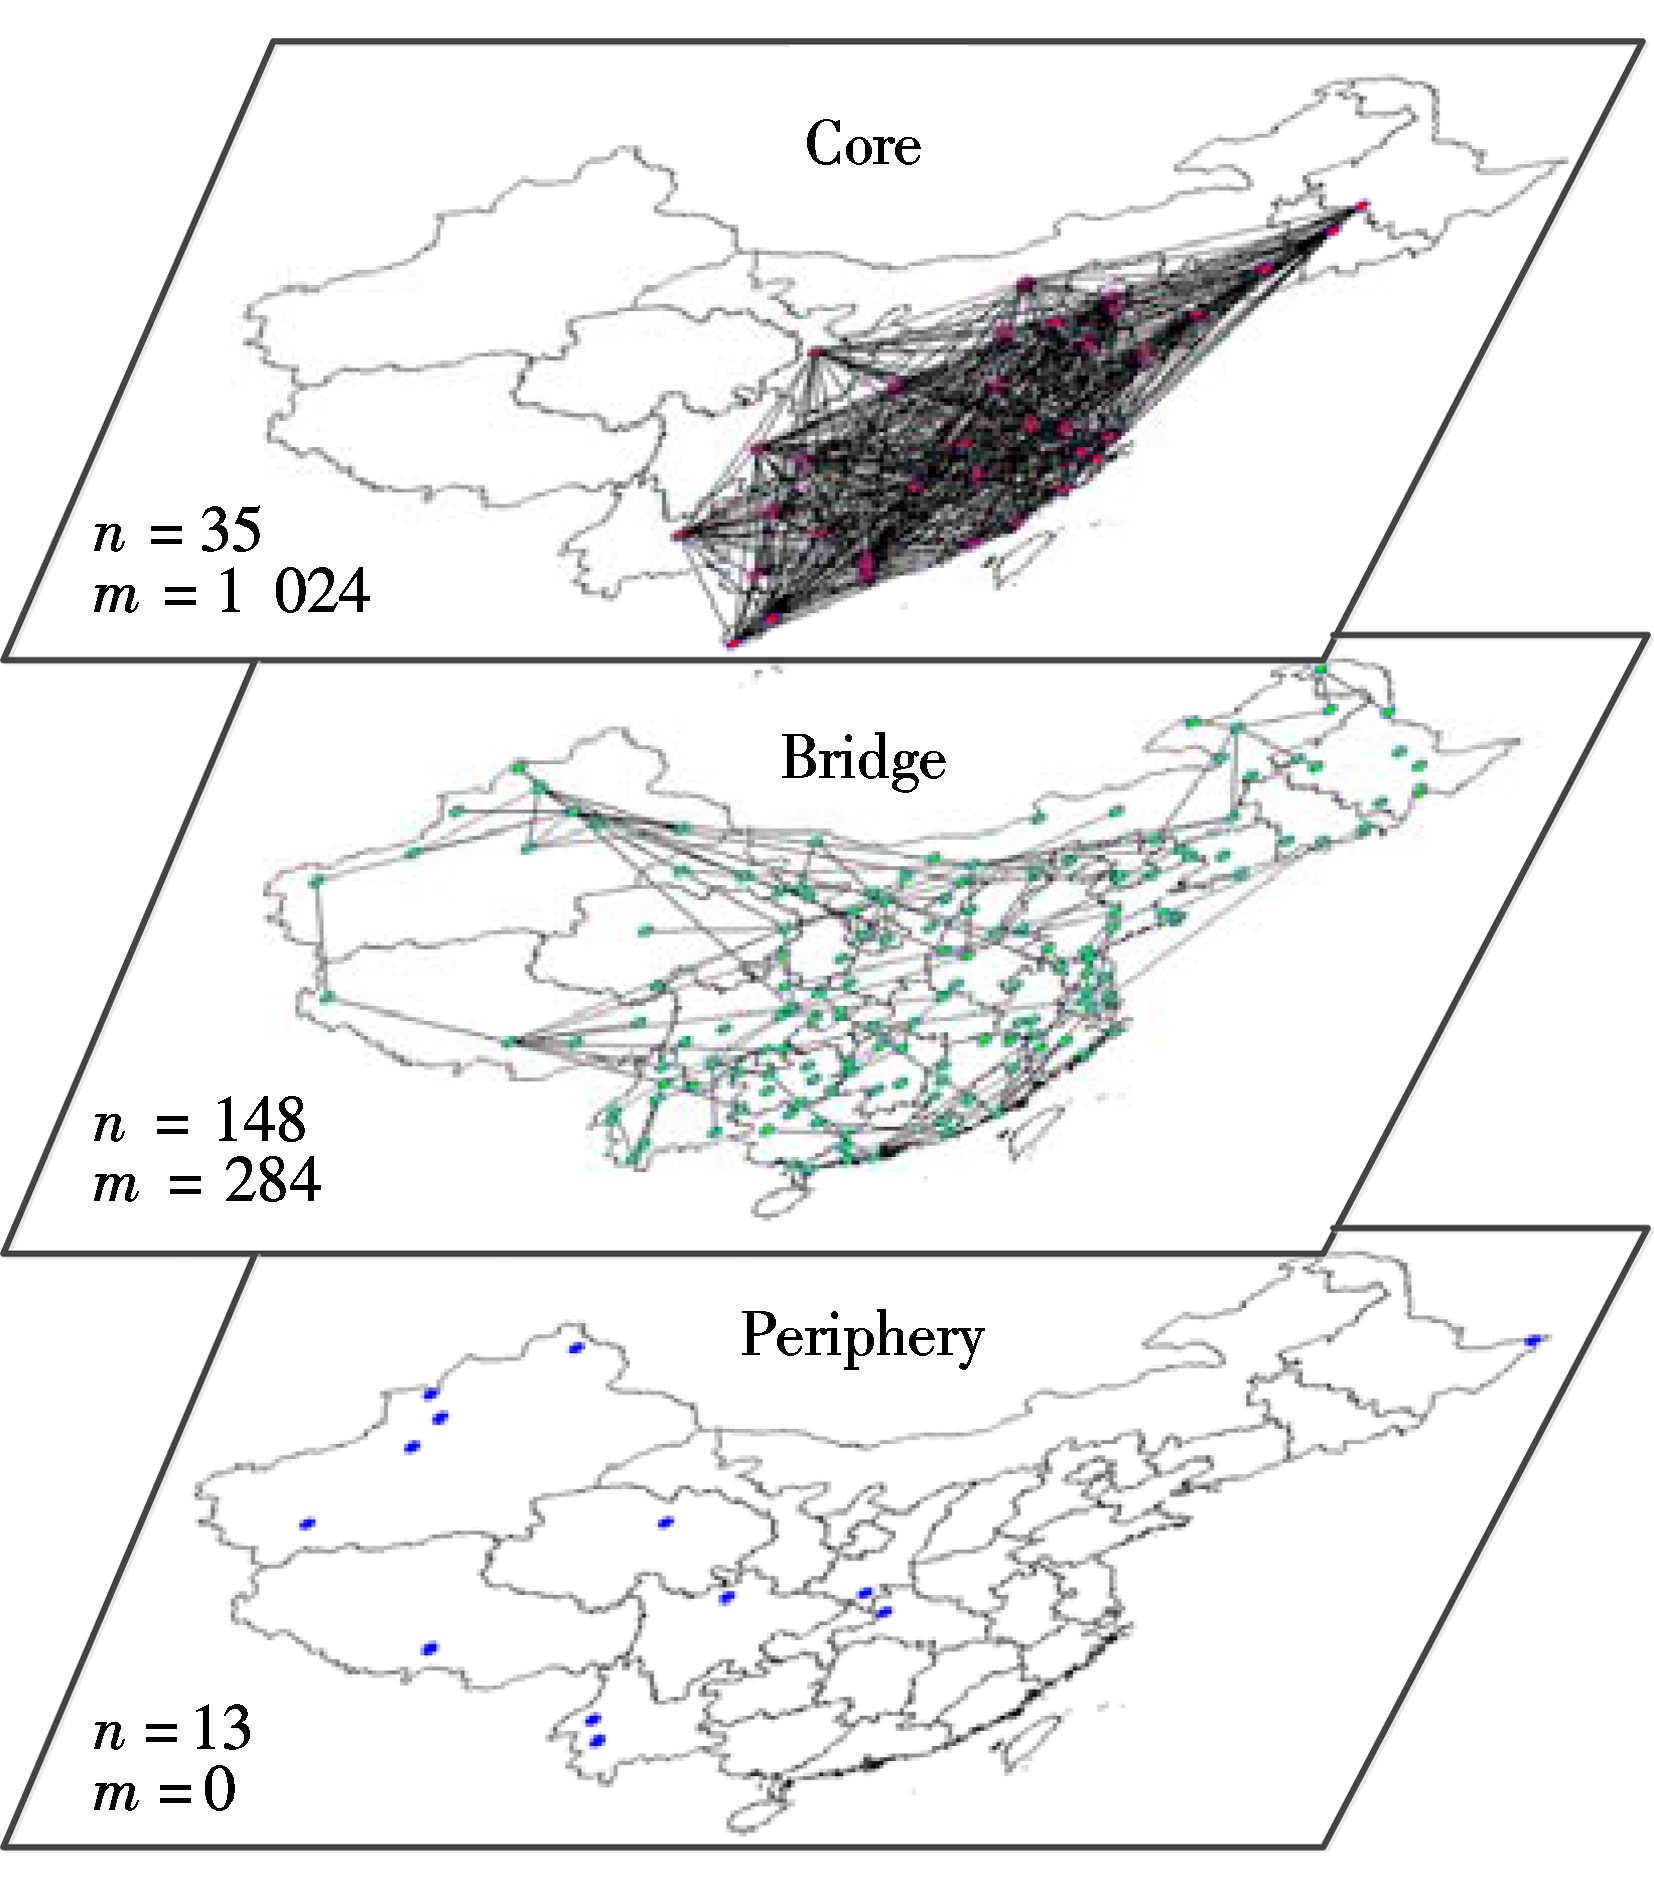
Fig.3 The multi-layer structure of the CAN
The bridge layer contains 148 airports which include 75.5% of the airports in China. Most of airports are located in Tier 2 and Tier 3 cities in China. The traffic flow distribution is quite different from the core layer. Only 3.88% of the total traffic flow operates within the bridge layer every week while 28.94% of the total traffic flow connects the core layer and bridge layer.
In the periphery layer, there are only 13 airports which account for 6.63% of the airports in the CAN. As is illustrated in Fig.3, all the airports are located in remote areas and there are no flights within this layer at all. The airports in this layer tend to connect with the airports in the bridge layer more than with those in the core layer.
3.3 Flight routes addition for multi-layer networks
The current CAN is weighted based on the historical flight departure delay information obtained from January 19, 2015 to February 19, 2015, which includes more than 48×104flight data. The edge failure probability can be estimated from the ratio of the flights which are delayed more than one hour in both directions to the total flights. We assign weightwij=3 to the edges with failure probability in [0, 5%), weightwij=2 to the edges with failure probability in [5%, 10%) and weightwij=1 to the edges with failure probability in [10%,∞). We assume that the weight of a candidate route to be added equals the mean value of the weight of two related airports.
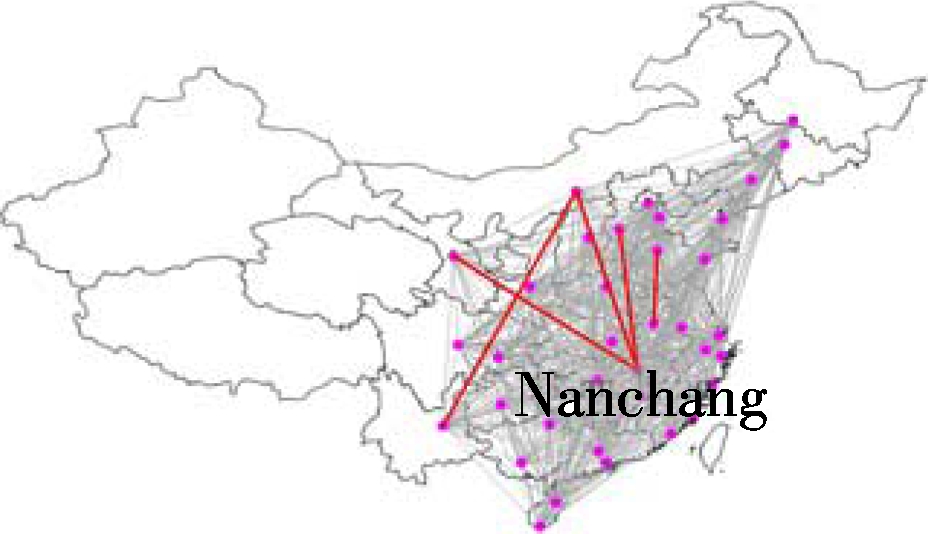
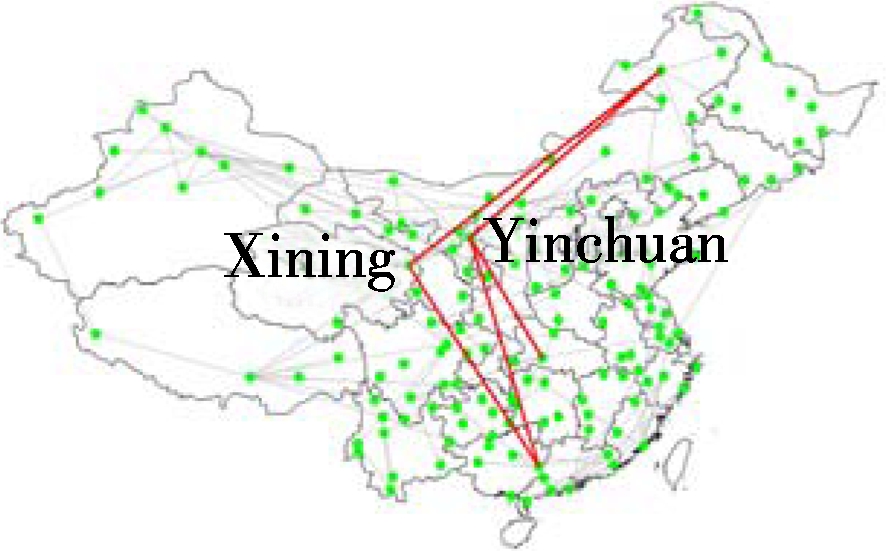
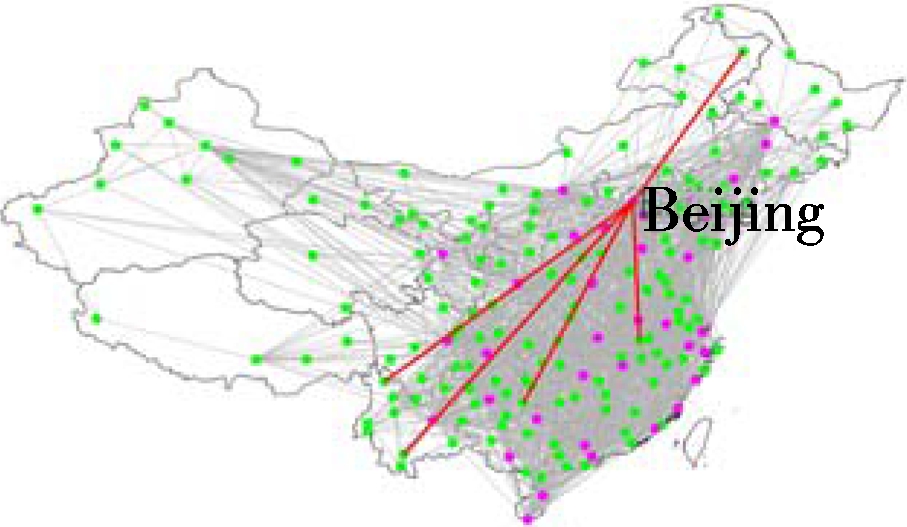
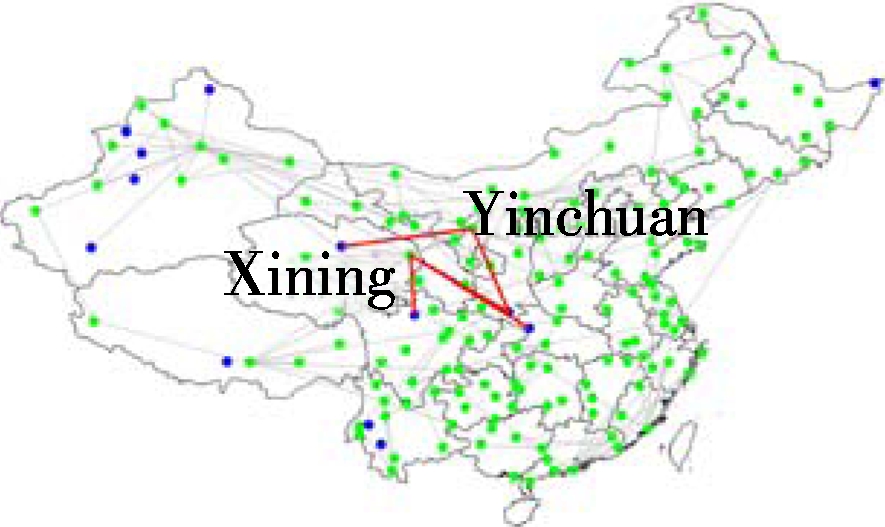
Since the MCTS algorithm has a better performance than the greedy algorithm for a small number of routes addition, we employ it to select the top five routes for the multi-layer networks.Dminhere is set to be 200 km. The routes to be added within the periphery layer and the ones between the periphery layer and core layer are not taken into consideration. The top five additional routes for the four different sub-networks of the CAN are shown in Fig.4. We can see that each sub-network tends to connect limited airports. Within the core layer, it tends to add more routes to Nanchang, while Beijing is preferred between the core layer and bridge layer. Besides, within the bridge layer and between the bridge layer and periphery layer, it is more inclined to connect Xining and Yinchuan. The purpose of flight routes addition for different sub-networks may vary from each other. For example, the core layer sustains most of China’s traffic flow. The flight routes addition within the layer can not only strengthen the backbone of the Chinese network, but also enhancethe mobility for different areas, while the flight routes addition between the core layer and bridge layer can reinforce the connection between general airports and
(a) (b)
(c) (d)
Fig.4 Connection tendencies of different sub-networks. (a) Within the core layer; (b) Within the bridge layer; (c) The core-bridge layer; (d) The bridge-periphery layer
the hubs which is of great benefit to shaping the pattern of the hub-and-spoke structure. These results can help decision makers to maintain and modify the structure of an existing regional or nationwide network and design strategies for the future development of the air transportation network on different scales.
In this paper, Laplacian energy is employed to analyze the flight routes addition problem. Three algorithms are presented and compared to solve the proposed problem. Numerical simulations have been made to investigate the trade-off among the three methods. The DFS algorithm is used to find the global optimum with a long computation time. The greedy algorithm can find local optimals in quite a short time and the MCTS algorithm adapted is employed to perform a computationally efficient search with limited route additions. Then, a case study of the CAN is investigated through encapsulating into the multi-layer infrastructure via thek-core decomposition algorithm and performs route additions for the four sub-networks. Historical flight delay data from one month is used for weighting the corresponding edges. The results can provide practical advice for the decision-makers to optimize the robustness of the network on different scales.
[1]Guimera R, Amaral, L A N. Modeling the world-wide airport network [J].TheEuropeanPhysicalJournalB—CondensedMatterandComplexSystems, 2004,38(2): 381-385. DOI:10.1140/epjb/e2004-00131-0.
[2]Barrat A, Barthelemy M, Pastor-Satorras R, et al. The architecture of complex weighted networks [J].ProceedingsoftheNationalAcademyofSciencesoftheUnitedStatesofAmerica, 2004,101(11): 3747-3752. DOI:10.1073/pnas.0400087101.
[3]Zhang J, Cao X B, Du W B, et al. Evolution of Chinese airport network [J].PhysicaA:StatisticalMechanicsandItsApplications, 2010,389(18): 3922-3931. DOI:10.1016/j.physa.2010.05.042.
[4]Cardillo A, Gómez-Gardenes J, Zanin M, et al. Emergence of network features from multiplexity [J].ScientificReports, 2012,3: 1-6. DOI: 10.1038/srep01344.
[5]Lordan O, Sallan J, Simo P, et al. Robustness of the air transport network [J].TransportationResearchPartE:LogisticsandTransportationReview, 2014,68: 155-163. DOI:10.1016/j.tre.2014.05.011.
[6]Wandelt S, Sun X Q, Cao X B. Computationally efficient attack design for robustness analysis of air transportation networks [J].TransportmetricaA:TransportScience, 2015,11(10): 939-966. DOI:10.1080/23249935.2015.1089953.
[7]Wijdeveld S J. Airline and alliance networks: topology and robustness from a complex network approach [D]. Delft, the Netherlands: Department of Air Transport and Operations, Delft University of Technology, 2015.
[8]Dunn S, Wilkinson S M. Increasing the resilience of air traffic networks using a network graph theory approach [J].TransportationResearchPartE:LogisticsandTransportationReview, 2016,90: 39-50. DOI:10.1016/j.tre.2015.09.011.
[9]Wei P, Chen L J, Sun D. Algebraic connectivity maximization of an air transportation network: The flight routes’ addition/deletion problem [J].TransportationResearchPartE:LogisticsandTransportationReview, 2014,61: 13-27. DOI:10.1016/j.tre.2013.10.008.
[10]Yang C P, Mao J, Wei P. Air traffic network optimization via Laplacian energy maximization [J].AerospaceScienceandTechnology, 2016,49: 26-33. DOI:10.1016/j.ast.2015.11.004.
[11]Qi X Q, Fuller E, Wu Q, et al. Laplacian centrality: A new centrality measure for weighted networks [J].InformationSciences, 2012,194(5): 240-253. DOI:10.1016/j.ins.2011.12.027.
[12]Browne C B, Powley E, Whitehouse D, et al. A survey of Monte Carlo tree search methods [J].IEEETransactionsonComputationalIntelligenceandAIinGames, 2012,4(1): 1-43. DOI:10.1109/TCIAIG.2012.2186810.
[13]Du W B, Zhou X L, Lordan O, et al. Analysis of the Chinese airline network as multi-layer networks [J].TransportationResearchPartE:LogisticsandTransportationReview, 2016,89: 108-116. DOI:10.1016/j.tre.2016.03.009.
References
摘要:为了提高空域容量、缓解航班延误及提高航空网络鲁棒性,提出了基于拉普拉斯能量最大化的航空网络分层优化方法.首先,通过数值仿真论证了应用拉普拉斯能量作为衡量网络鲁棒性的有效性.然后,以拉普拉斯能量最大化为目标,建立了航线增加最优化模型.采用深度优先搜索算法、贪心算法及蒙特卡罗树形搜索算法3种方法对其进行求解,并通过仿真实验对比了3种算法的系统性能及计算效率.最后,以中国的实际航空网为例,在使用k核分解算法将其分解成多层网络的基础上,对每层子网络的拉普拉斯能量最大化问题进行了求解.仿真结果表明,所提出的方法可为决策者对不同层次的航空网络鲁棒性优化提供决策支持.
关键词:空中交通网络;拉普拉斯能量;鲁棒性;多层网络
中图分类号:V355
![]()
JournalofSoutheastUniversity(EnglishEdition) Vol.33,No.3,pp.348⁃354Sept.2017 ISSN1003—7985
DOI:10.3969/j.issn.1003-7985.2017.03.014
Foundationitems:The National Natural Science Foundation of China (No.61573098, 71401072), the Natural Science Foundation of Jiangsu Province (No.BK20130814).
Citation:Zheng Yue, Li Wenquan, Qiu Feng, et al.Laplacian energy maximization for multi-layer air transportation networks[J].Journal of Southeast University (English Edition),2017,33(3):341-347.
DOI:10.3969/j.issn.1003-7985.2017.03.014.