

(a) (b) (c)
Abstract:In order to investigate the sand mold strength after the aeration sand filling-high pressure squeeze molding process, a three-dimentional (3D) numerical simulation was introduced. The commercial finite element method (FEM) software ABAQUS combined with a revised Drucker-Prager/Cap model was used to simulate the squeeze compaction process. Additionally, the sand bulk density after the aeration sand filling process was tested by a specially designed experiment, which divided the whole sand bulk in the molding chamber into 5×9 regions and it was used as the input to simulate the squeeze process. During the simulation process, the uniform modeling simulation and the partition modeling simulation methods were used and the 3D numerical simulation results were compared with correlative benchmark testings. From the 3D numerical simulation results, it can be concluded that the uniform sand bulk density distribution can obtain a high quality sand mold and the revised Drucker-Prager/Cap model is suitable for handling the situation with the complex pattern. The 3D numerical simulation results can predict well the sand mold strength distribution and can be used as guidelines for the production practice.
Key words:green sand; aeration sand filling-high pressure squeeze molding; revised Drucker-Prager/Cap model; numerical simulation
Molding technology plays an important role in casting production and has great influence on the geometrical shape, the surface quality, and the mechanical properties of castings. To meet the continuously increasing demands for high quality near net shape castings, the aeration sand filling-high pressure squeeze molding method has been studied intensively[1-2]. Theoretical analysis and experimental testing are two traditional research methods in molding technology. 3D numerical simulation, as a modern engineering tool and an important supplementary tool, is frequently used by foundrymen for its high efficiency.
The aeration sand filling-high pressure squeeze molding method consists of two processes: the aeration sand filling process with low pressure compressed air and the subsequent high pressure squeeze compaction process[3]. For the aeration sand filling process, it is a typical gas-solid two-phase flow problem. Some different models, e.g., the continuous model, discontinuous model[4], and distinct cluster model[5], have been used to deal with this problem. Some research has been done in this field[6], while the simulation results have still not been verified with the sand bulk density data after aeration sand filling process. For the squeezing process, it is a static sand compaction problem and three types of nonlinearity of green sand are included during this process: the mechanical response nonlinearity, the structural nonlinearity and the contact nonlinearity[7]. The simulation of the squeezing process can be completed with some FEM software, e.g. ABAQUS. The mechanical model is of key importance for simulation due to the nonlinear characteristics of molding sand and its large deformation during the high pressure squeeze molding process. In this paper, a revised Drucker-Prager/Cap model is used for the mechanical model, which has been successfully used in the simulation of the squeezing process of soil[8-9]. The sand bulk density data after the aeration filling process has been tested by a specially designed experiment, which divides the whole sand bulk in the molding chamber into 5×9 regions.
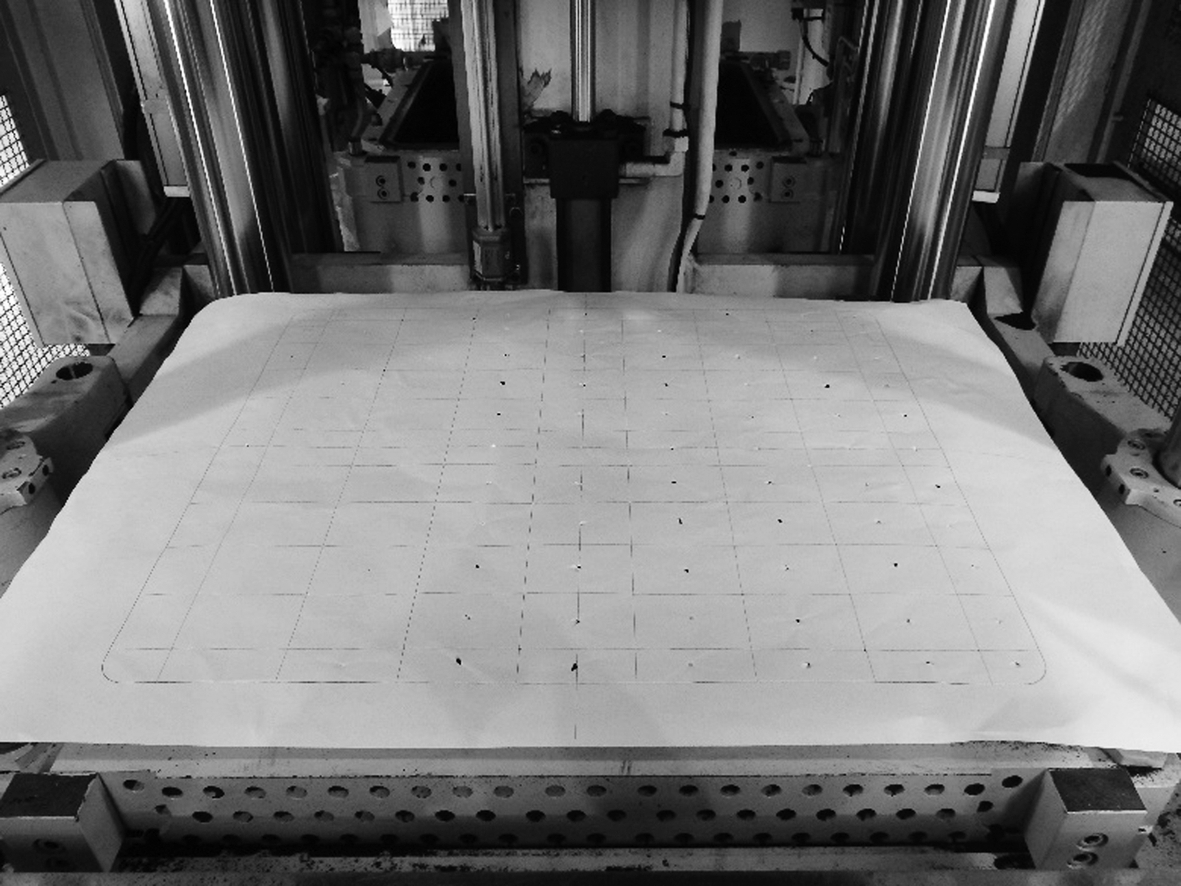
The flat pattern was used in the experiment. The air pressure was set to be 0.1 MPa during the aeration sand filling process and the squeeze pressure was set to be 1.0 MPa during the high pressure squeeze molding process. After the aeration sand filling process, the height of the sand mold was 260 mm, while the outcome was reduced to 180 mm when the high pressure squeeze molding process was finished. An aeration sand filling-high pressure squeeze molding machine (FCMX Ⅱ, Sinto Kogio, Ltd.) was used for this experiment. In the experiment, the strength of the sand mold was measured on the parting surface, the lateral surfaces (Sides A, B, C and D in Fig.1(a)) and the cut face (side E in Fig.1(a)) via a sand mold dynamometer (Georg Fischer, Swiss). Several squares were drawn onto the surfaces (see Fig.1(a)), and each square was measured twice.
(a) (b) (c)
Fig.1 Aeration sand filling-high pressure squeeze molding machine. (a) The layout of the mold for flat pattern; (b) Measurement of the parting surface; (c) Measurement of the lateral surfaces and the cut face
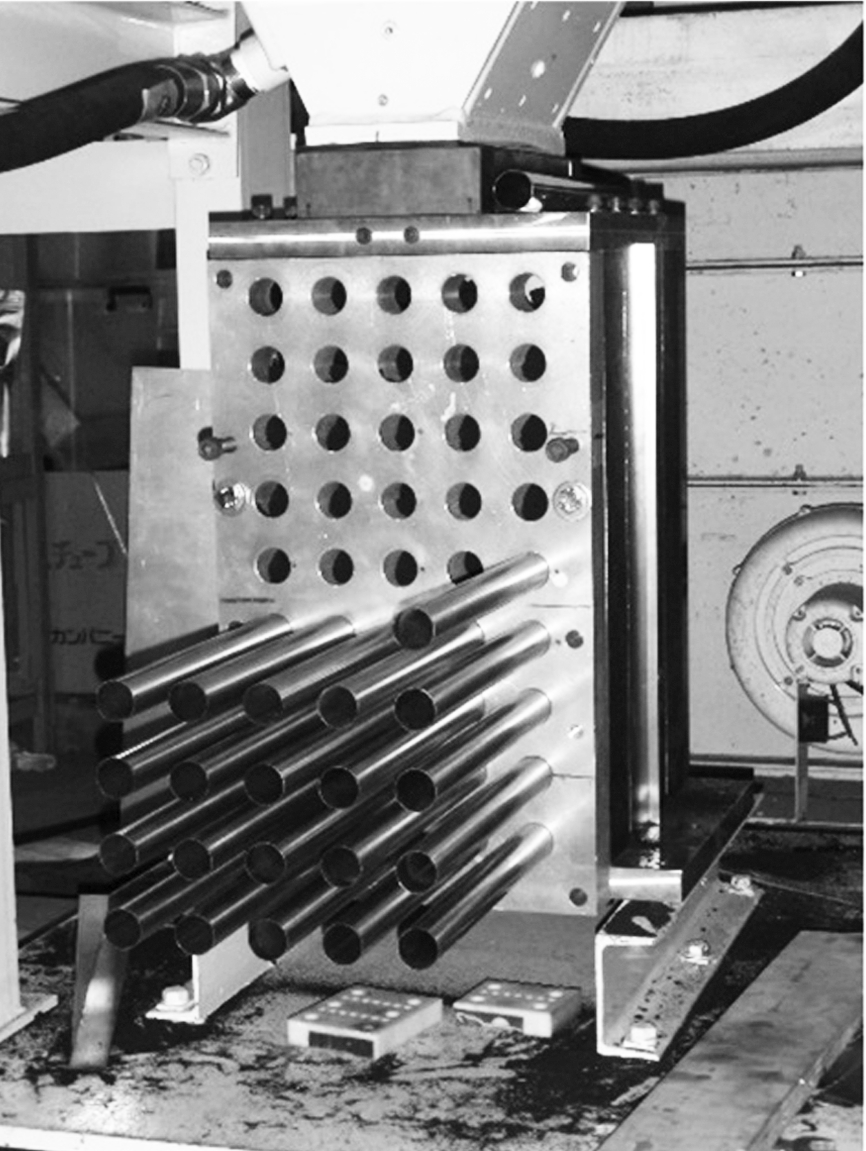
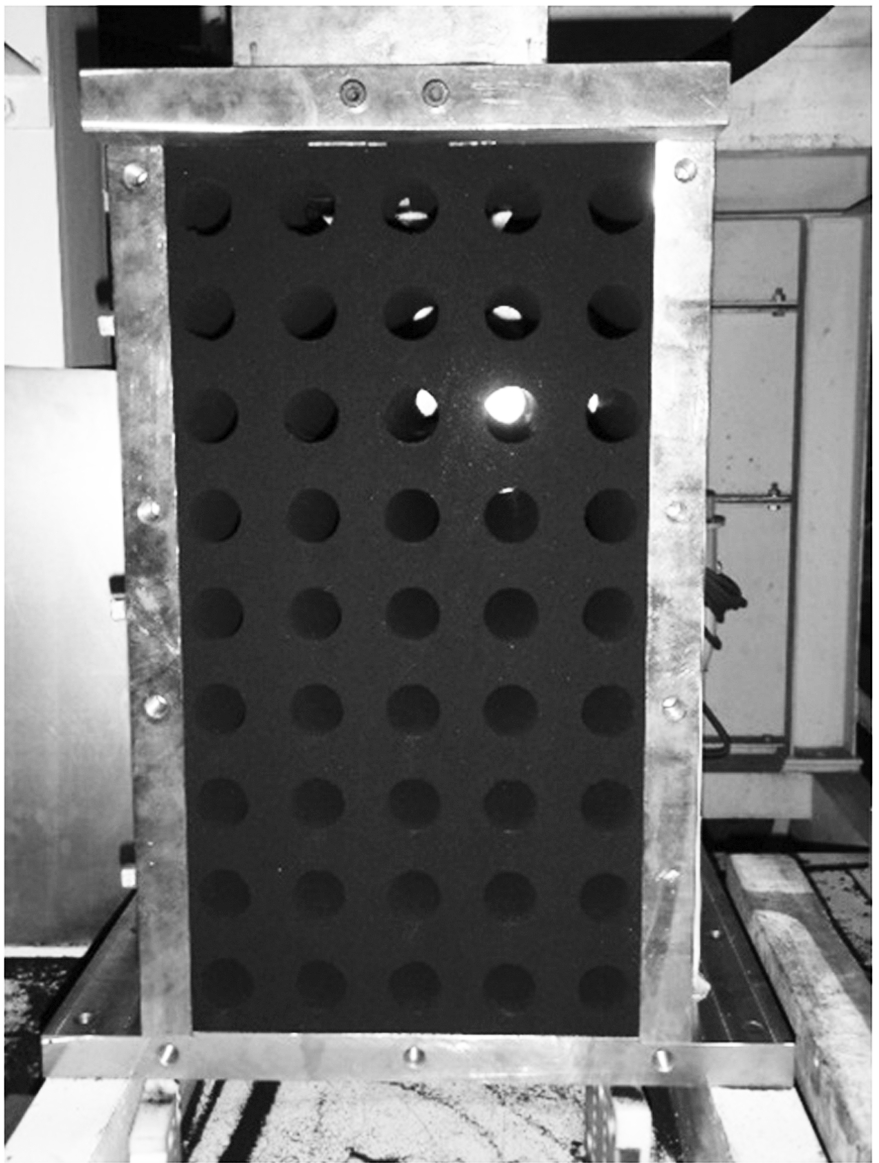
The sand bulk density distribution after the aeration sand filling process was used as the input for the numerical simulation of the high pressure squeeze molding process. Another testing machine (manufactured by Sintokogio, Ltd.) which was the same as FCMX Ⅱ but only half in size, was used to measure the sand bulk density distribution after the aeration sand filling process. The front plate of the modeling chamber was made by plexiglass in order to observe the sand flow during the aeration filling process. The left and right side panels of the modeling chamber had three slots, dividing the side panels into four equidistant parts. As the sand inside the modeling chamber was not tight enough after the aeration filling process, it was difficult to measure the sand bulk density. In order to obtain the data, the following experiment was designed and the steps are shown in Fig.2. First, three thin steel plates were inserted through the slots, which uniformly divided the sand inside the modeling chamber into four blocks (see Fig.2(a)). Then replacing the plexiglass
plate with a steel plate with 5×9 uniformly distributed holes on it after the aeration filling process (see Fig.2(b)). Tubes with the same diameter were inserted into the holes to get the sand out from the modeling chamber (see Fig.2(c)). The sand bulk density of the area is calculated as
ρ=![]() =
=![]() =
=![]() =
=![]()
(1)
where ρ is the sand bulk density; S is the area of the tube’s cross section; m is the mass of the sand inside each tube; D is the diameter of the tube and H is the distance between inserted two adjoining steel plates.
The remaining sand and the first steel sheet were removed after the measurement of the first layer (see Fig.2(d)), and then the remaining layers were measured according to the above steps until the measurement of the final layer was finished (see Fig.2(e)).


(a) (b) (c) (d) (e)
Fig.2 Measurement of the sand bulk density. (a) Inserting three thin steel plates through the three equidistant slots; (b) Replacing the front plate with the steel plate; (c) Inserting tubes into the holes to get the sand out; (d) Complete measurement of the first layer; (e) Measurement of the remaining layers according to the above steps
Due to the nonlinear characteristics of the molding sand and its large deformation during the high pressure squeezing part, the commercial FEM software ABAQUS was chosen for the simulation of the high pressure squeezing process. Fig.3 shows the revised Drucker-Prager/Cap model which is used for the mechanical model[10].

(a)

(b)
Fig.3 The revised Drucker-Prager/Cap model. (a) Yield surfaces in the p-t plane; (b) Typical cap hardening
Compared with the typical Drucker-Prager/Cap model, the revised Drucker-Prager/Cap model has a linear shear failure surface, providing dominantly shearing flow, and a transition region between the failure surface and the “cap”, providing a smooth surface purely for facilitating the numerical implementation[11].
The Drucker-Prager failure surface is written as
Fs=t-ptanβ-d=0
(2)
where p=-![]() trace(σ) is the equivalent pressure stress; β is the angle of the friction of the material; d is the cohesion; t is the deviatoric stress measure and it is
trace(σ) is the equivalent pressure stress; β is the angle of the friction of the material; d is the cohesion; t is the deviatoric stress measure and it is
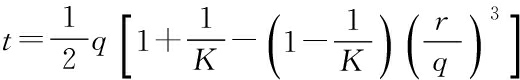
(3)
where q=![]() is the Mises equivalent stress; r=
is the Mises equivalent stress; r=![]() is the third stress invariant; S is the stress deviator and it is defined as S=σ+pI, where σ is the stress tensor and I is the identity matrix. K is a material parameter (ranging from 0.778 to 1.0) that controls the dependence of the yield surface on the value of the intermediate principal stress.
is the third stress invariant; S is the stress deviator and it is defined as S=σ+pI, where σ is the stress tensor and I is the identity matrix. K is a material parameter (ranging from 0.778 to 1.0) that controls the dependence of the yield surface on the value of the intermediate principal stress.
The cap yield surface is written as
Fc= ![]() -
-
R(d+patanβ)=0
(4)
where pa=![]() is the evolution parameter; R is a material parameter that controls the shape of the cap; and α is a small number (typically 0.01≤α≤0.05) used to define a transition yield surface.
is the evolution parameter; R is a material parameter that controls the shape of the cap; and α is a small number (typically 0.01≤α≤0.05) used to define a transition yield surface.
The transition face is defined as
Ft= ![]() -
-
α(d+patanβ)=0
(5)
Fig.4 is the schematic of the high pressure squeeze molding process. The size of the modeling chamber is 610 mm×508 mm×260 mm. There are four parts in the high pressure squeeze molding process: the squeeze plate, the flask, the pattern plate and the green sand. In order to simplify the calculations and fit the actual situations, the squeeze plate and the flask are treated as a rigid body.

Fig.4 Schematic of high pressure squeeze molding process
Based on the actual situation, the material of the pattern plate is cast iron, and its properties are listed in Tab.1.
Tab.1 The material properties of cast iron
Density/(kg·m-3)Youngsmodulus/PaPoissonratio78002.1×10110.3
The sand used in the experiment was mixed with water and bentonite, and the material properties are listed in Tab.2.
Tab.2 The material properties of green sand %
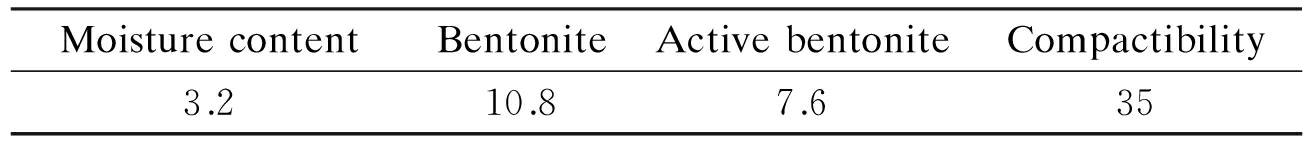
MoisturecontentBentoniteActivebentoniteCompactibility3.210.87.635
The model parameters of the revised Drucker-Prager/Cap model are listed in Tab.3. The yield stress reported by Li[12] is referenced to obtain the isotropic compression stress-strain curve.
σ1= (0.624-0.735ρ)+
![]()
(6)
where σ1 is the yield stress, MPa; ρ is the sand bulk density, g/cm3; and ε is the volumetric plastic strain.
Tab.3 Parameters of the revised Drucker-Prager/Cap model

d/kPaβRεαKYongsmodulus/PaPoissonratio2529°0.141×10-50.0113×1070.35
Other parameters are set to be the same as those in the experiment. The squeeze pressure is set to be 1.0 MPa while the initial mold height is 260 mm and after the squeezing process, it turns out to be 180 mm. According to Refs.[13-14], the friction coefficient between the green sand and the other three parts is set to be 0.5.
In order to match the results of the experiment, the simulation results are transferred into mold strength with the equation[12]:

(7)
where σ2 is the calculated equivalent stress, MPa; and M is the mold strength, N/cm2.
The experimental result of the sand bulk density distribution after the aeration sand filling process is shown in Fig.5.

Fig.5 Sand bulk density distribution after aeration sand filling process (experimental results)
Another case with the initial sand bulk density of 1 100 kg/m3 is also simulated for comparison, which is called the uniform modeling simulation. The simulation with the measured sand bulk density is called the partition modeling simulation. The experimental results, partition modeling simulation results and uniform modeling simulation results are shown in Fig.6 and Fig.7. The strength of the sand mold is defined by the Mises stress.


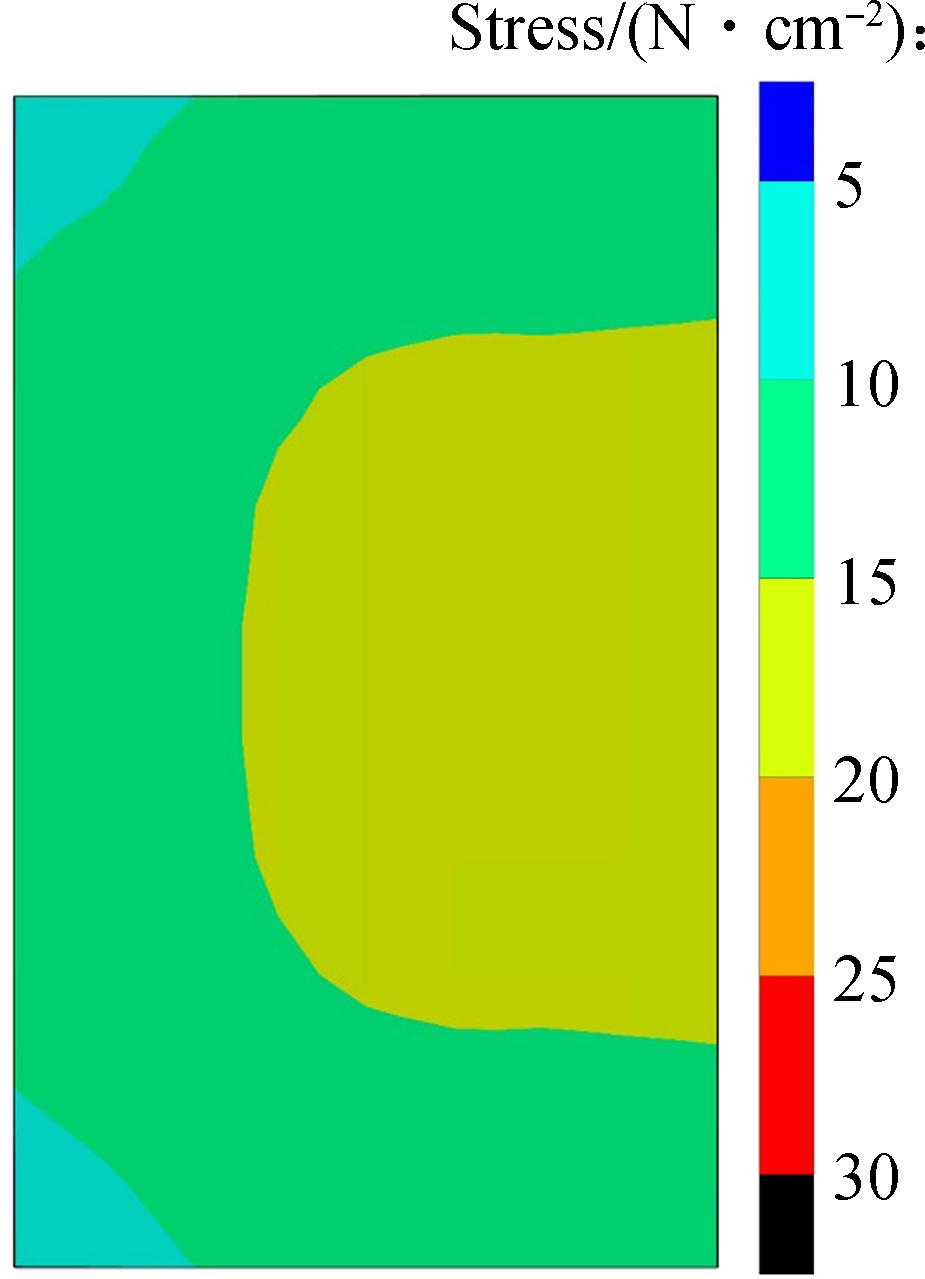
(a) (b) (c)
Fig.6 Comparison of the strength (Mises stress) on the parting surface. (a) Experimental results; (b) Partition modeling simulation results; (c) Uniform modeling simulation results
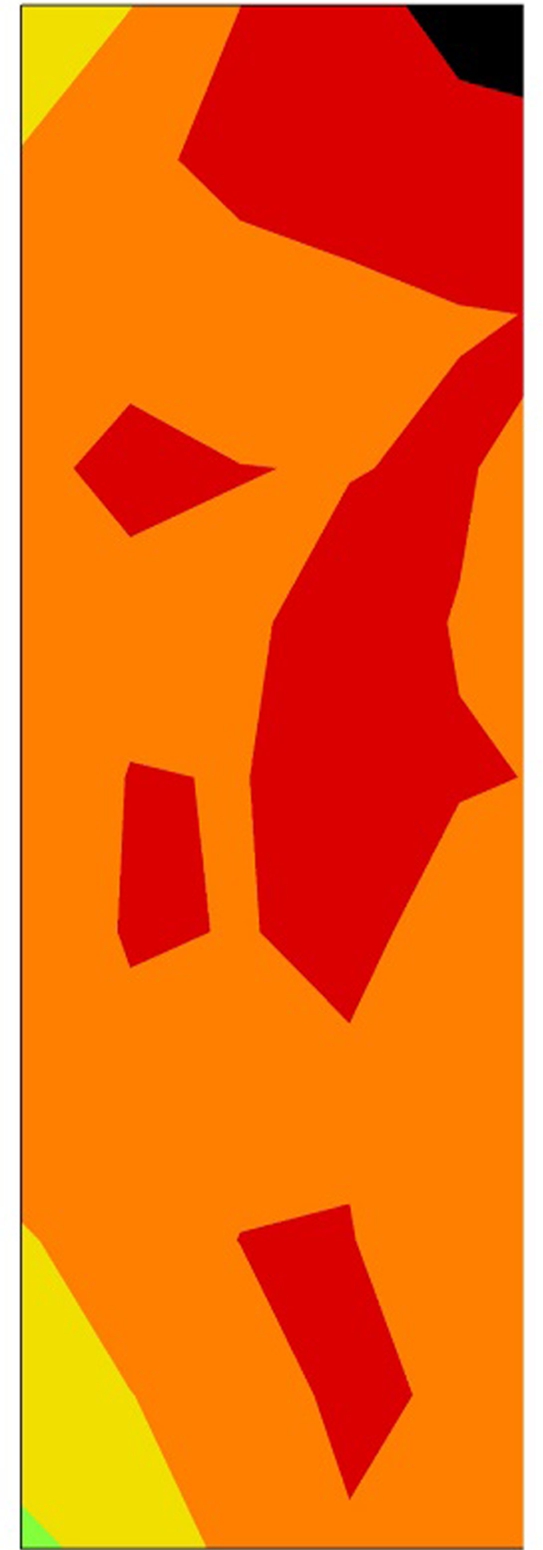

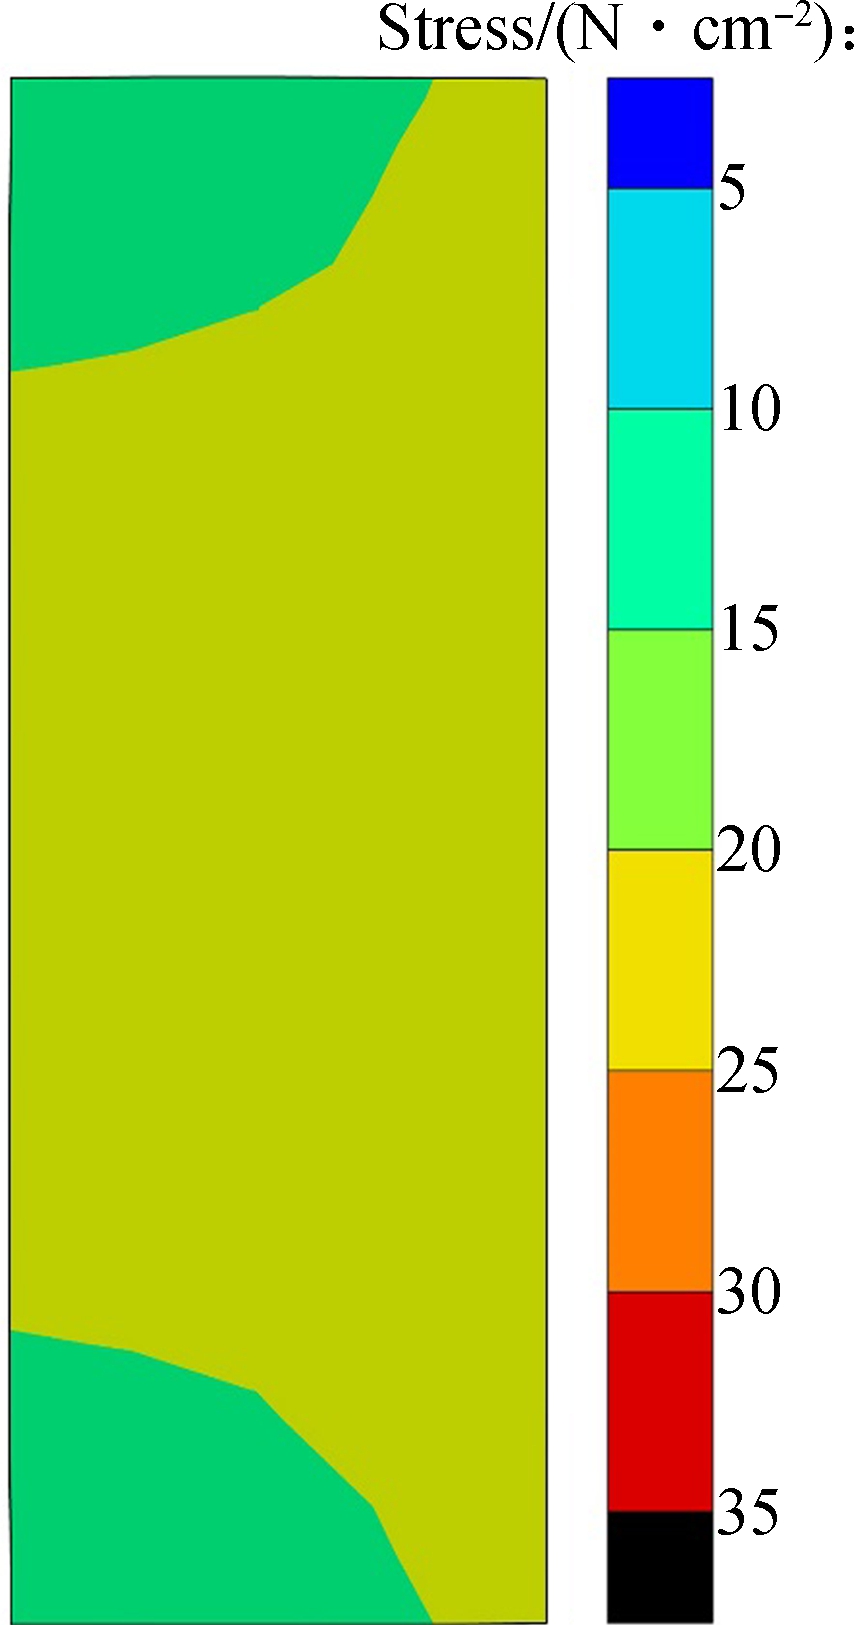
(a) (b) (c)
Fig.7 Comparison of the strength (Mises stress) on the cutting surface. (a) Experimental results; (b) Partition modeling simulation results; (c) Uniform modeling simulation results
In Fig.6 and Fig.7, both the partition modeling simulation results and the uniform modeling simulation results share a similar tendency with the experimental results. Due to the influence of the flask, the sides and the endpoints are the weakest parts.
Fig.6 and Fig.7 show that the mold strength of the partition modeling simulation and the uniform modeling simulation are lower than the experimental results, which may be connected to the shape of the pattern. Li et al.[7] used the Drucker-Prager/Cap model with a three-sleeve pattern and the uniform sand bulk density distribution, and the simulation results fit the experimental results better. So, the conclusion can be drawn that the revised Drucker-Prager/Cap model is suitable for solving the complex pattern and it can give some advice on casting production.
The parting surface is the most important step of the molding process. Since the partition modeling simulation is based on the actual sand bulk density, it should be more credible than the uniform modeling simulation. However, there are still some differences between Fig.6(a) and Fig.6(b). These differences may be caused by the sand bulk density distribution measured after the aeration sand filling process which is not sufficiently accurate. The tubes which were inserted into the holes may affect the sand bulk density distribution. In this way, Fig.6(c) shows that the mold strength distribution of the uniform modeling simulation is homogeneous, which also matches the experimental results well. As the aeration sand filling method can obtain an approximate uniform sand bulk density distribution, the uniform modeling simulation results also prove that this method can achieve a high quality sand mold.
Moreover, the designed experiment for the measurement of the sand bulk density distribution can only work in simple patterns and it is difficult to carry out. So, in future work, other effective and more accurate methods to measure the sand bulk density should be developed, and the simulation of the aeration sand filling process should be integrated into the simulation of high pressure squeeze compaction process.
1) ABAQUS incorporated with the revised Drucker-Prager/Cap model is an appropriate model for solving nonlinearity problems associated with the squeezing compaction process of molding sand. The simulation results can give some guidelines for production practice and provide useful information to improve the quality of casting.
2) The simulation results show that the uniform sand bulk density distribution can achieve a high quality sand mold, which is the advantage of the aeration sand filling-high pressure squeeze molding method.
3) Both the partition modeling simulation and the uniform modeling simulation results are lower than the experiment results of other researchers’ work. It can be concluded that the revised Drucker-Prager/Cap model is suitable for handling a situation with the complex pattern.
References
[1]Hirata M, Sugita K. New sand filling method in flaskless molding and its controls[J]. American Foundrymens Society Transactions, 2005, 113: 319-326.
[2]Ni C J, Zhang Q D, Jing T, et al. 3D numerical simulation of aeration sand filling-high pressure squeeze molding method[C]//The 71st World Foundry Congress. Bilbao, Spain, 2014.
[3]Hirata M, Takasu S, Makino H. Application of aeration sand filling, squeeze balance control and synchronised pattern drawing to flaskless moulding process[J]. International Journal of Cast Metals Research, 2008, 21(1/2/3/4): 246-250. DOI:10.1179/136404608x362034.
[4]Makino H, Maeda Y, Nomurat H. Force analysis in air-flow press moulding using the distinct element method[J]. International Journal of Cast Metals Research, 1997, 10(3): 171-175. DOI:10.1080/13640461.1997.11819232.
[5]Liu X, Xu X. Modelling of dense gas-particle flow in a circulating fluidized bed by distinct cluster method (DCM)[J]. Powder Technology, 2009, 195(3): 235-244. DOI:10.1016/j.powtec.2009.06.007.
[6]Li H, Wu J J, Huang T Y, et al. 3D numerical simulation for aeration sand filling process[C]//The 69th World Foundry Congress. Hangzhou, China, 2010.
[7]Li H, Wu J J, Huang T Y, et al. A new numerical simulation model for high pressure squeezing moulding[J]. China Foundry, 2011, 8(1): 25-29.
[8]Mizuno E, Chen W. Cap models for clay strata to footing loads[J]. Computers & Structures, 1983, 17(4): 511-528. DOI:10.1016/0045-7949(83)90046-9.
[9]Shoop S, Affleck R. Cap plasticity model for thawing soil[C]//Geo-Frontiers Congress 2005. Austin, TX, USA, 2005: 1-11. DOI:10.1061/40786(165)8.
[10]Abaqus A. 6.13 Analysis user’s manual[M]. Providence, IR,USA: Simulia Corp, 2013.
[11]Han L H, Elliott J A, Bentham A C, et al. A modified Drucker-Prager Cap model for die compaction simulation of pharmaceutical powders[J]. International Journal of Solids and Structures, 2008, 45(10): 3088-3106. DOI:10.1016/j.ijsolstr.2008.01.024.
[12]Li H. The experiment study and numerical simulation on low pressure shoot-high pressure squeeze moulding[D]. Beijing: Department of Mechanical Engineering, Tsinghua University, 2005. (in Chinese)
[13]Xie B. A study on the green sand stress field in squeeze moulding and air impact moulding [D]. Beijing: Department of Mechanical Engineering, Tsinghua University, 1993. (in Chinese)
[14]Yang G. Tests and numerical analysis on loose moulding sand compaction process under squeeze and air impact conditions [D]. Beijing: Department of Civil Engineering, Tsinghua University, 1995. (in Chinese)
摘要:为了研究低压射砂-高压压实造型后的砂型强度,引入三维数值模拟方法.应用商业化有限元软件ABAQUS并结合修正的Drucker-Prager/Cap模型对高压压实过程进行了模拟.同时,基于特殊设计的实验,将砂箱分成5×9的区域后分别测量了射砂后造型室内型砂的堆积密度,并将其作为压实模拟过程的输入参数.在模拟过程中,分别使用均一密度和分区建模2种方法,并将三维数值模拟结果和相关联标定实验做了对比.三维数值模拟结果表明:均匀的型砂密度可得到高质量的砂型,而修正的Drucker-Prager/Cap模型更适合处理采用复杂模具的情况.三维数值模拟结果能够较好地预测砂型强度分布,同时对实际生产有一定的指导作用.
关键词:湿黏土砂;低压射砂-高压压实造型;修正的Drucker-Prager/Cap模型; 数值模拟
中图分类号:TG221
DOI:10.3969/j.issn.1003-7985.2017.04.013
Received 2017-04-14,
Revised 2017-07-22.
Biographies:Zhang Qingdong (1990—), male, graduate; Jing Tao(corresponding author), male, doctor, professor, jingtao@tsinghua.edu.cn.
Foundation items:The National Natural Science Foundation of China (No.51575304), the National Science and Technology Major Project of the Ministry of Science and Technology of China (No.2012ZX04012011).
Citation:Zhang Qingdong, Ni Changjiang, Jing Tao, et al. 3D numerical simulation of high pressure squeezing process with revised Drucker-Prager/Cap model[J].Journal of Southeast University (English Edition),2017,33(4):473-477.
DOI:10.3969/j.issn.1003-7985.2017.04.013.