Survivability refers to the capability of a system to fulfill its critical services in a timely manner when the system is subjected to external attacks, such as viruses or internal failures[1].Cloud computing is a new type of distributed network service computing model[2].A cloud computing system can provide a variety of trusted critical services for users.Therefore, it is extremely important to ensure that the critical services in the cloud computing system one executed continuously when the system is subjected to external attacks or internal failures.Recently, domestic and overseas scholars have conducted large-scale research on survivability, and the main research areas include the formal modeling, survivability enhancement technology, survivability analysis, test and evaluation, etc.
Chang et al.[3]proposed a solution for the virtual system survivability model, in which the continuous time Markov chain is used to analyze the service survivability after its failure.Using the proposed solution, the viability of the system can be quantitatively assessed.Jin et al.[4] considered the survivability of each node, the deletion of links and nodes determined by the survivability of the nodes, a survivable topology evolution model based on the wireless sensor network was proposed.Through this model, the survivability of the node can be analyzed.Zhou et al.[5] proposed a method to predict survivability according to a large amount of log audit data of the system, and used a quantitative method to analyze the survival ability of the system over a certain period of time.Alobaidi et al.[6] also proposed a quantitative analysis method based on the smart grid, which described the changes of the system state and the decline conditions in its service performance, in order to maintain the highest system survivability during the recovery process.
The above studies analyzed the survivability of the system or critical service by models which can quantitatively analyze the survivability, and then clearly depict the changing process of the survivability.However, their studies did not consider the dynamic impact conditions of the system survivability, such as external attacks or internal failures in the actual system operation.
In summary, based on the features of the biological immune system[7-8], on the basis of the SAIR model[9], the SEIRS model[10] and the vulnerability propagation model of distributed virtualization[11], the survivability evolution model of critical cloud services in the cloud computing system is obtained.
1 Bio-PEPA Syntax
Bio-PEPA (biological-performance evaluation process algebra)combines some features of biological network and is well suited to describing the spread of the virus within a cloud computing system and the survivability evolution of critical cloud services.The basic semantic expressions are as follows[12-13]:
S::=(α,γ)op S|S+S|Constant|S@L
(1)
op::=↓|↑|⊙
(2)
(3)
The meanings of the basic expressions are shown in Tab.1.
Tab.1 The meanings of Bio-PEPA basic expressions
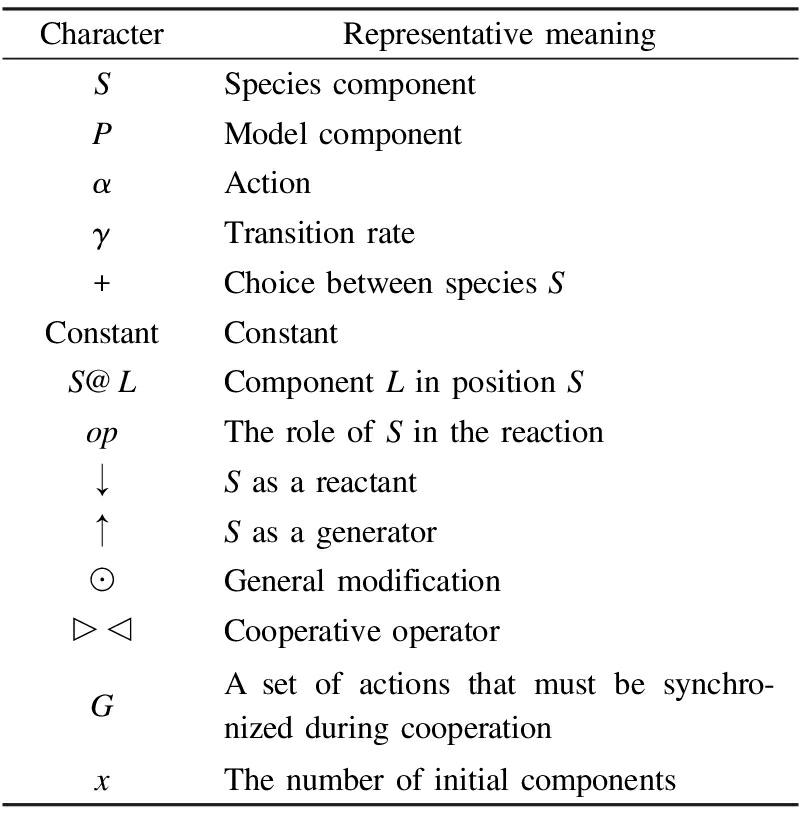
CharacterRepresentativemeaningSSpeciescomponentPModelcomponentαActionγTransitionrate+ChoicebetweenspeciesSConstantConstantS@LComponentLinpositionSopTheroleofSinthereaction↓Sasareactant↑Sasagenerator☉Generalmodification▷◁CooperativeoperatorGAsetofactionsthatmustbesynchro⁃nizedduringcooperationxThenumberofinitialcomponents
Approximate steady-state probability is the ratio of the number of units to that of components, after the model reaches a certain stable state.Hypothesis X={x1, x2,…, xn},xi is the number of components in the system, Ntotal is the number of components.For any positive integer i(0<i<n), the approximate steady-state probability of type i component is
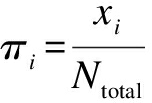
(4)
Kinetic law vector VKL is composed of the universal set of reaction rate fk, and
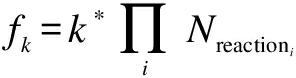
(5)
where Nreactioni represents the number of reactants.As previously mentioned, X is the number of components and it satisfies the ordinary differential equation:
![]() |X=X0=EVKL
|X=X0=EVKL
(6)
Due to the length of the paper, we will not elaborate more than is needed.Refs.[12-13] introduced the solution and derivation process of Bio-PEPA in detail.Ref.[14]introduced Bio-PEPA Eclipse plug-in syntax and modeling terminology.
2 Evolution Model of Survivability Situation
The survivability of critical cloud services in the cloud computing system is inevitably affected by the propagation of the virus.We first classify the survivability of key cloud services, and then study the impact of virus propagation in intra-domain or inter-domain.Finally, we obtain the evolution model of survivability.
2.1 Classification of survivability situation
Referring to the model of SAIR and SEIRS virus propagation, and the diffusion model in the distributed virtual system of vulnerability, the survivability of key cloud services is abstracted into 6 states: The susceptible state S, the latent state Le, the latent state Lc, the infection state I, the recovery state R and the immune state A.By default, the latent virus is not activated or executed, so it is not infectious and can be obviously distinguished from the virus in the infected state.The specific states are as follows:
1)S represents that the nodes are not infected with the virus, but they have the possibility of infection.
2)Le represents that the nodes contain the latent virus and have been detected.
3)Lc represents that the nodes contain the latent virus but have not been found.
4)I represents that the nodes are infected with the virus and the virus has performed its part or all of predefined functions.
5)R represents that the nodes are infected, but the virus has been cleared.The nodes may be transformed into S or A.
6)A represents that the nodes are infected and the virus has been cleared, but the nodes have immune function to the virus or similar virus.
The state set of all nodes is W={S, Le, Lc, I, R, A}, and the virus in the latent state and the active state forms the state set of virus as Lset={Le, Lc, I}.In order to further facilitate the description, we define the nodes in the state Z∈W as component Z.
2.2 Intra-domain propagation rules
Compared with inter-domains, viruses are more likely to be propagated in intra-domains, and therefore, we first consider the simplest case, which is the impact of viruses propagation in intra-domains.Intra-domain propagation rules of virus are as follows:
〈Propagation1〉:
1)〈link1〉S+I→2I:The component I spreads the virus to component S through the connection, and the virus is active.
2)〈link2〉S+I→Le+I: The component I spreads the virus to the component S though the connection.Now the virus is in the latent state and has been found.
3)〈link3〉S+I→Lc+I: The component I spreads the virus to the component S though the connection.Now the virus is in the latent state and has not been found.
4)〈activation1〉Le→I: The latent virus in the component Le is activated.
5)〈activation2〉Lc→I: The latent virus in the component Lc is activated.
6)〈recovery1〉Le→R: The latent virus in the component Le is cleared.
7)〈recovery2〉I→R: The latent virus in the component I is cleared.
8)〈memory〉R→A: Component R is transformed into component A by the memory function after virus clearance.
9)〈insecure1〉A→S: Component A is transformed into component S.
10)〈insecure2〉A→Le: Component A is transformed into component Le.
The virus propagation set is Propagation1={link1, link2, link3,activation1,activation2,recovery1,recovery2,memory, insecure1, insecure2}.The rate of change for each reaction (propagation rule)is recorded as rα, where α∈Propagation1.Assuming that the number and type of components are fixed within a certain period of time, recording the total number of components as N, the number of components S, Le, Lc, I, R, A as ns, ne, nc, ni, nr, na.The reaction rate fk of each reaction satisfies
flink1=rlink1nsni, flink2=rlink2nsne, flink3=rlink3nsnc
factivation1=ractivation1neni, factivation2=ractivation2ncni
frecovery1=rrecovery1nenr, frecovery2=rrecovery2ninr
fmemory=rmemorynanr, finsecure1=rinsecure1nsna
finsecure2=rinsecure2nena
2.3 Inter-domain propagation rules
Assuming that the system is divided into n service domains, let the domain set be K={location1, location2, …, locationn}, |K|=n, locationi, locationj∈K, locationi≠ locationj, which represent different service domains.The inter-domain propagation rules of virus are as follows:
〈Propagation2〉:
11)〈link1ij〉S@locationi+I@locationj→I@locationi+I@locationj: The component I in service domain locationj propagates the virus to the component S in service domain locationi by connecting and the virus is activated.
12)〈link2ij〉S@locationi+I@locationj→Le@locationi+I@locationj: The component I in service domain locationj propagates the virus to the component S in service domain locationi by connecting, and then the virus is inactivated, and it can be recognized by the system.
13)〈link3ij〉S@locationi+I@locationj→ Lc@locationi+I@locationj: The component I in service domain locationj propagates the virus to the component S in service domain locationi by connecting, and then the virus is inactivated, but it cannot be recognized by the system.
The rate of virus transition between locationi and locationj is rlink1-ij, rlink2-ijand rlink3-ij.The number of components S in locationi is nS@location-i.The number of components I in locationj is nI@location-j.The reaction rate of fk fulfils the following rules:
flink1-ij=rlink1-ijnS@location-inI@location-j
flink2-ij=rlink2-ijnS@location-inI@location-j
flink3-ij=rlink3-ijnS@location-inI@location-j
Especially, if there is no virus propagation relationship between two service domains, rlink1-ij=rlink2-ij=rlink3-ij=0.
2.4 Formal description of Bio-PEPA model
The impact of virus propagation on the survivability of critical cloud services can be represented by the state transition of cloud service nodes.The SLIRAS model is shown in Fig.1.
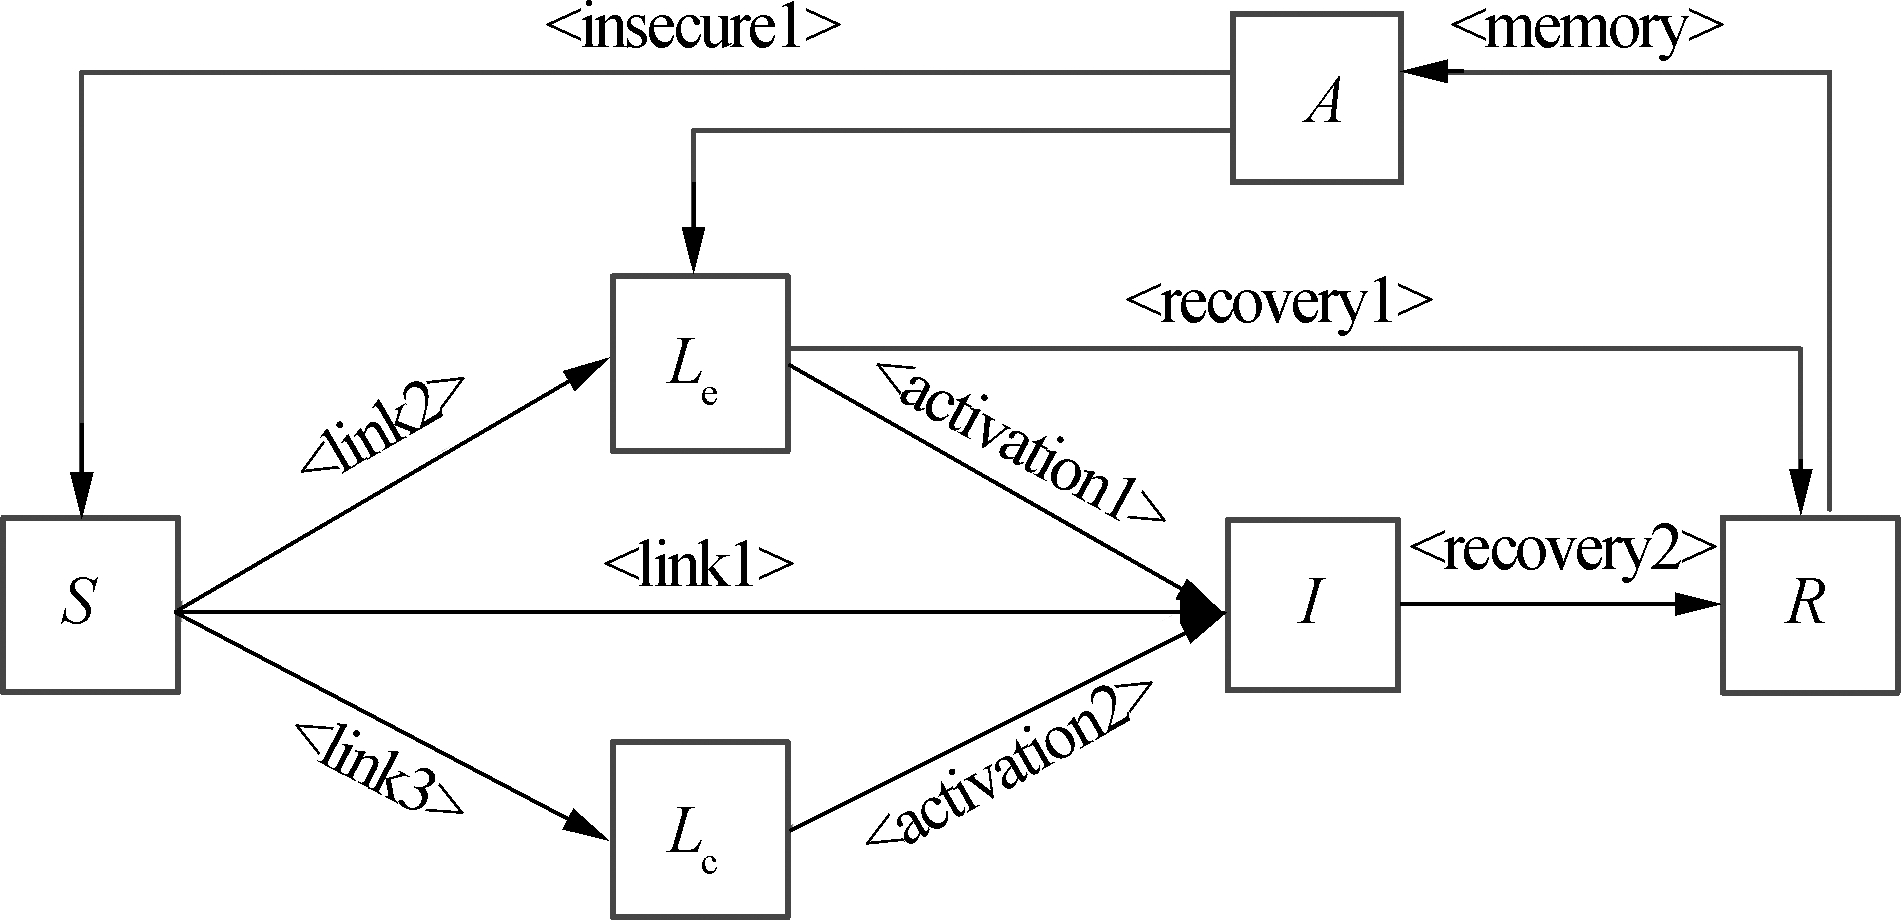
Fig.1 SLIRAS model
Based on the SLIRAS model, the survivability evolution process of critical cloud service can be formally described by Bio-PEPA as follows:

S@locationi+(link3i,1)↓S@locationi+(insecure1i,1)↑
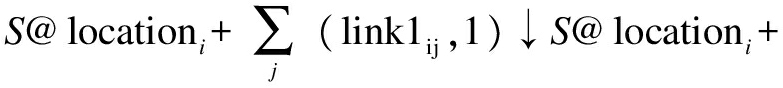


(link2i,(1,1))⊙I@locationi+(link3i,(1,1))
⊙I@locationi+(activation1i,1)↑I@locationi
+(activation2i,1)↑I@locationi+(recovery2i,1)↓
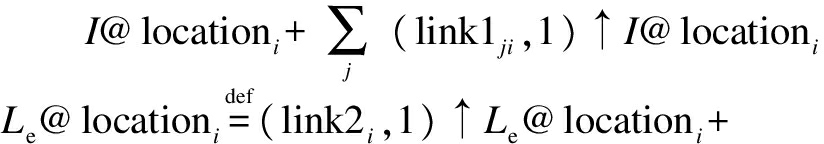
(activation1i,1)↓
Le@locationi+(recovery1i,1)↓Le@locationi+
(insecure2i,1)↑
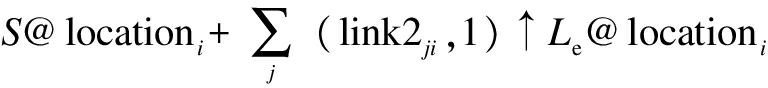

(activation2i,1)↓
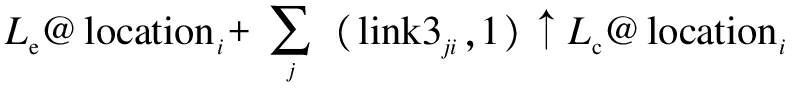

R@location+(memoryi,1)↓R@locationi

(insecure1i,1)↓A@locationi+(insecure2i,1)↓A@locationi
If there is no virus propagation between two service domains in the model, the corresponding transition rate is zero.Based on this model, we can analyze the impact of virus diffusion on the survivability of critical cloud services.
3 Simulation Analysis
Since the model contains many parameters, these parameters have a certain influence on the stability and rationality of the model.Therefore, the section will select some quantitative indicators, and briefly analyze the influence of virus propagation in intra-domains and inter-domains on the viability of critical cloud services, then compare them with the simulation test results.
3.1 Survivability assessment index
The section refers to the existing research results in the field of survivability situation assessment[15-16].Two indicators are proposed to assess the survivability situation of key cloud services: peak service quality index Pv and steady-state service quality index πv.Let p∈W represent the type of component, location represents the service domain.
Definition 1(peak service quality index Pv) The index is the maximum ratio of the number of components in the Lset collection to the number of all components in the service domain, at the time 0<t<+∞,
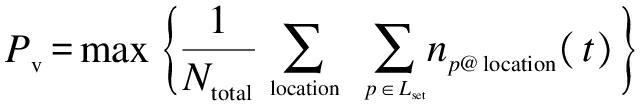
(7)
where np@location is the number of components P in the service domain location; Ntotal is the number of all components in the domain.
Definition 2(steady-state service quality index πv) The index is the sum of approximate steady state probabilities of various types of components in Lset collection when the number of viruses in the service domain reaches a certain amount, in other words, it will no longer increase or decrease, and achieve a certain steady state:
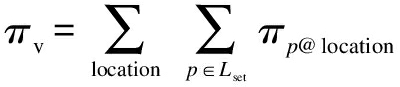
(8)
where πp@location is the approximate steady-state probability of component P.
Pv mainly measures the maximum range of virus spread in the system, while πv characterizes the long-term potential impact of viruses on the system survivability[17].Next, we will analyze the impact on the survivability of key cloud services on the basis of the above two indices from the scope and trend of virus propagation.
3.2 Example selection
In a cloud computing system, survivability may be changed by virus propagation in a service domain or any two service domains.In order to highlight the core of the problem, reduce the complexity caused by the interference of other uncertainties and the differences between different service domains, we only select one of the simplest examples, as shown in Fig.2.
Fig.2 A simple example of survivability evolution
Let locationA and locationB represent service domains that contain several critical cloud services, respectively.The initial state of locationA contains all kinds of components, and all components in locationB are susceptible to infection at the initial time.Virus diffusion may be present in the internal components of locationA; meanwhile, locationA propagates the virus to locationB through the connection.The example also includes survivability situation change caused by virus propagation in intra-domains or inter-domains.
Assuming that there are N nodes, the probability that a node which has been infected by the virus propagates the virus to another node is 1/N, that is rlink1=1/N.At the same time, due to the existence of latent viruses in node Le and Lc, the probability of the two nodes being infected by the virus will be very high, that is rlink2=rlink3=10×1/N.The virus propagation probability of inter-domains may be smaller than that in intra-domains.We assume that the virus propagation rate of inter-domains is 1/10 that of intra-domains.In order to reduce the contrast between different service domains, highlight the difference between intra-domain diffusion and inter-domain diffusion, assume that the rate of virus propagation in locationA and locationB are the same.The parameters are shown in Tab.2.
Tab.2 The values of each parameter in the model
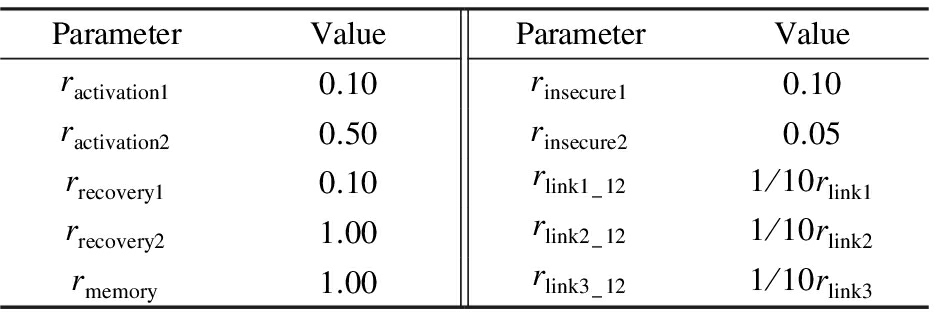
ParameterValueParameterValueractivation10.10rinsecure10.10ractivation20.50rinsecure20.05rrecovery10.10rlink1-121/10rlink1rrecovery21.00rlink2-121/10rlink2rmemory1.00rlink3-121/10rlink3
This paper uses the Bio-PEPA Workbench and the Bio-PEPA Eclipse plug-in to solve the model.The test environment is Windows 7, 64 bit processor, dual-core CPU, 2.4 GHz and 8 GB RAM.
It needs to be explained here that because our model adopts a formal description method, it is suitable for any given system or instance, so that the selection of instances is not the only one.
3.3 Simulation experiments
In order to test whether the proposed model is reasonable, we used the stochastic algorithm to simulate the real system and compare it with the ODEs simulation.Assuming that the number of all components in the two service domains is 200, and the initial values of Ns, Ne, Nc, Ni, Nr, Na are, respectively, (50, 10, 10, 10, 10, 10)and (100, 0, 0, 0, 0, 0).The Gillespie random algorithm[18] was used to select 10 000 groups of random data, and the error is set to be 1×10⁻⁵.The final comparison maps are shown in Fig.3 and Fig.4.
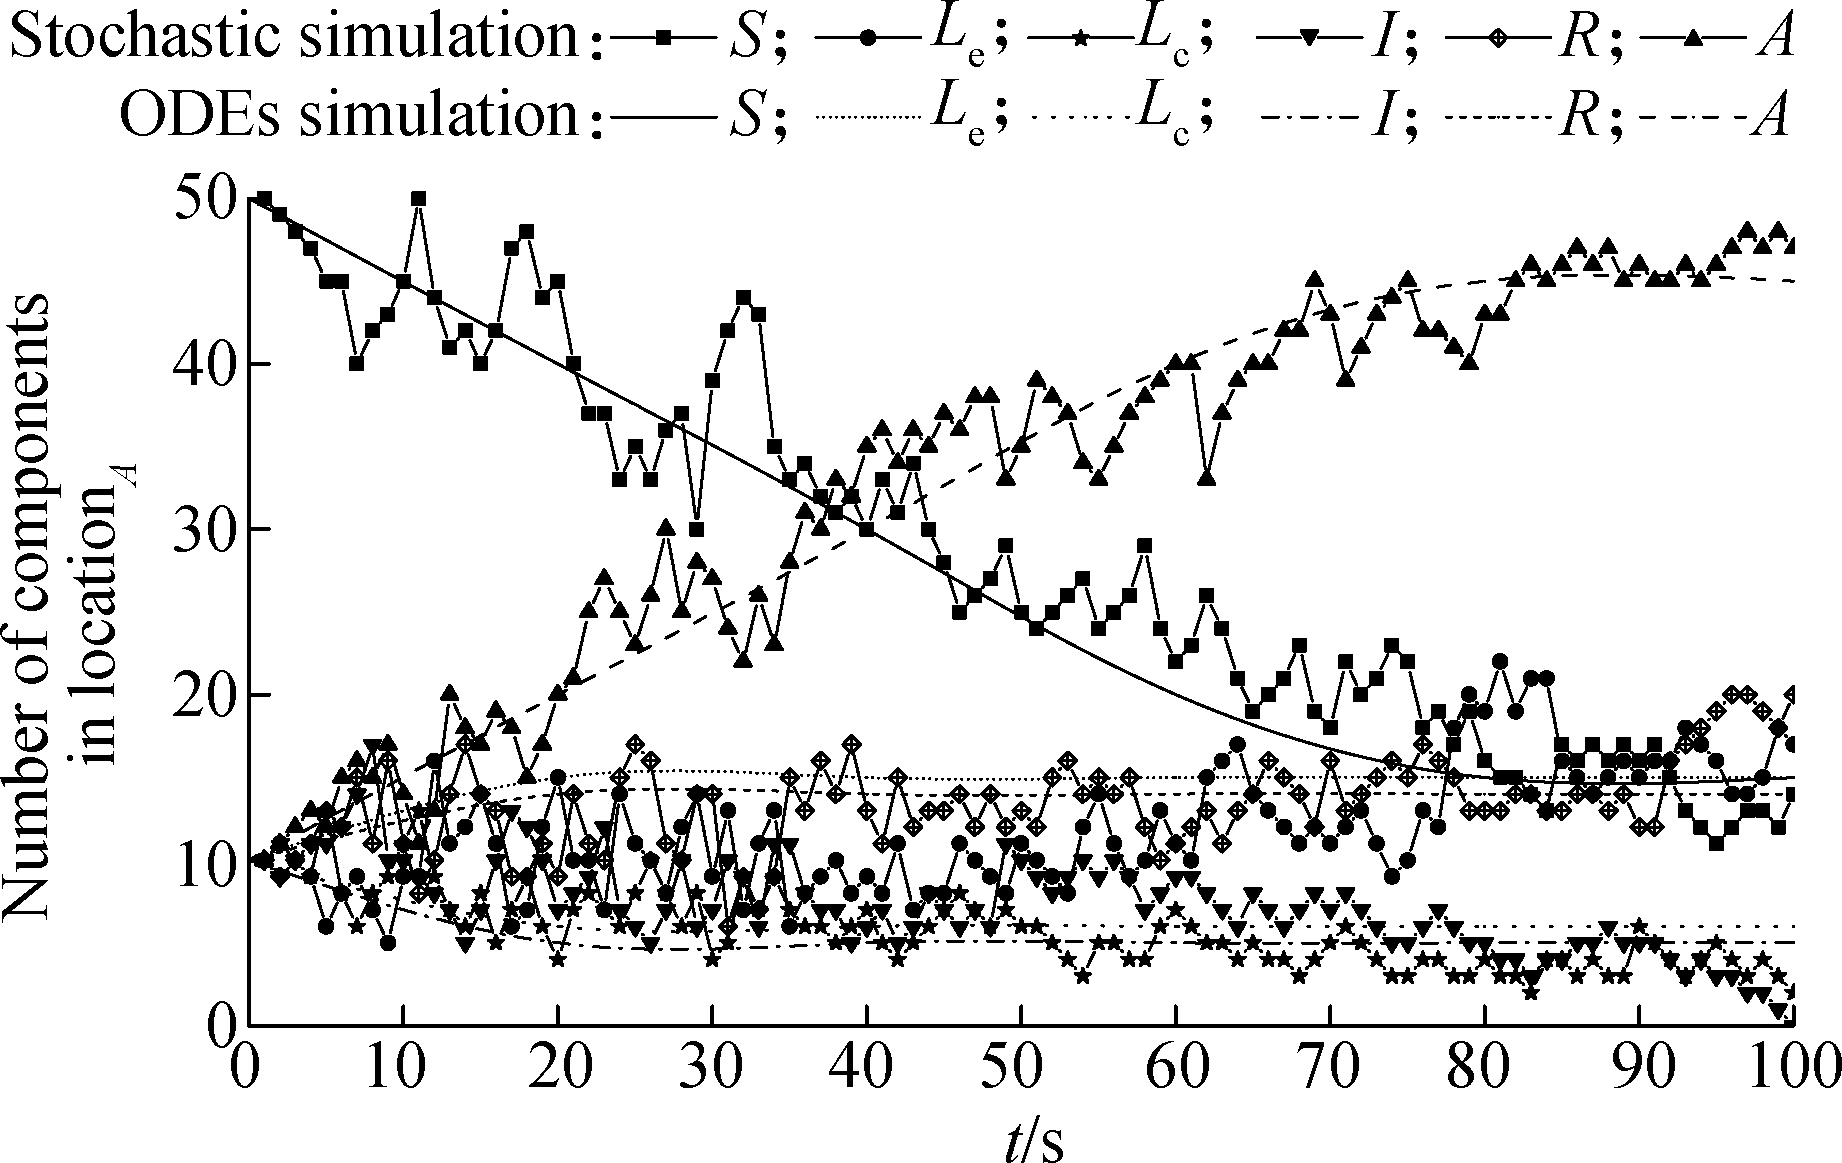
Fig.3 The comparison of stochastic simulation and ODEs simulation in locationA
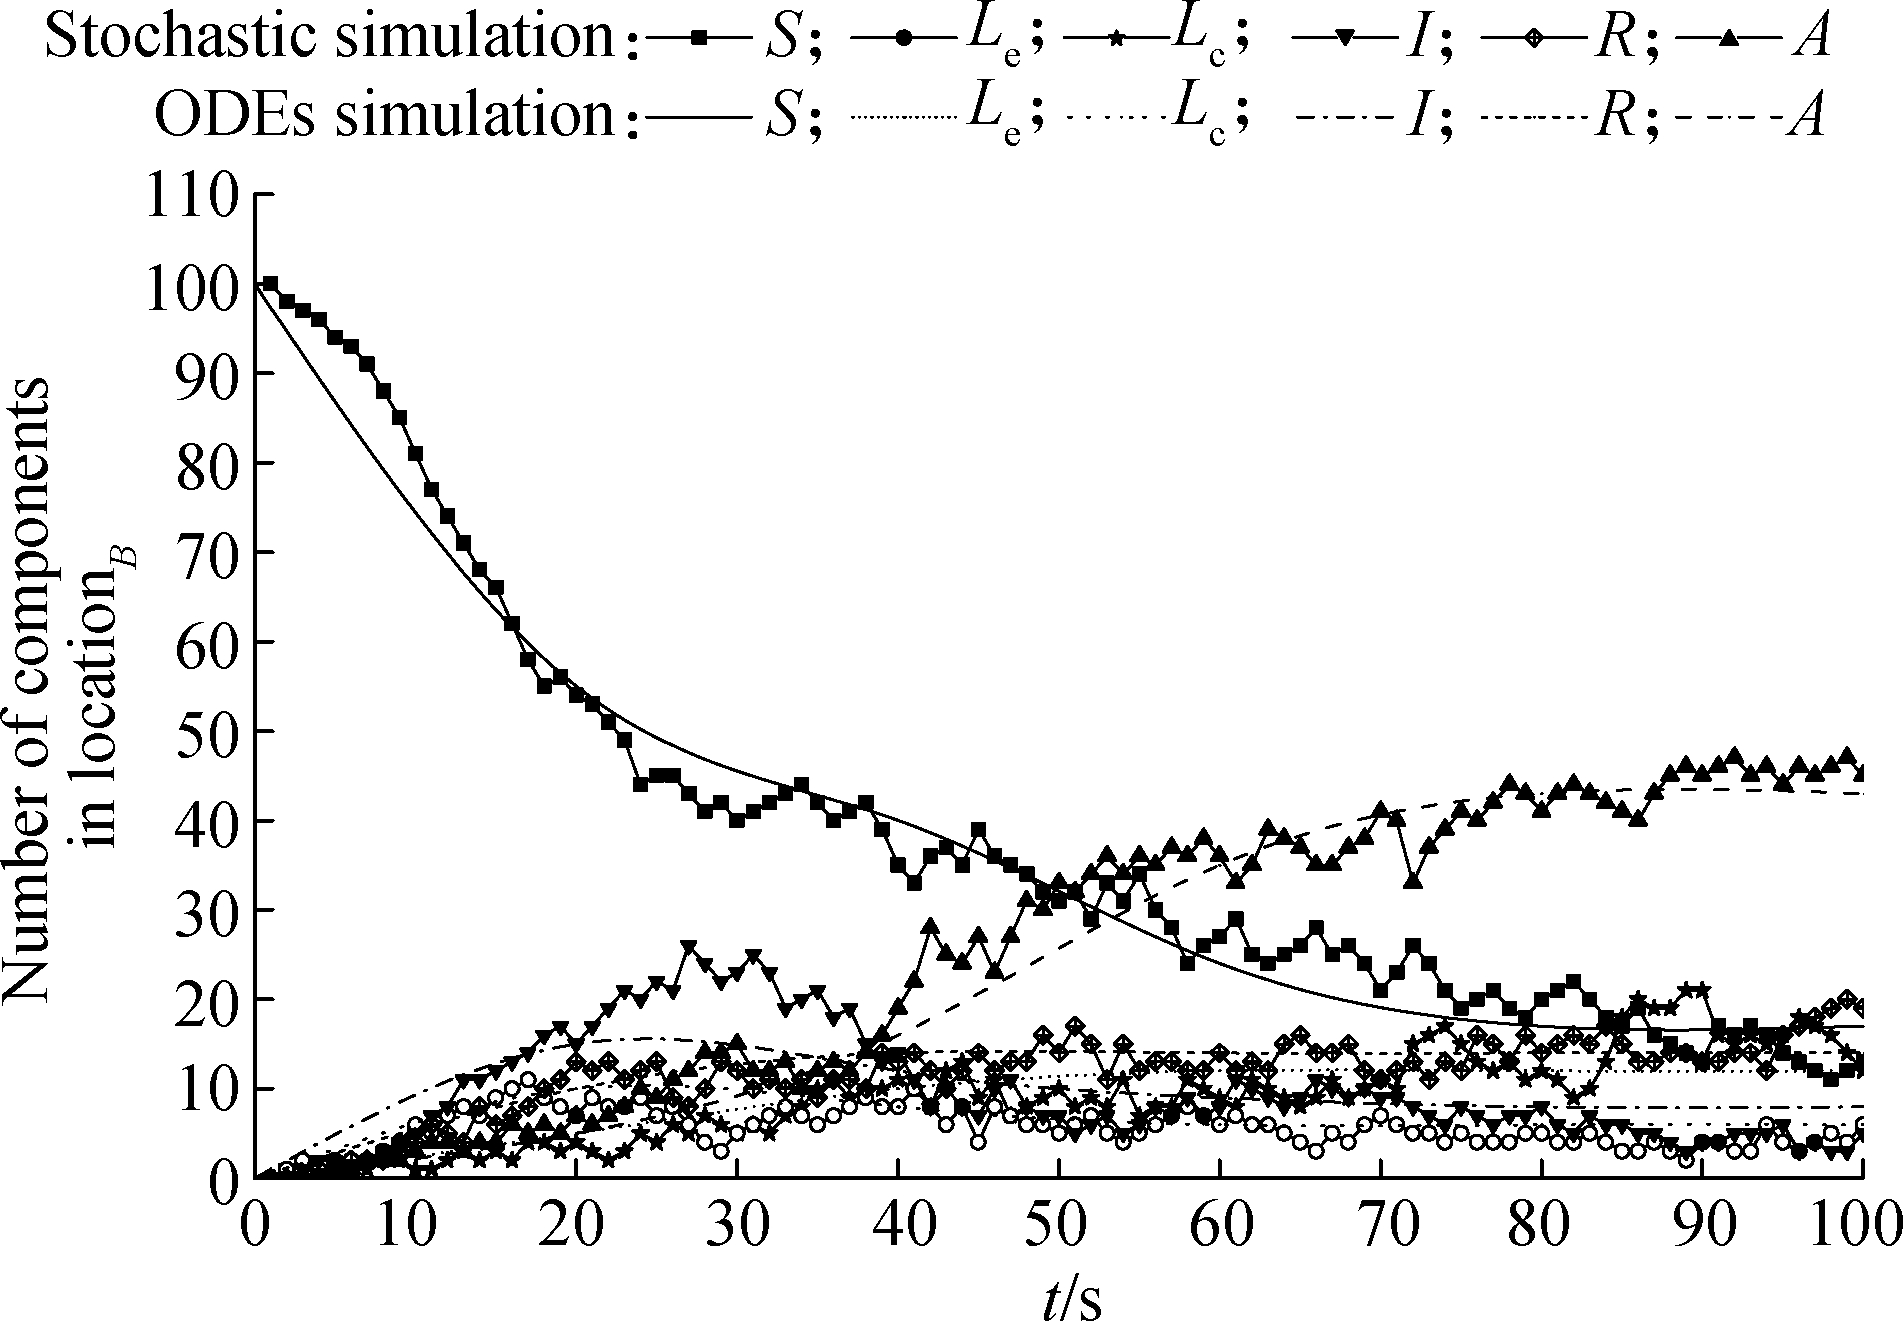
Fig.4 The comparison of stochastic simulation and ODEs simulation in locationB
As shown in Fig.3, at the beginning, there are some infection state nodes in locationA, and many nodes are susceptible to being infected.Virus propagation in intra-domains will first occur, and therefore, the number of components in Lset generally rises and fluctuates greatly.Later, due to the increase of memory state nodes and incomplete matching, latent state nodes Le also increase relatively.However, they are much faster to repair than susceptible state nodes.Finally, the recovery state nodes and the latent state nodes Le fluctuate within a certain range, when infection state nodes decrease and approach 0; other components gradually show a steady trend.
In Fig.4, the initial state of locationB is susceptible to being infected and there are no infection state nodes.After being affected by the virus propagation in locationA, the susceptible state nodes in locationB will rapidly decrease and will be transformed into latent state nodes Lcand infected state nodes.In the process of repairing infected state nodes, memory state nodes will increase slowly.Meanwhile, the number of components in Lset rises and gradually decreases after reaching their peak value.Finally, all components will achieve a relatively stable state.
The comparisons of the two graphs show that the initial conditions of the two service domains are different, and the evolution process of the survivability state and the final results are also different.In locationA, Pv=0.37, πv=0.22; in locationB , Pv=0.39, πv=0.24.As a result, compared with locationA, locationB shows that the range of viruses propagation is wider and the impact time on service domains is longer.
3.4 Model analysis
3.4.1 The effect of inter-domain virus propagation
One of the main factors that affect survivability is the virus propagation within service domains.In this paper, the virus transmission rate of inter-domains is mainly controlled by rlink1-12, rlink2-12 and rlink3-12.Among them, rlinki-12 contains rlink1-12, rlink2-12 and rlink3-12.In order to analyze the influence of virus propagation on survivability, we use Pv and πv as two indices, and consider the scope and trend of the virus propagation under a survivability situation for the whole cloud computing system.
Fig.5 shows the changes in the number of components Lset in locationB , when the connection rate rlink1-12,rlink2-12 and rlink3-12 are expanded 5 times, 10 times and reduced 5 times, 10 times, respectively.As we can see from the figure, with the increase of rlinki-12, the number of components in Lset grows gradually, and the peak time is shortened and the peak value becomes larger.When rlinki-12 is reduced, the number of components in Lset decreases gradually, and the peak time increases, but the peak value decreases relatively.
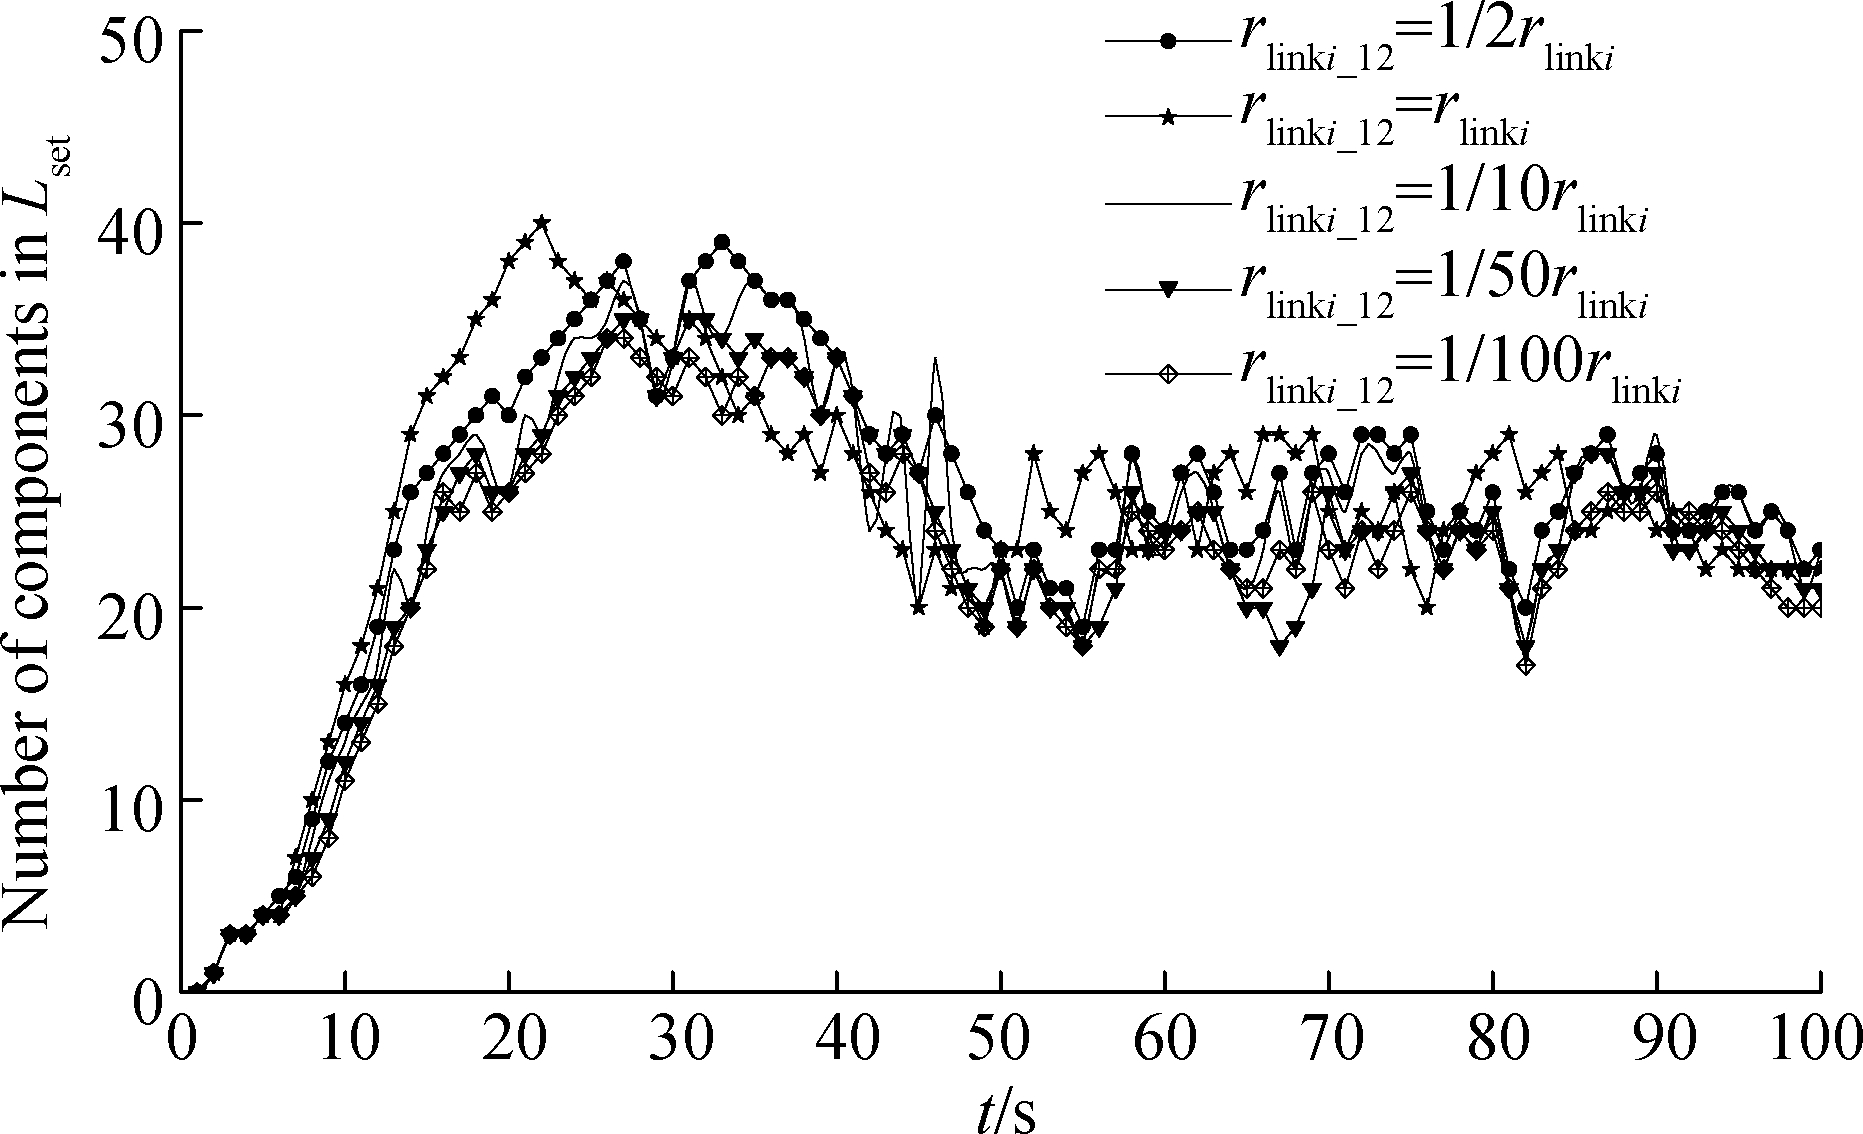
Fig.5 The number of components in Lset
According to the data in Fig.5, using Eqs.(7)and (8), we obtain the values of Pv and πv when rlinki-12 undergoes different changes, respectively, as shown in Fig.6.
As can be seen from Fig.6, with the increase of rlinki-12, the corresponding values of Pv are 0.40, 0.41, 0.39, 0.38, and 0.37, respectively.It means that the effect of the virus spreads with the increase of the inter-domain propagation rate.In the same way, the corresponding values of πv are 0.25, 0.26, 0.24, 0.23, 0.22, respectively, which implies that the virus has a longer period impact on the system.This phenomenon is mainly due to the increased probability of virus propagation and the shorter propagation time.However, the overall recovery ability of the system remains unchanged, and the number of infected status nodes is increased, that is, it causes a longer recovery time of the system.

Fig.6 The effect of inter-domain propagation rate
3.4.2 The effect of recovery ability
In the model, the recovery ability can make the critical services of the infected state nodes return back to normal, and it can reduce the proportion of infected nodes effectively, which is of great benefit to enhancing the survivability of the system.Next, we take Pv and πv to analyze the influence of the recovery ability on survivability through the change between rrecovery1and rrecovery2in [0.1, 1.0].
As we can see from Fig.7 and Fig.8, with the increase of rrecovery2, Pv and πv show a decreasing trend, but the effect of rrecovery1 on Pv and πv is not as obvious as rrecovery2.With the increase of rrecovery1, the values of Pv and πv fluctuate within a certain range.Although there is a gradual decline in the trend, the magnitude is much smaller.This is mainly because components S and Lc will eventually be transformed into component I, and component Le may also be converted to component I.Compared with the transformation of component Le into component R, the probability of component I to be transformed into component R is much greater.Therefore, by enhancing the repair ability, component I can suppress the virus propagation more effectively.

Fig.7 The effect of rrecovery1
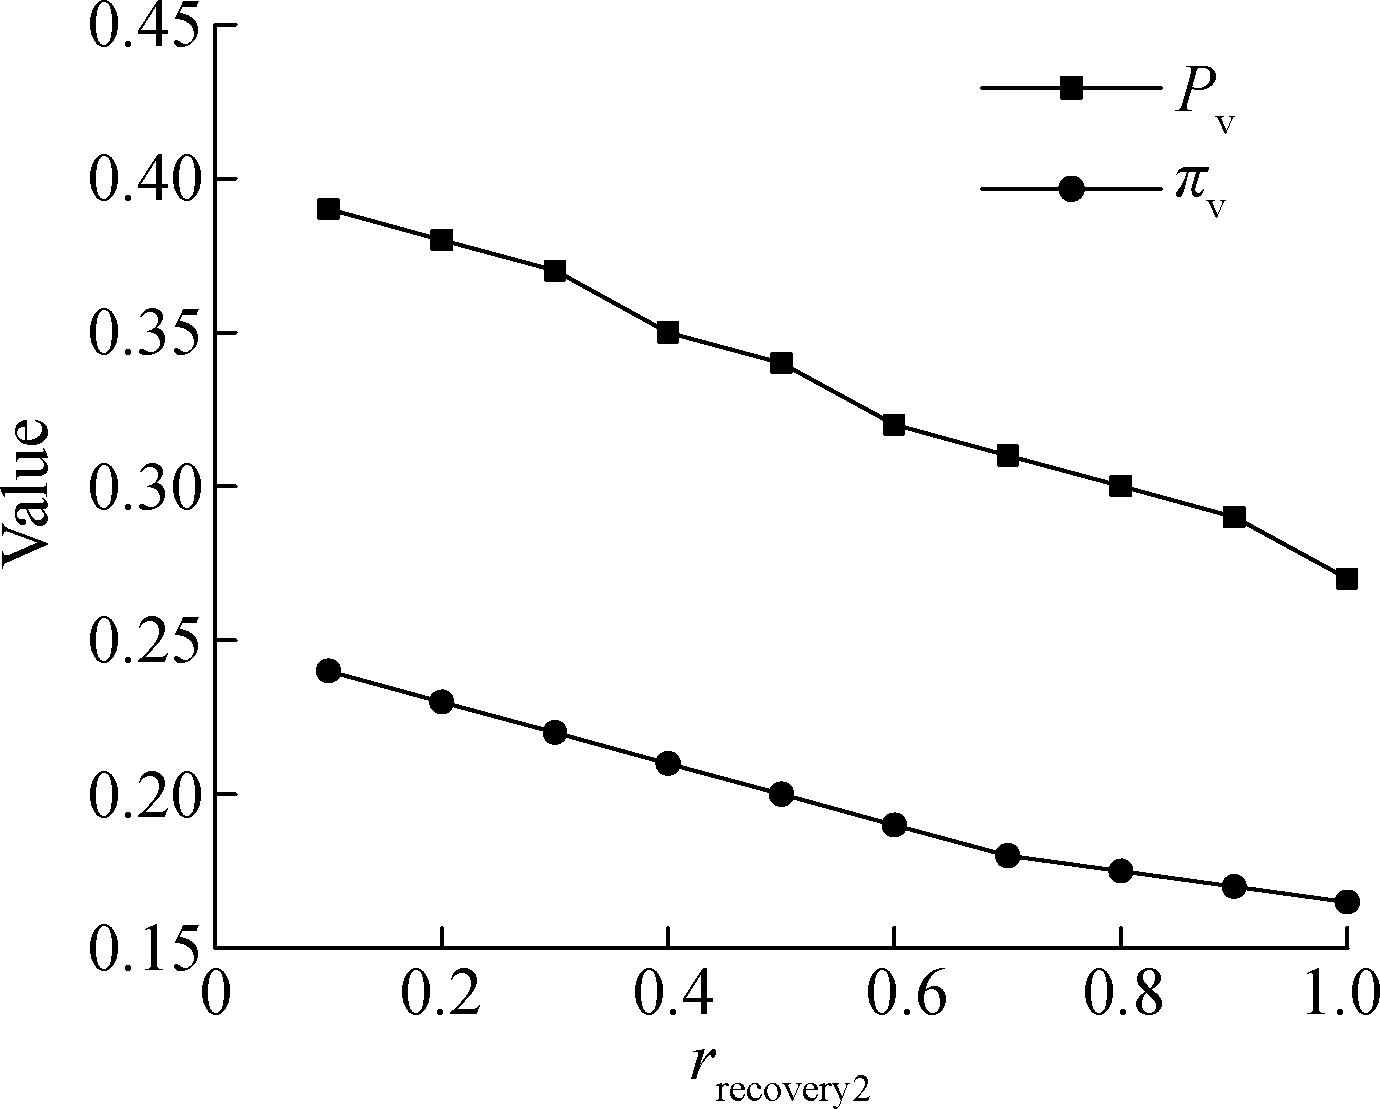
Fig.8 The effect of rrecovery2
3.4.3 The effect of memory ability
Memory ability is a very important part of the proposed model.Due to the immune memory function and incomplete matching, the component of the recovery state can be transformed into the component of the immune state, and the possibility of reinfection is reduced.Even if infected again, it can be recovered in a relatively short time.
It can be seen from Fig.9 that the values of Pv and πv show a linear decline trend with the improvement of memory ability, especially πv, and that Pv is relatively flat.The main reason is that when the memory ability of the system is enhanced, the recovery state nodes will be transformed into immune state nodes faster.As the number of nodes in the immune state increases, those nodes have a better resistance to the subsequent virus attacks.Moreover, the recovery ability of the system will be relatively enhanced, which will exert a certain inhibition effect on the virus propagation.

Fig.9 The effect of memory ability
4 Conclusions
1)Reducing the propagation rate of inter-domains can effectively control virus propagation in inter-domains, and can delay the decline trend of the system survivability.
2)Strengthening the recovery ability of a system can make the system return back to normal work as soon as possible.
3)Enhancing the memory ability of a system can greatly improve the system survivability.
In the future, we plan to study the classification of each typical virus propagation, virus variation due to the changes in the external environment, and the survival resistance mechanism within a system and so on.The model may be adjusted according to the real situation, and the impact of the other parameters in the model will also be further analyzed.
References
[1]Westmark V R.A definition for information system survivability [C]//Proceedings of the 37th Annual Hawaii International Conference on System Science.Washington, DC, USA: IEEE Computer Society, 2004: 2086-2096.DOI:10.1109/HICSS.2004.1265710.
[2]Mell P, Grance T.The NIST definition of cloud computing[J].Communications of the ACM, 2011, 53(6): 50-50.DOI: 10.6028/NIST.SP.800-145.
[3]Chang X L, Zhang Z J, Li X D, et al.Model-based survivability analysis of a virtualized system[C]//IEEE 41st Conference on Local Computer Networks (LCN).Dubai, United Arab Emirates, 2016: 611-614.DOI:10.1109/LCN.2016.104.
[4]Jin Y L, Zhou X Q, Bai Z S, et al.Survivability-aware topology evolution model with link and node deletion in wireless sensor networks[J].International Journal of Distributed Sensor Networks, 2014, 10(4): 278629.DOI:10.1155/2014/278629.
[5]Zhou J A, Miao H K, Kai J Y, et al.Survivability prediction of web system based on log statistics[C]//IEEE ACIS 16th International Conference on Software Engineering, Artificial Intelligence, Networking and Parallel/Distributed Computing (SNPD).Takamatsu, Japan, 2015: 15359578.DOI:10.1109/SNPD.2015.7176170.
[6]Alobaidi I A, Sarvestani S S, Hurson A R.Survivability analysis and recovery support for smart grids[C]// 2016 Resilience Week (RWS).Chicago, IL, USA, 2016:33-39.DOI:10.1109/rweek.2016.7573303.
[7]Moldovan R D, Todoran E N.Immune system modeling and analysis using Bio-PEPA[C]//IEEE International Conference on Intelligent Computer Communication and Processing.Cluj-Napoca, Romania, 2015: 475-482.DOI:10.1109/iccp.2015.7312706.
[8]Tan Y, Zhang P.Immune based computer virus detection approaches[J].CAAI Transactions on Intelligent System, 2013, 8(1): 80-94.DOI:10.3969/j.issn.1673-4785.201209059.
[9]Piqueira J R C, de Vasconcelos A A, Gabriel C E C J, et al.Dynamic models for computer viruses[J].Computers & Security, 2008, 27(7): 355-359.DOI:10.1016/j.cose.2008.07.006.
[10]Li J, Yang Y, Zhou Y.Global stability of an epidemic model with latent stage and vaccination[J].Nonlinear Analysis: Real World Applications, 2011, 12(4): 2163-2173.DOI:10.1016/j.nonrwa.2010.12.030.
[11]Lü H W, Wang H Q, Lin J Y, et al.A vulnerability propagation model of distributed virtualized systems based on Bio-PEPA[J].Chinese Journal of Computers, 2016, 39(2): 391-404.DOI:10.11897/SP.J.1016.2016.00391.(in Chinese)
[12]Ciocchetta F, Hillston J.Bio-PEPA: A framework for the modelling and analysis of biological systems[J].Theoretical Computer Science, 2009, 410(33): 3065-3084.DOI:10.1016/j.tcs.2009.02.037.
[13]Galpin V.Hybrid semantics for Bio-PEPA[J].Information and Computation, 2014, 236: 122-145.DOI:10.1016/j.ic.2014.01.016.
[14]Duguid A.An overview of the Bio-PEPA eclipse plug-in[C]//Eighth Workshop on Process Algebra and Stochastically Time Activities.Edinburgh, UK, 2009: 121-132.
[15]Zhao J, Zhou Y, Shuo L.A situation awareness model of system survivability based on variable fuzzy set[J].Indonesian Journal of Electrical Engineering and Computer Science, 2012, 10(8): 2239-2246.DOI:10.11591/telkomnika.v10i8.1691.
[16]Chen T P, Cui W Y, Meng X R, et al.A method of IP network survivability evaluation method under performance monitoring[J].Journal of Beijing University of Posts and Telecommunications, 2015, 38(6):20-23.DOI:10.13190/j.jbupt.2015.06.005.(in Chinese)
[17]Van Mieghem P, Omic J, Kooij R.Virus spread in networks[J].IEEE/ACM Transactions on Networking, 2009, 17(1): 1-14.DOI:10.1109/tnet.2008.925623.
[18]Gillespie D T.Stochastic simulation of chemical kinetics[J].Annual Review of Physical Chemistry, 2007, 58(1): 35-55.DOI:10.1146/annurev.physchem.58.032806.104637.