Signalized intersections with a permitted phase are commonly used on urban roads.According to themanual on uniform traffic control devices (MUTCD) [1], left-turning vehicles under a permitted phase must yield to opposing through vehicles with priority.The right-of-way is quite similar to that of under unsignalized intersections.Experts always regarded left-turning vehicles as being on the minor street and not entering the intersection unless the gap between opposing through vehicles, assumed as the major stream, was at least equal to the critical gap[2].
However, drivers in some countries such as Germany, Finland, Norway, and China, may not follow the assumption of full compliance with the right-of-way, and instead compete for priority[3-5].Though the non-strict priority phenomenon can bring an improvement in the capacity of shared lanes at an intersection, it will still lead to a negative impact on traffic safety[6].
Some experts have paid much attention to the non-strict priority phenomenon and did some research based on the non-strict priority.Troutbeck et al.[7-8] proposed limited priority to analyze the merging process.In their system, the major stream will slow down to accommodate vehicles on the minor road, particularly under high-flow conditions.Ma et al.[9] applied their theory to calculate the capacity of an intersection without signal indication and the critical volume of traffic signal warrant.
Wang et al.[10-11] did not use the gap acceptance theory based on the right-of-way, but described the crossing behavior at an unsignalized intersection in the platoon analysis method.In their studies, two conflict traffic flows drove through the intersection alternately by a platoon of vehicles.Similarly, Bai[12] proposed a concept of a left-turn group to discuss the crossing maneuver of a left-turning vehicle.
In addition, some statistical techniques have been applied in analyzing behaviors under the non-strict priority.For example,Kaysi et al.[13] developed binary probit models based on a collected data set to find the significant variables in determining the aggressiveness of a specific driver.Liu et al.[14] collected 10 motion parameters of straight-moving vehicles without signal indication and applied CART (classification and regression trees)to study how straight-moving drivers made preemptive/yielding decisions at an intersection without signal indication.Lin et al.[15] used robust regression to calibrate a driving-force model, born out of the air-resistance model, for right-turn drivers which constitute the dominant party when crossing through non-motorized vehicles.
There is also the non-strict priority crossing behavior at a signalized intersection with a permitted phase.Left-turning vehicles force through vehicles to slow down and even stop to accommodate their crossing maneuver.Especially at the beginning of the green phase, the left-turning vehicle at the top of a queue always adjusts its trajectory to make the crossing point nearer to them than that to through vehicles and accelerates to preempt the crossing point before the through vehicles.
As for the design of lane line extensions, the MUTCD pointed out that line extensions should be the same color and at least the same width as the line markings they extend [1].RiLSA suggests using X-dotted lines at crossing points within intersections to guide the turning flows[16].The code in China says that left-lane line extensions must be used at the intersection with a crossing angle less than 70°or an exiting approach that is difficult to observe[17].Traffic engineers can certainly obtain informative results from the literature but they still cannot determine the specific location of left-lane line extensions within an intersection.
In this paper, the non-yielding maneuver of leading left-turning vehicles at the beginning of a green phase will be analyzed through trajectory distribution, speed distribution and acceleration distribution.Then left-lane line extensions will be optimally designed according to the intersection geometry to restrict the non-yielding maneuver of permitted left-turning vehicles.
1 Data Collection
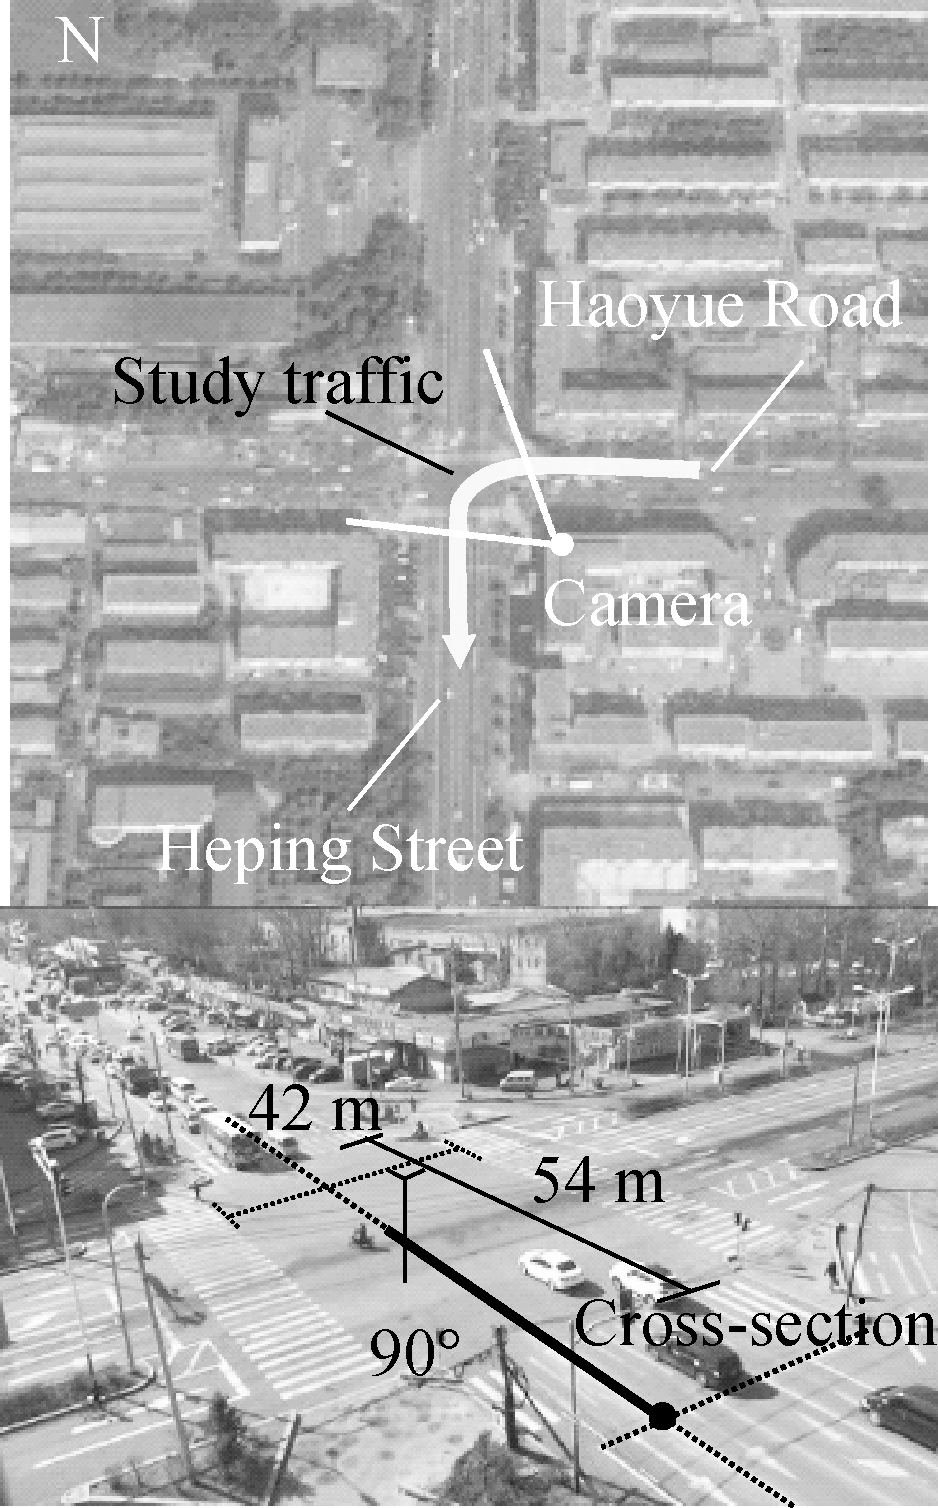
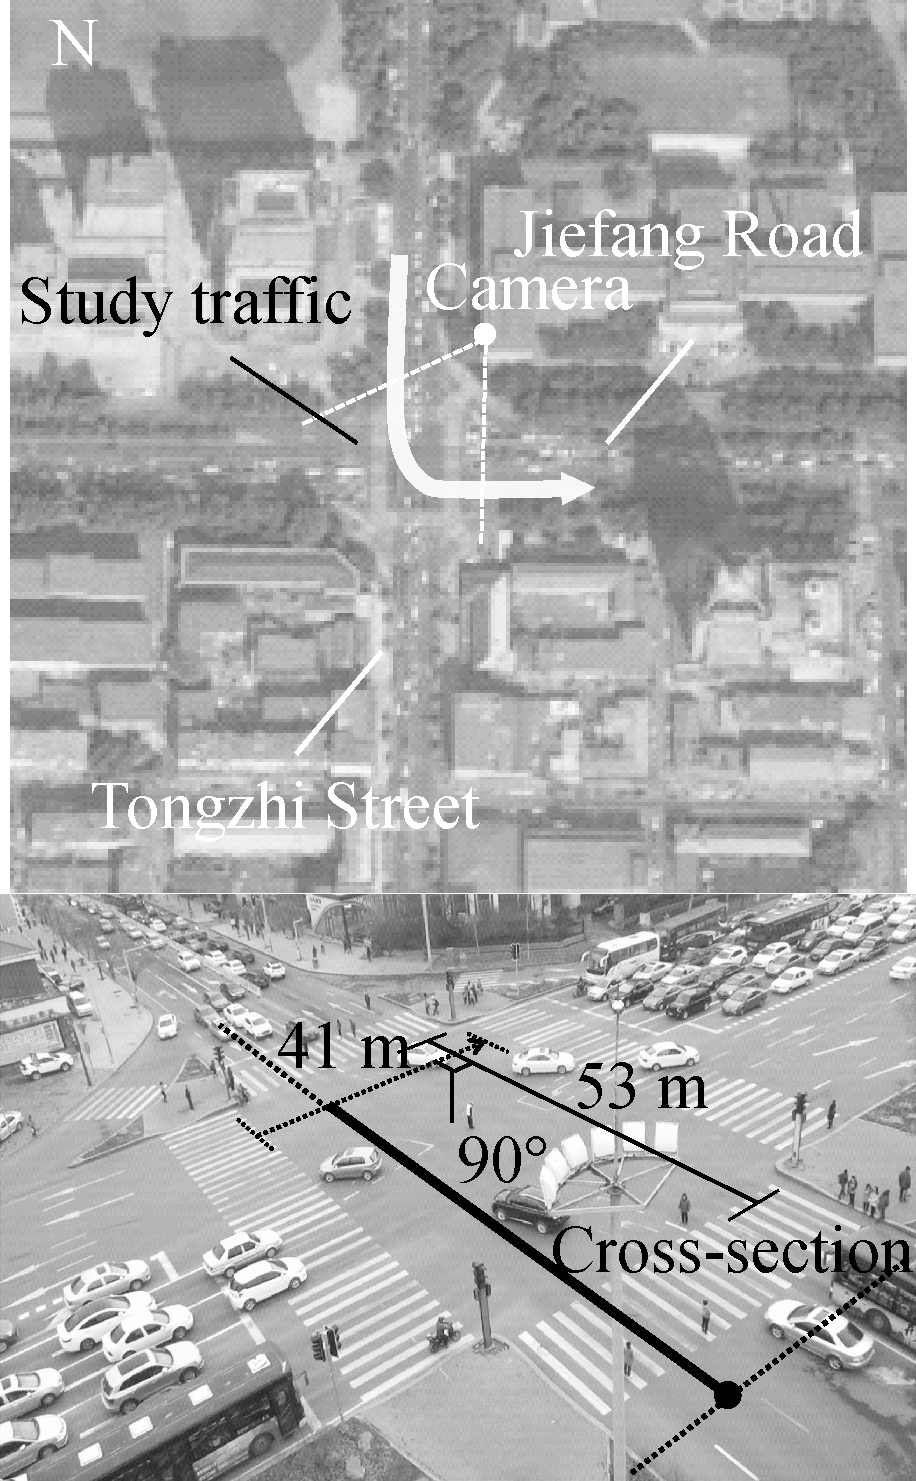
To capture significant characteristics of non-yielding maneuvers, two signalized intersections (one with a permitted phase, the other with a protected phase)were selected to collect information on left-turning vehicles in Changchun, China.Basic information about these two studied sites is shown in Fig.1 and Tab.1.
(a)
(b)
Fig.1 Basic information about two study intersections.(a)Hao-yue Road-Heping Street;(b)Jiefang Road-Tongzhi Street
Tab.1 Basic information about the two intersections

IntersectionnameHaoyueRoad⁃HepingStreetJiefangRoad⁃TongzhiStreetSignalcontrolmodePermittedProtectedIntersectionangle/(°)9090ApproachEastNorthNumberofentrylanes33Widthoflanes/m3.253.25Samplesize474460
Digital video cameras were positioned on the roof of high buildings surrounding the intersection to obtain visual data during the permitted/protected phase.Corel Video Studio Pro X7 software was used to convert videos into sequence photographs at 5 frame/s.Then, Track Pro[18] was applied to extract the locations and timing of each left-turning vehicle at the top of a queue when a green phase began.The software can automatically convert the video coordinates to global coordinates and modify the distortion of observation.The point acquired was set to be the left-front wheel touching the ground.Observations were conducted from 14:00 to 16:00 on over eight days in July 2014, from 13:00 to 17:00 on Sept 4th to 6th, 2017 and from 11:30 to 16:30 on Sept.11th to 12 th, 2017.In total, 474 leading left-turning vehicles under the permitted phase and 460 vehicles under the protected phase were recorded.
Three kinds of information were collected: The location along the cross-section, the speed when crossing the section, as the average acceleration from the stop line to the cross-section.The speed was obtained by the ratio of the vehicle’s length and the travel time used to pass the cross-section for the whole body.Due to the signal control to the traffic flow, the initial speed of each left-turning vehicle at the top of a queue was zero.The average acceleration was the speed divided by the travel time from the stop line to the cross-section.
2 Data Analysis on Permitted Left-Turning Behaviors
2.1 Trajectory distribution
A cross-section along the turning paths shown in Fig.1 was selected to analyze the lateral trajectory density distribution and the lateral cumulative distribution.It represents the average path of the opposing through traffic, which means that all crossing points between left-turning and opposing through vehicles were located along this section[19].Its positive axis was along the arrow direction with the black spot as the origin.Fig.2 provides a group of curves describing trajectory distributions at the cross-section in an interval of 1 m.
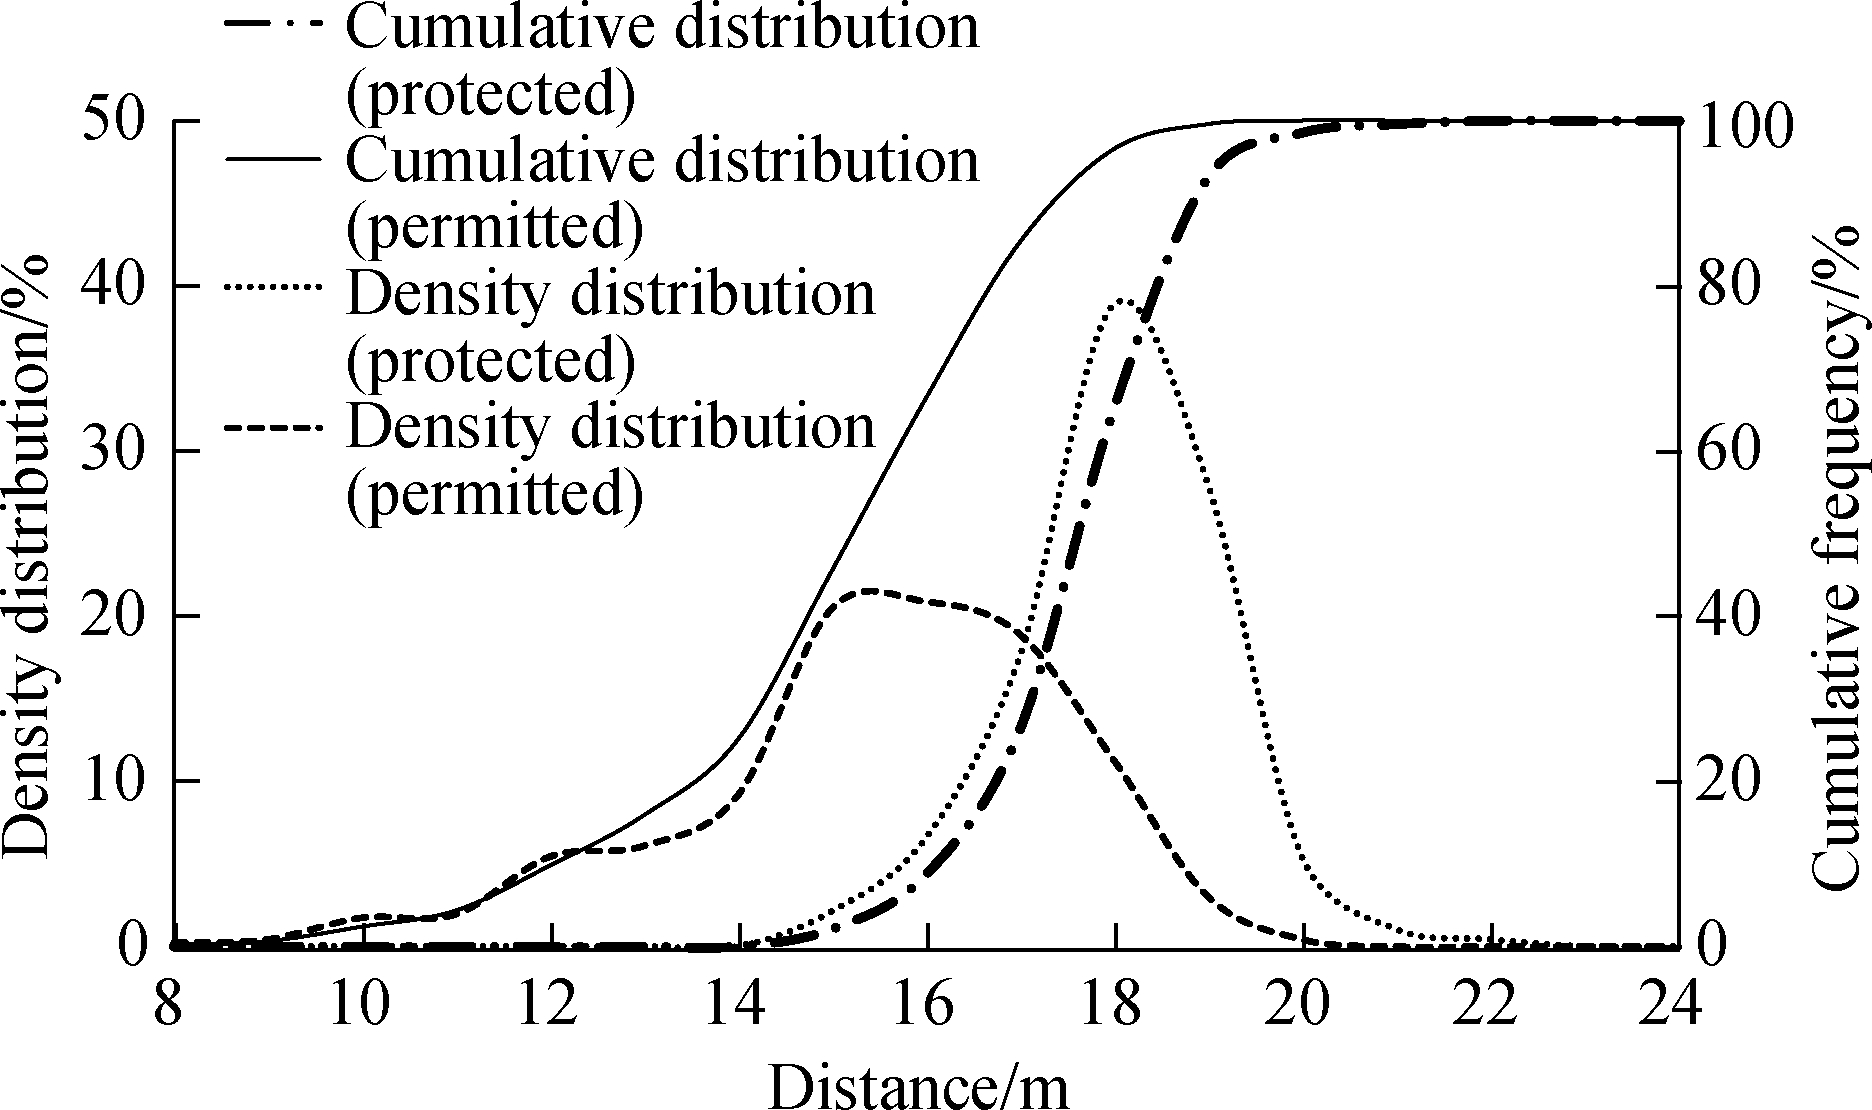
Fig.2 Trajectory distribution at a cross-section
It can be seen that the crossing point under the protected phase was highly concentrated from 16 to 20 m but for the permitted phase the range was a little wider from 10 to 20 m.Such a finding can also be validated by the value of the kurtosis coefficient.Trajectory distributions under two modes are leptokurtic because both of their kurtosis coefficients are greater than zero.The leptokurtic distribution indicates the similarity of left-turning behaviors under each mode.However, the distribution of the permitted phase exhibits a little more fat-tailed, since its kurtosis coefficient of 0.48 is smaller than 0.85 under the protected phase.
For trajectories under a permitted phase, the average distance is around 15.6 m with a 2.1 m standard deviation, while trajectories under a protected phase exhibit a significant difference with 18.4 as the mean and 1.0 m as the standard deviation.The statistics show that the distance between the crossing point and the origin under a permitted phase is shorter than that of a protected phase.
At the beginning of a circular green indication, there is no conflict traffic stream running within the intersection.The left-turning driver prefers a shorter path to encounter the cross-section before through vehicles.The distribution of the crossing point is nearer to the entry approach than that under a protected phase.According to Bai’s study[12], once a leading left-turning vehicle can cross through, the following vehicles will take the chance to maintain a small interval so that they can finish the turning movement successfully.The observation means that the crossing through stream will be severely delayed at the beginning of a permitted phase.In addition, these through vehicles have to brake and start in a short distance.Once the driver’s response is not timely, an accident will occur.Therefore, the non-yielding maneuver may have a negative impact on through vehicles.
2.2 Speed distribution
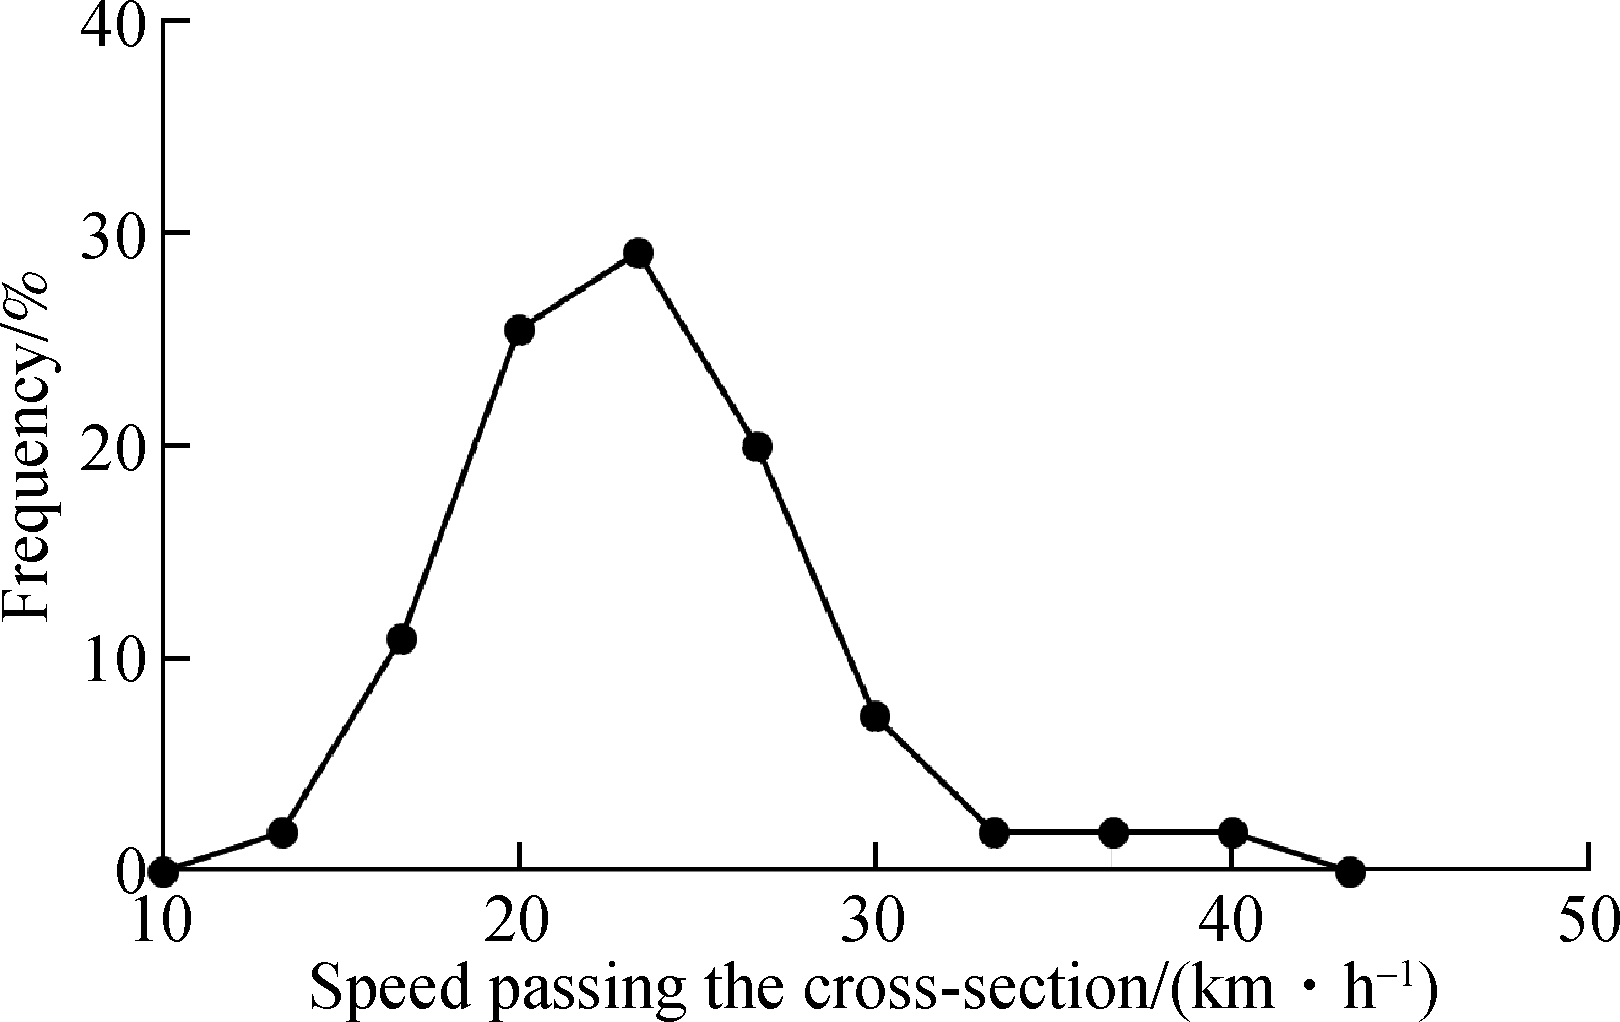
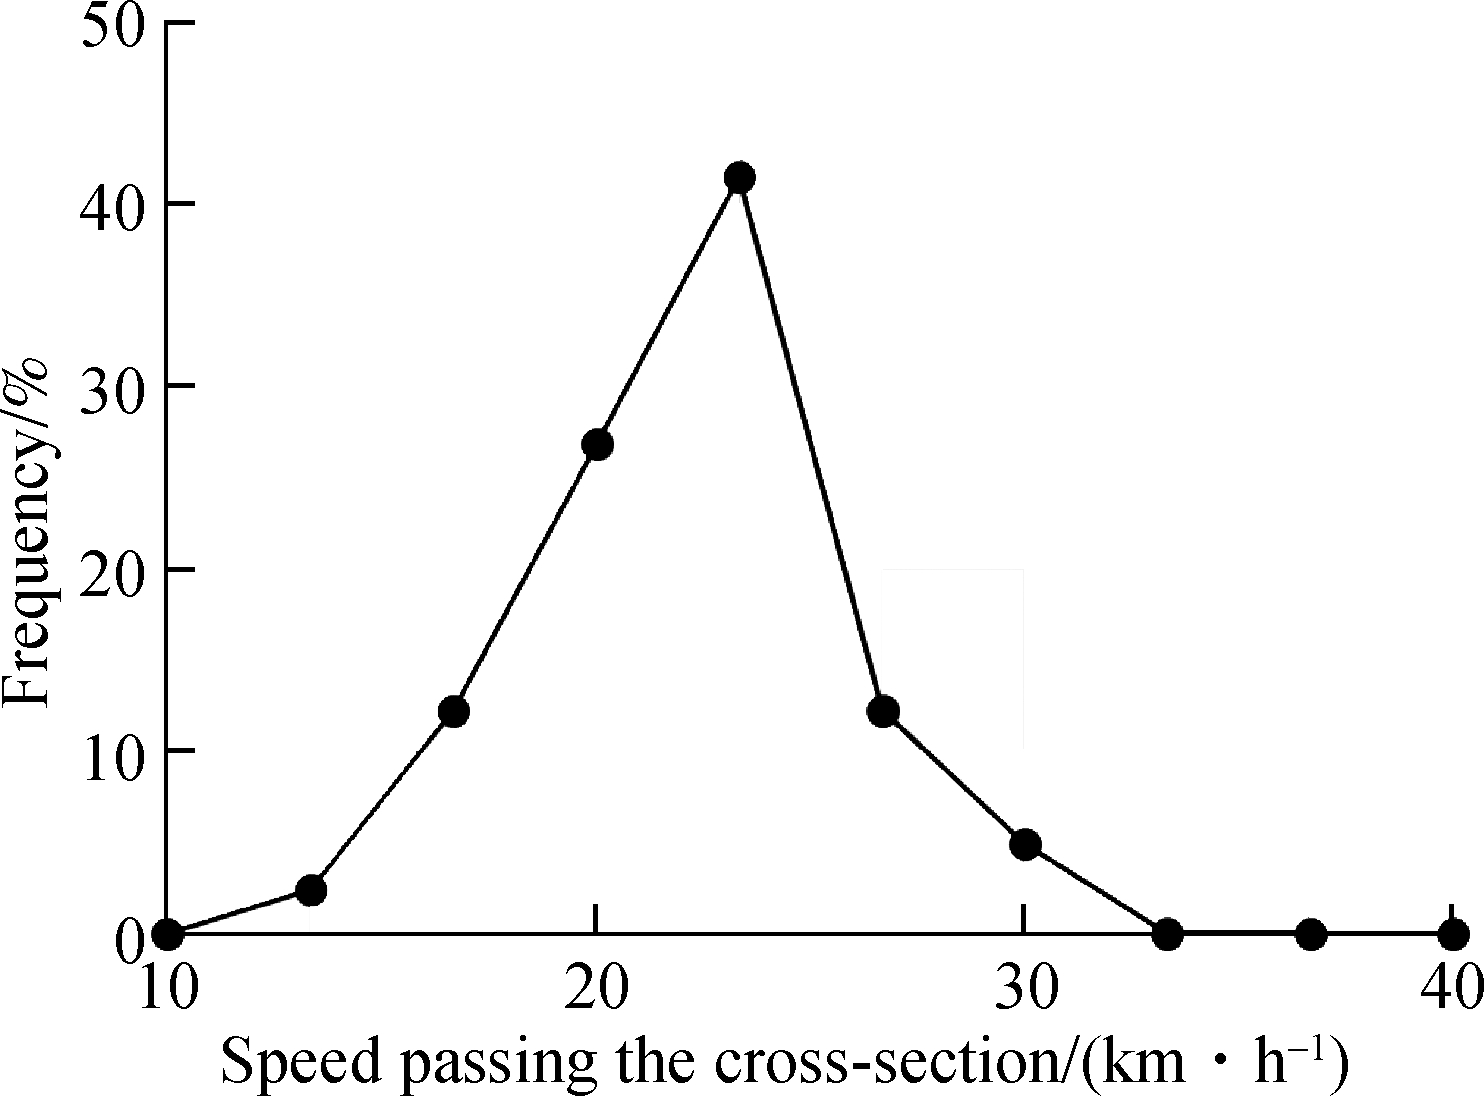
Vehicular speed is a significant factor reflecting drivers’ maneuvers.Speeds passing the cross-section were collected and analyzed.The distribution of the left-turning vehicle speed passing the cross-section is shown in Fig.3.
The one-sample K-S test showed that the speed distributions of both groups follow the normal distribution with z=0.665 and the p value of 0.768 under the permitted phase and z=0.487and the p value of 0.972 under the protected phase.For permitted left-turning vehicles, the average speed was around 21.6 km/h with a 4.1 km/h std.deviation.There was no significant difference between the statistics of left-turns under the protected phase, with 20.8 km/h as the mean speed and 3.3 km/h as the std.deviation.Furthermore, the result of the independent-sample t-test t=1.199 and the p value of 0.233 prove such a finding that left-turning vehicles under these two modes have a similar speed distribution when passing the cross-section.
This is because the turning radius at the intersection is usually small and cannot permit a high speed.Though drivers would like to cross the intersection quickly, they have to control their speeds and avoid steering side slip.As speed distributions show no difference, the gradient of speed and acceleration should be discussed to explore the reflection of the non-yielding maneuver.
(a)
(b)
Fig.3 Distribution of left-turning vehicle speeds passing the cross-section.(a)Under the permitted phase;(b)Under the protected phase
2.3 Acceleration distribution
Acceleration is taken as a vehicle’s response to a given stimulus[2].In this work, stimuli come from different signal control modes.
During the aforementioned analysis, speed distributions were proved to be similar.However, for acceleration, it was the opposite.It can be observed from Fig.4 and Tab.2 that the acceleration distribution under the permitted phase shows a significant difference compared with that under the protected phase.The average acceleration, median acceleration, 75th percentile acceleration, and 25th percentile acceleration are higher and even its median value is nearly equal to the 75th percentile value under the protected phase.There are also six mild outliers and four extreme outliers on the left boxplot.In contrast, no outlier appeared when a protected phase was used.Moreover, the skewness under the two kinds of mode was quite distinct.The coefficient for permitted left-turns is 2.58, which is greater than 0, suggesting that the acceleration may follow a positively skewed distribution.The acceleration distribution for protected left-turns is symmetrical with the coefficient close to zero.
Tab.2 Descriptive statistics for left-turn acceleration when passing the cross-section

PhaseNumberofsamplesMeanacceleration/(m·s-2)Std.deviation/(m·s-2)Minimumvalue/(m·s-2)Maximumvalue/(m·s-2)SkewnessPermitted4741.140.450.543.412.58Protected4600.840.240.381.360.14
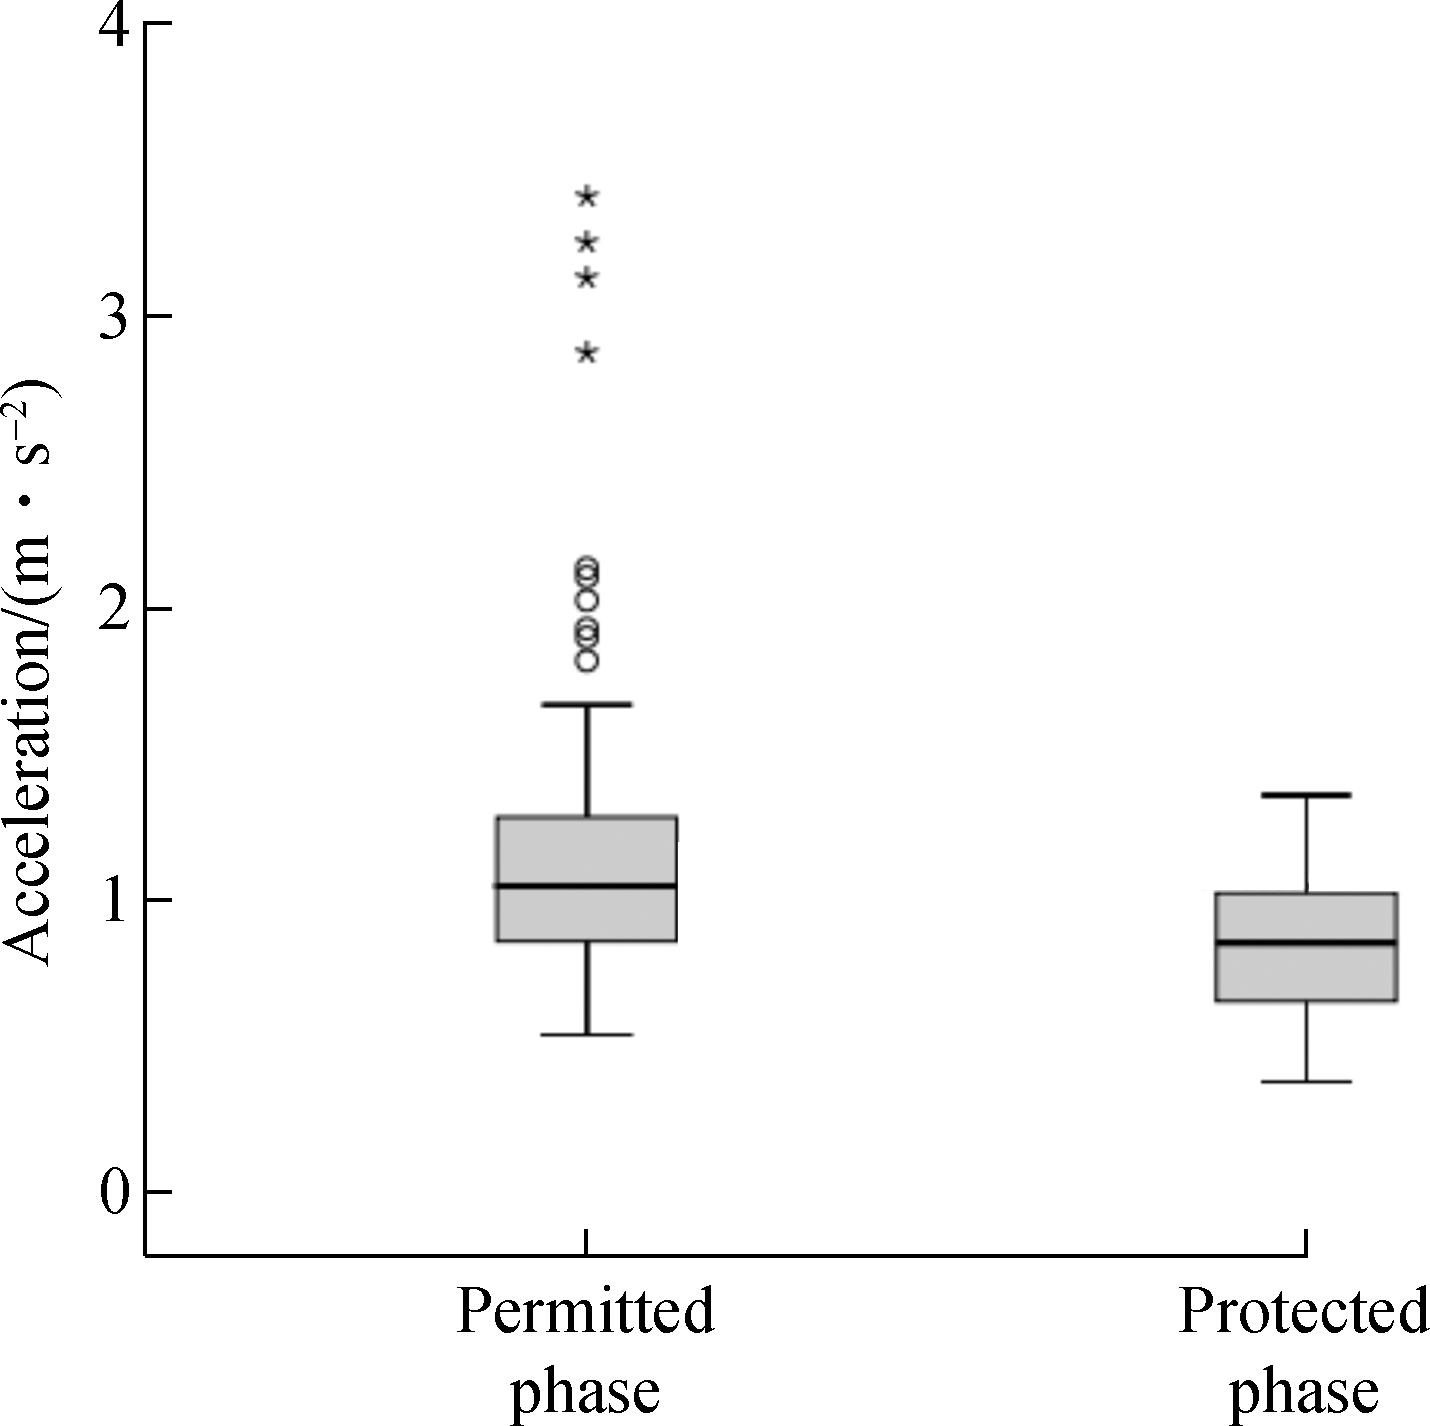
Fig.4 Boxplot of the average acceleration distribution under different modes
From the analysis above, a permitted phase may encourage a leading left-turning driver to make a large acceleration to encounter the crossing point before the opposing through streams.However, the left-turns under a protected phase without a conflict stream from the opposite direction have no need to preempt and maintain a slower acceleration.In addition, a large acceleration means that a driver pays more attention to the accelerator pedal.This may increase the brake-response time and the probability of collisions with opposing vehicles and crossing pedestrians.Therefore, it is necessary for us to restrict this behavior under the permitted phase.
3 Optimal Design of Left-Lane Line Extensions
In this section, left-lane line extensions will be designed to solve the problem of left-turning vehicles always preempting the crossing point.Their trajectories will be restricted by line extensions to protect the priority of opposing through streams.The modeling of the left-lane line extensions includes the following procedures.
Step 1 Creating Cartesian coordinates for an intersection and obtaining geometry parameters
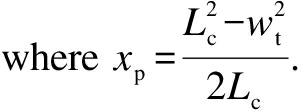
For quantitative analysis, an intersection coordinate is created and four geometry parameters wt, we, Le, Lc are used, as shown in Fig.5.The X-axis is along the center line extensions of the entering approach and the Y-axis is along the stop line of the left-turn lane.wt and we are the length of distance from the X-axis to the right edge of the first lane without a left-turn counted from inside on the opposite direction and to the ending line where vehicles finish their turning movements, respectively.Le and Lc are the length of distance from the Y-axis to the center line of the exiting approach and to the stop line for opposed through vehicles, respectively.All these parameters are in meters.
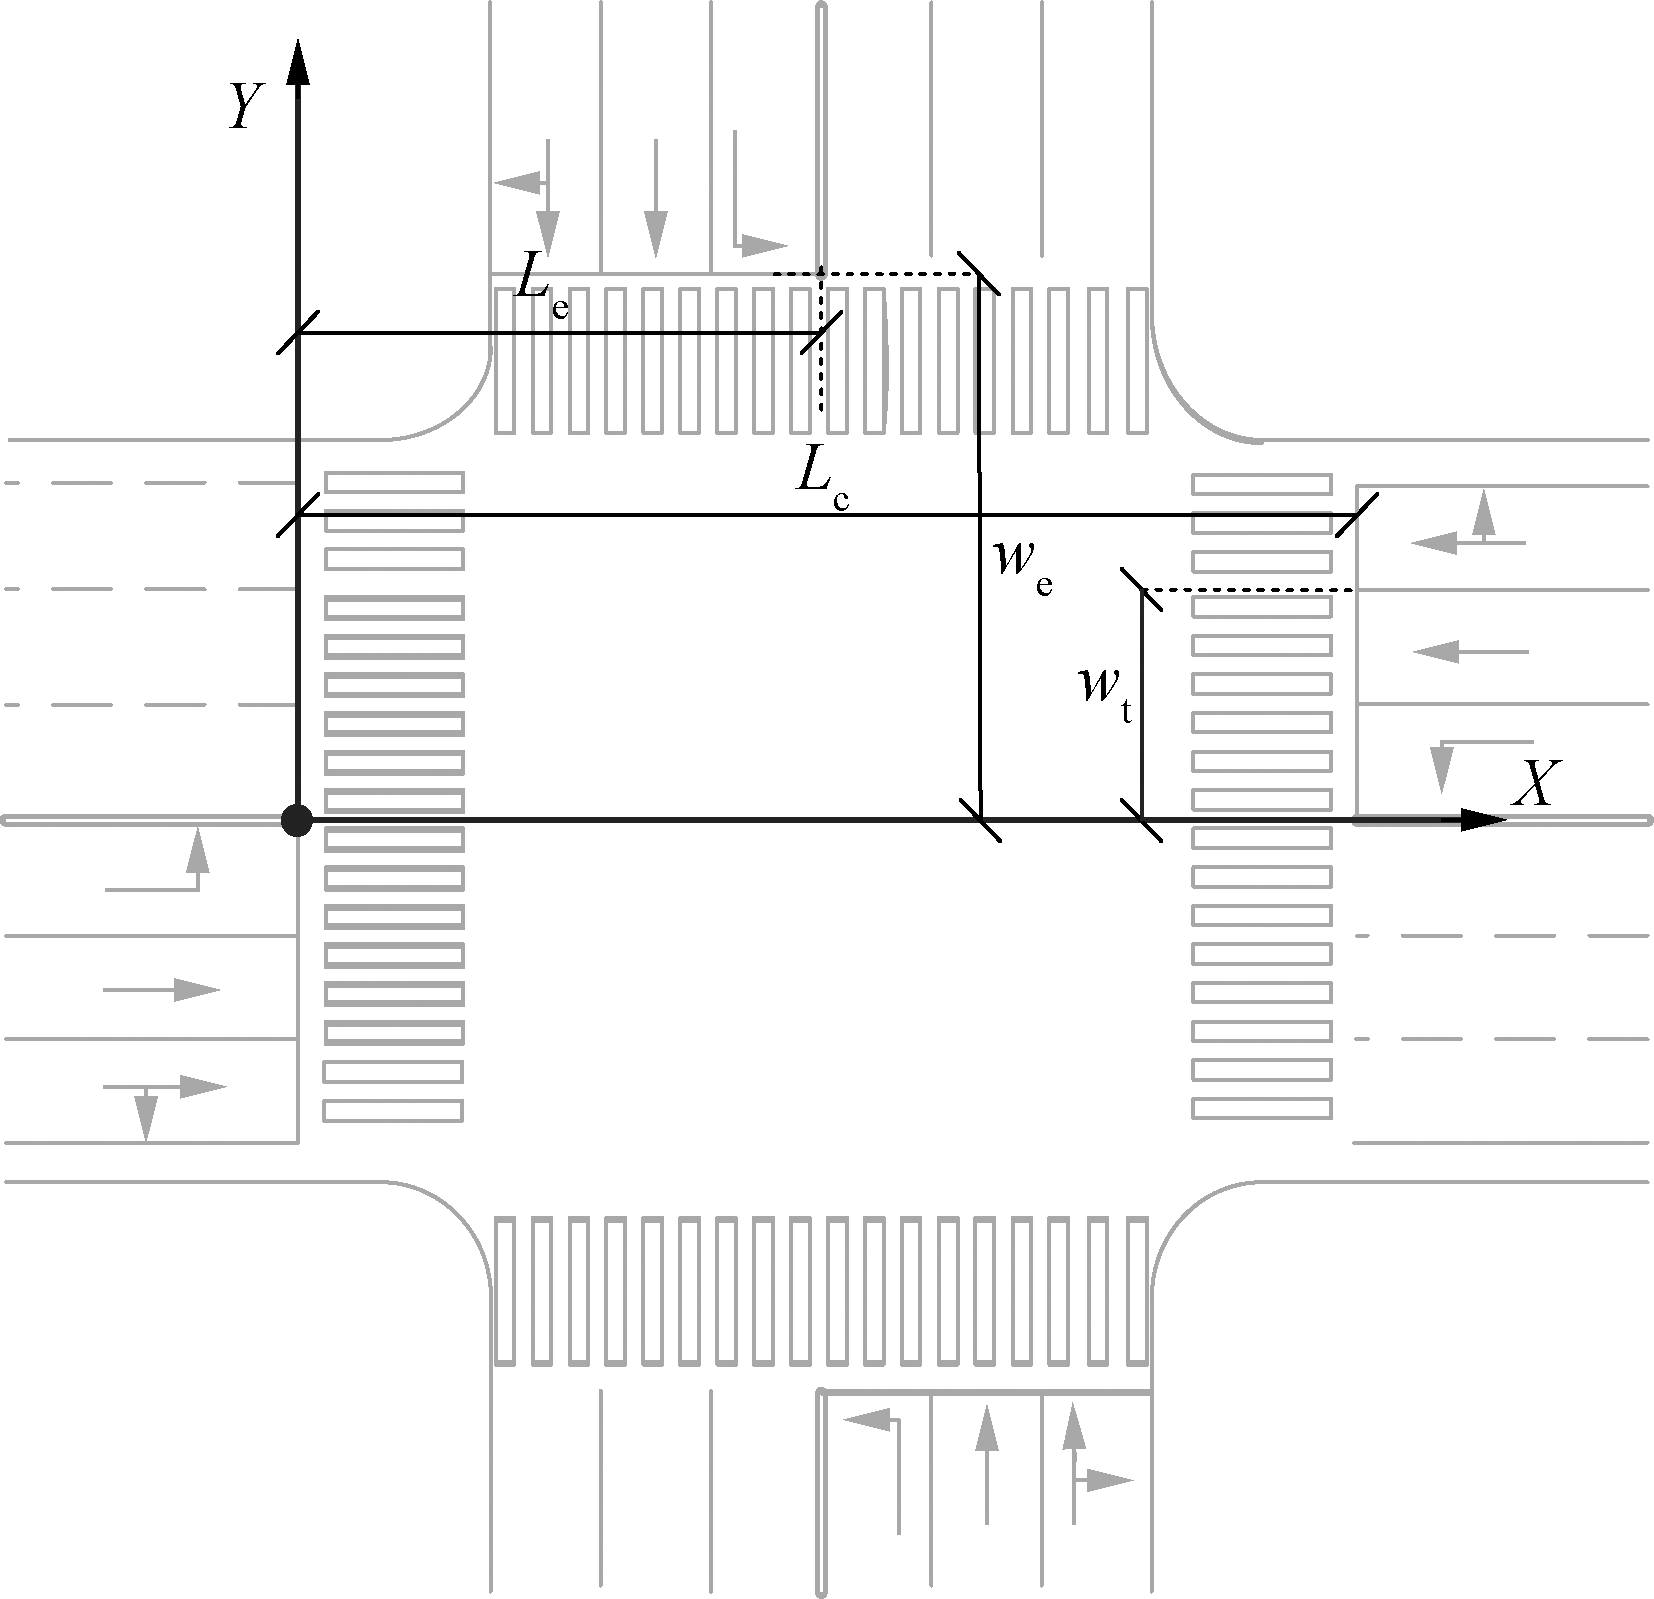
Fig.5 Intersection coordinate and geometry parameters
Step 2 Calculating coordinates of three constraint points along the left-lane line extensions
Three constraints are the key points along the left-lane line extensions containing the start point, end point and crossing point.
The start point is the location where a vehicle leaves the entering approach and begins its turning movement.Since the line extensions are for left front wheels, this point should be determined by the junction of the stop line on the left lane and the center line at the entering approach.Thus, the coordinate of the start point is (0,0).
The end point is the location where a vehicle enters the exit approach and finishes its turning movement.Based on the trajectories of left-front wheels, this point is the endpoint of the center line at the exit approach.Its coordinate is (Le,we).
The crossing point is the potential conflict point between left-turning vehicles and opposing through vehicles and it is denoted as P(xp,yp).Its location is so crucial that it will force left-turning vehicles to yield to the right-of-way to opposing through vehicles.Since the inner lane at the opposing entering approach is exclusively used by left-turns or shared with through vehicles, few opposing through vehicles will have an impact on the turning flow.Thus, the analysis will put more emphasis on conflicts between left-turning vehicles and the crossing through vehicles from the first lane without the left-turn counted from the inside in the opposite direction.
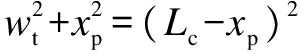
According to the right-of-way under the permitted phase, the design of left-lane line extensions should ensure that the travel time of left-turning vehicles to encounter the crossing point is not smaller than that of the opposing through vehicles.This means that the distance traveled to the crossing point by left-turning vehicles should be larger than that of through vehicles, assuming the same speed distribution of the two conflict flows.When they reach the crossing point at the same time, the right-front corner of a left-turning vehicle will touch the left-front corner of the right-turning vehicle.Meanwhile, the two corners of these two vehicles travel the same distance.As line extensions are for the left front wheel of a left-turning vehicle, trajectories of an opposing through vehicle should be simplified to its right-front wheel rather than the left front wheel.The crossing point P must be along its trajectories and the value of yp is wt.
Then, the value of xp is calculated by Fig.6.L and T are the start points of left-turning vehicles and opposing through vehicles.The left-turning trajectories between L and P ought to form a curve and must be longer than segment LP.For easy calculation, let the length of LP be equal to the length of TP.In this way, ![]() must be longer than TP and the left-turning vehicles will encounter the crossing point after opposing through vehicles.Based on the relationships among intersections’ geometry parameters, we have
must be longer than TP and the left-turning vehicles will encounter the crossing point after opposing through vehicles.Based on the relationships among intersections’ geometry parameters, we have
LF2+PF2=LP2=TP2
(1)
(2)
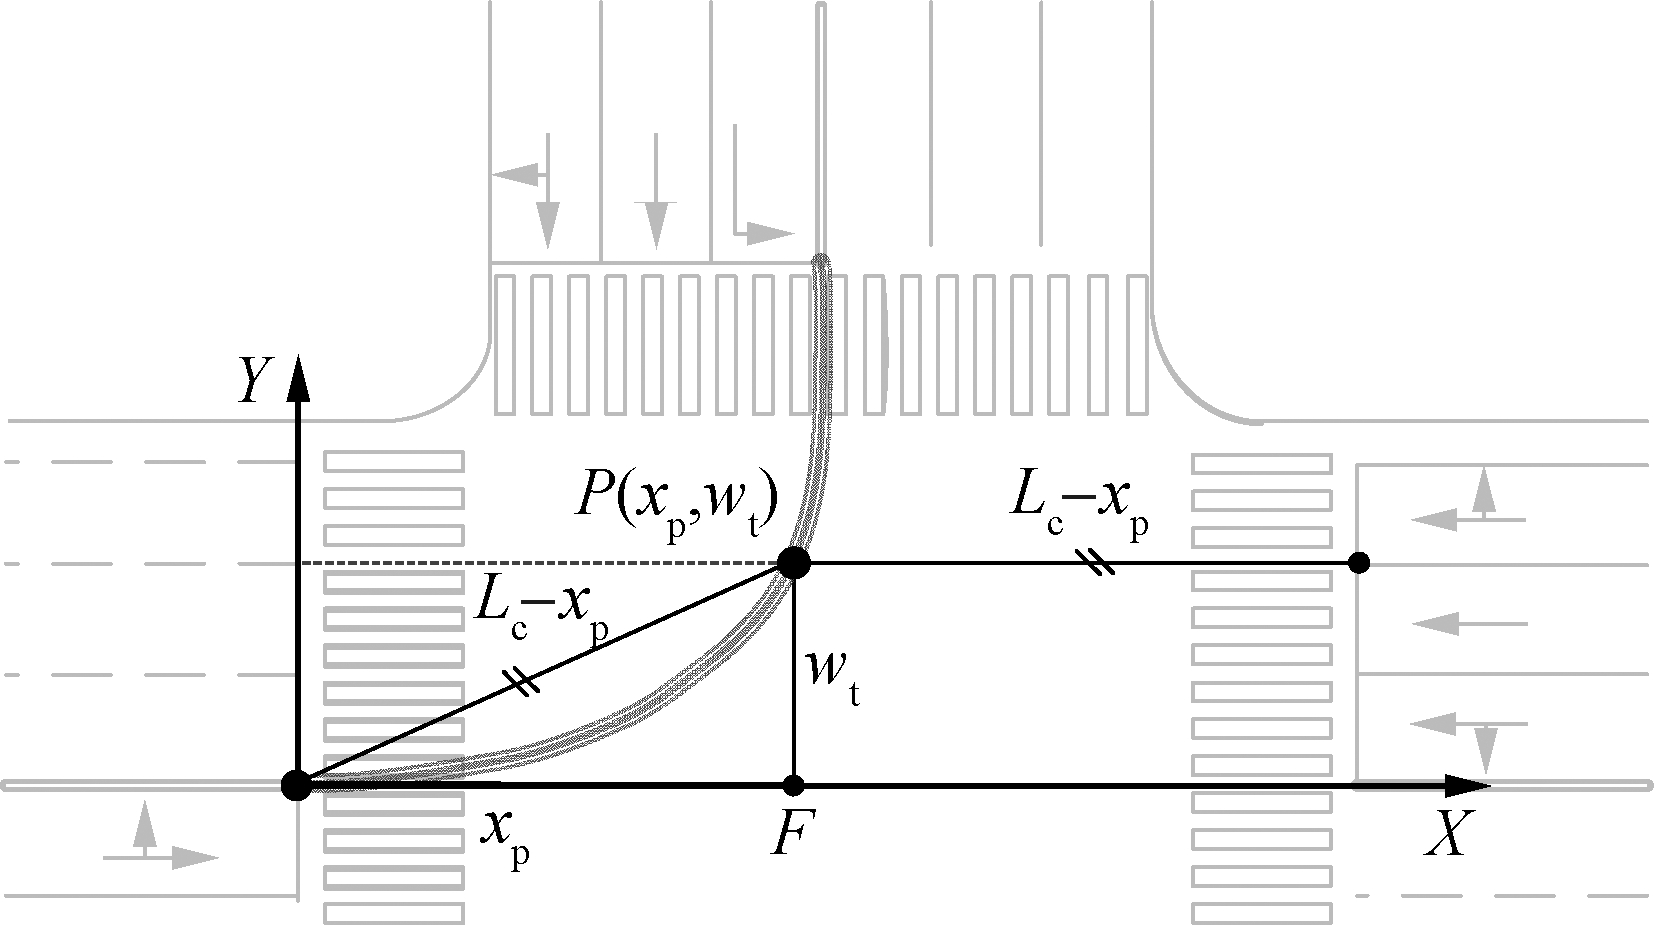
Fig.6 The location of the crossing point P
The value of xp can be achieved by

(3)
Step 3 Developing the formula of left-lane line extensions
Left-lane line extensions should be smoothly designed based on the vehicle’s turning trajectories.Thus, two types of segments are used: circular curves and transition curves, as shown in Fig.7.To make the model easy to use, only one transition segment is designed following the circular curves and P is regarded as the cut-off point of these two segments.

Fig.7 Design of left lane line extensions using circular and transition curve
Segment 1 Circular curve calculation
Along the left-lane line extensions, the circular curve is ![]() with point R(0,r)as the center.The RL and X-axis are perpendicular since L is the initial point entering the circular curve.In the Cartesian coordinates, the model of the circular curve can be written as
with point R(0,r)as the center.The RL and X-axis are perpendicular since L is the initial point entering the circular curve.In the Cartesian coordinates, the model of the circular curve can be written as
(4)
Then the radius r is calculated by RL=RP as follows:
(xp-0)2+(wt-r)2=r2
(5)
Therefore, the radius r is
(6)
Substituting Eq.(3)into Eq.(6), we can obtain
(7)
Segment 2 Transition curve calculation
In this study, cubic parabolas are installed as the transition segment ![]() The basic formula of cubic parabolas is
The basic formula of cubic parabolas is
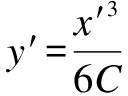
(8)
where C is the parameter of cubic parabolas to be calculated.However, the basic formula is applied to the Cartesian coordinates X′-Y′ with E as the origin point.Therefore, Eq.(8)should be transformed into Cartesian coordinates X-Y.According to the intersection geometry, the relationships of two coordinates can be obtained as
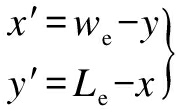
(9)
Substituting Eq.(9)into Eq.(8), a new basic formula for cubic parabolas can be obtained as
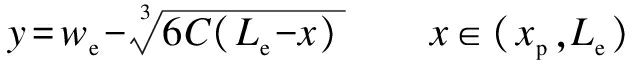
(10)
The value of C can be calculated by putting the coordinate of point P into Eq.(10).
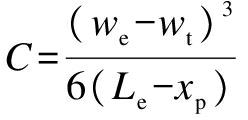
(11)
Finally,
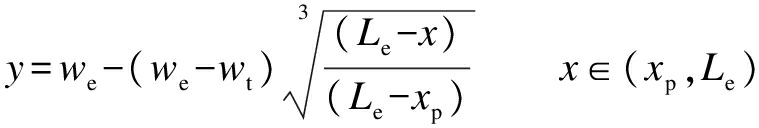
(12)
The model of left-lane line extensions based on the intersection coordinate can be written as
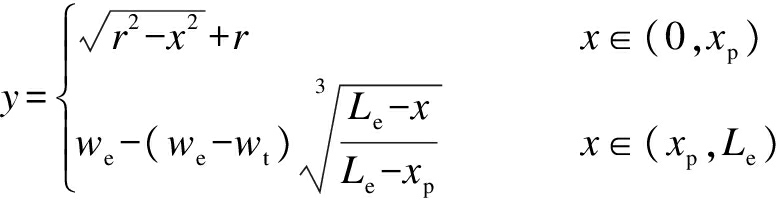
(13)
Finally, the HY-HP intersection was selected as an example.Left-lane line extensions are designed for this intersection.Tab.3 gives the measurements of geometry parameters.
Tab.3 Measurements of geometry parameters at Haoyue-Heping intersectionm
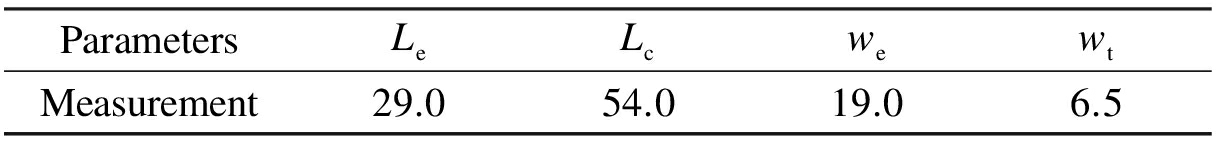
ParametersLeLcwewtMeasurement29.054.019.06.5
After putting the value of each parameter into Eq.(13), the model of the left-lane line extensions for the HY-HP intersection is obtained as
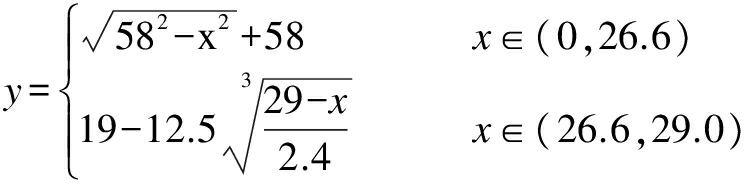
(14)
4 Conclusions
1)A permitted leading left-turning vehicle at the beginning of a green phase will make the crossing point nearer to itself than the opposing through vehicle.
2)For a leading left-turning vehicle at the beginning of a green phase, there is no significant difference in the speed distribution using either a permitted or a protected mode.
3)The permitted phase can make a larger acceleration for the leading left-turning vehicles, so they can encounter the crossing point earlier than opposing through stream.
4)Left-lane line extensions are optimally designed to restrict the non-yielding maneuver of a left-turning vehicle.The formula for line extensions can be easily calculated once four geometry parameters of the intersection are given.
References
[1]Federal Highway Administration.Manual on uniform traffic control devices for streets and highways [S].Washington, DC: US Department of Transportation Federal Highway Administration, 2017.
[2]Lieu H.Trafficflow theory: A state of the art report—Revised monograph on traffic flow theory [M].Washington, DC: US Department of Transportation Federal Highway Administration, 2001.
[3]Räsänen M, Koivisto I, Summala H.Car driver and bicyclist behavior at bicycle crossings under different priority regulations [J].Journal of Safety Research, 1999, 30(1):67-77.DOI:10.1016/S0022-4375(98)00062-0.
[4]Brilon W, Miltner T.Capacity at intersections without traffic signals [J].Transportation Research Record, 2005, 1920:32-40.DOI: 10.3141/1920-04.
[5]Li S S, Qian D, Li N Y.BP simulation model and sensitivity analysis of right-turn vehicles’ crossing decisions at signalized intersection [J].Journal of Transportation Systems Engineering & Information Technology, 2010, 10(2):49-56.DOI:10.1016/s1570-6672(09)60032-5.(in Chinese)
[6]Bai L, Liu P, Chen Y, et al.Comparative analysis of the safety effects of electric bikes at signalized intersections [J].Transportation Research Part D: Transport and Environment, 2013, 20:48-54.DOI:10.1016/j.trd.2013.02.001.
[7]Troutbeck R.Capacity of limited-priority merge [J].Transportation Research Record, 1999, 1678:269-276.DOI:10.3141/1678-32.
[8]Troutbeck R J, Kako S.Limited priority merge at unsignalized intersections [J].Transportation Research Part A: Policy and Practice, 1999, 33(3/4):291-304.DOI:10.1016/ S0965-8564(98)00046-9.
[9]Ma D F, Wang D H, Yang X R, et al.Critical traffic volume of traffic signal warrant under limited priority condition [J].Journal of Southeast University (Natural Science Edition), 2010, 40(4):860-865.DOI:10.3969/j.issn.1001-0505.2010.04.037.(in Chinese)
[10]Wang W.Platoon method of analyzing capacity and delay of non-signalized intersection[J].Journal of Highway and Transportation Research and Development, 1989, 3: 70-79.(in Chinese)
[11]Meng Y P, Deng W, Ge L.Analysis for two-roadways uncontrolled intersection of capacity by motorcade analysis method[J].Journal of Highway and Transportation Research and Development, 2005, 22(12): 119-122.(in Chinese)
[12]Bai Q W, Chen Y H, Qu Z W,et al.Non-strict priority left-turning maneuvers with a permitted phase at signalized intersections: Empirical study in China [J].Journal of Transportation Engineering Part A: Systems, 2017, 143(3): 04016009.DOI:10.1061/jtepbs.0000015.
[13]Kaysi I A, Abbany A S.Modeling aggressive driver behavior at unsignalized intersections [J].Accident Analysis & Prevention, 2007, 39(4): 671-678.DOI:10.1016/j.aap.2006.10.013.
[14]Liu M, Lu G, Wang Y, et al.Analyzing drivers’ crossing decisions at unsignalized intersections in China [J].Transportation Research Part F: Traffic Psychology and Behavior, 2014, 24:244-255.DOI:10.1016/j.trf.2014.04.017.
[15]Lin D, Ma W, Li L,et al.A driving force model for non-strict priority crossing behaviors of right-turn drivers [J].Transportation Research Part B: Methodological, 2015, 83: 230-244.DOI:10.1016/j.trb.2015.10.007.
[16]German Committee of Road and Traffic Engineering.Guidelines for traffic signals (RiLSA)[M].Translated by Li K P.Beijing: China Architecture & Building Press, 2006.(in Chinese)
[17]Ministry of Housing and Urban-Rural Development of the People’s Republic of China.GB 51038—2015 Layout of urban road traffic signs and markings [S].Beijing: China Planning Press, 2015.(in Chinese)
[18]Jiang S, Wang D H, Qu Z W,et al.Extraction and calibration of trajectory characteristics of vehicles at intersections [J].Journal of Southwest Jiaotong University, 2012, 47(5): 784-789.(in Chinese)
[19]Alhajyaseen W, Asano M, Nakamura H, et al.Stochastic approach for modeling the effects of intersection geometry on turning vehicle paths [J].Transportation Research Part C: Emerging Technologies, 2013, 32:170-192.DOI:10.1016/j.trc.2012.09.006.