Guo Jingni,Xu Junxiang,He Zhenggang,et al.Linking strategies to optimize the robustness of multimodal transport network[J].Journal of Southeast University(English Edition) ,2020,36(03):349-356.[doi:10.3969/j.issn.1003-7985.2020.03.014]

针对多式联运网络易受到攻击而面临级联失效风险的问题,提出了3种考虑多式联运特性的低极化链路策略以优化网络鲁棒性:基于节点度的低极化链路策略(D_LPLS)、基于节点介数的低极化链路策略(B_LPLS)、基于节点贴近度的低极化链路策略(C_LPLS).在川藏地区的多式联运网络中进行了实证分析,分别在随机攻击与蓄意攻击模式下将3种策略的优化效果与随机链路策略进行对比.结果表明,C_LPLS能够有效地优化网络的鲁棒性.在随机攻击模式下,C_LPLS在链路增加比例为15%以下时优势明显,在链路增加比例为15%~30%时与B_LPLS相比具有微弱的优势; 在蓄意攻击模式下,随着链路增加比例的上升,C_LPLS的优势则越来越明显.因此对于多式联运网络,采用C_LPLS增加链路有利于网络的风险控制,能够为未来多式联运网络结构的优化提供理论支撑.
In view of the problem that the multimodal transport network is vulnerable to attack and faces the risk of cascading failure, three low polarization linking strategies considering the characteristics of the multimodal transport network are proposed to optimize network robustness. They are the low polarization linking strategy based on the degree of nodes(D_LPLS), low polarization linking strategy based on the betweenness of nodes(B_LPLS), and low polarization linking strategy based on the closeness of nodes(C_LPLS). The multimodal transport network in the Sichuan-Tibet region is analyzed, and the optimization effects of these three strategies are compared with the random linking strategy under random attacks and intentional attacks. The results show that C_LPLS can effectively optimize the robustness of the network. Under random attacks, the advantages of C_LPLS are obvious when the ratio of increased links is less than 15%, but it has fewer advantages compared with B_LPLS when the ratio of increased links is 15% to 30%. Under intentional attacks, as the ratio of increased links goes up, the advantages of C_LPLS become more obvious. Therefore, the increase of links by C_LPLS is conducive to the risk control of the network, which can provide theoretical support for the optimization of future multimodal transport network structures.
Due to its advantages of low cost, low energy consumption and high efficiency, multimodal transport has developed rapidly in China. But at the same time, the wide distribution of transport nodes also renders the nodes in the multimodal transport network vulnerable and under failure risk. Due to the flowing of loads in the network, the redistributions of failure nodes may overload normal nodes and lead to a cascading failure of the network[1-3]. Therefore, it is necessary to optimize the robustness of the multimodal transport network. At present, for optimizing its robustness, the relevant literature is mainly divided into two parts: One is to propose the nodes' immune strategies through the selection of immune nodes[4-7]; the other is to optimize the network structure through linking strategies. In the context of attacks on network nodes, the robustness optimization effect of the linking strategies is obvious. The linking strategies were first applied in the information network[8] and the virus propagation network[9-10]. By increasing links to reduce the risk of network failure, the linking strategies are also applied to the power network[11-12] and the traffic network[13-14]. Related research mainly proposed a random linking strategy(RLS), a low degree linking strategy(LDLS), a high betweenness linking strategy, and a low polarization linking strategy based on betweenness(LPLS)[15], and explored the applicability of different linking strategies. These strategies are based on the nature of a single node to select the links, but they ignore the impact of the linking strategies on the global structure, which is one of the shortcomings of the existing research. At the same time, existing research is carried out on a single network, but the multimodal transport network needs to consider the dependence and complexity between subnetworks. As a result, the existing research cannot be applied to the multimodal transport network.
Inspired by Cao et al.[15], this paper proposes a low polarization linking strategy with the degree of nodes(D_LPLS), a low polarization linking strategy based on the betweenness of nodes(B_LPLS), and a low polarization linking strategy based on the closeness of nodes(C_LPLS)with the consideration of the structural characteristics of the multimodal transport network. Three strategies take the enhancement of the network robustness as the overall goal and can optimize the network structure. Taking the multimodal transport network in the Sichuan-Tibet region as an example, we compare the effects of D_LPLS, B_LPLS, C_LPLS and RLS under two attack modes, respectively, and verify the effectiveness and applicability of the three strategies.
The optimization of the multimodal transport network plays an important role in promoting the development of the region and even the country. The purpose of this paper is to find the optimal linking strategy for the multimodal transport network based on the network structure. It is an important part of the optimization of the multimodal transport network structure, which can provide theoretical support for the development of the network, and has important practical significance.
1 Multimodal Transport Network Structure AnalysisA multimodal transport network is composed of two or more independent transport networks.Each transport network is regarded as a subnetwork. There are some nodes connected to the nodes of other networks, which are called associated nodes, and subnetworks are connected by associated nodes to form a multimodal transport network. The structure of the multimodal transport network is shown in Fig.1.
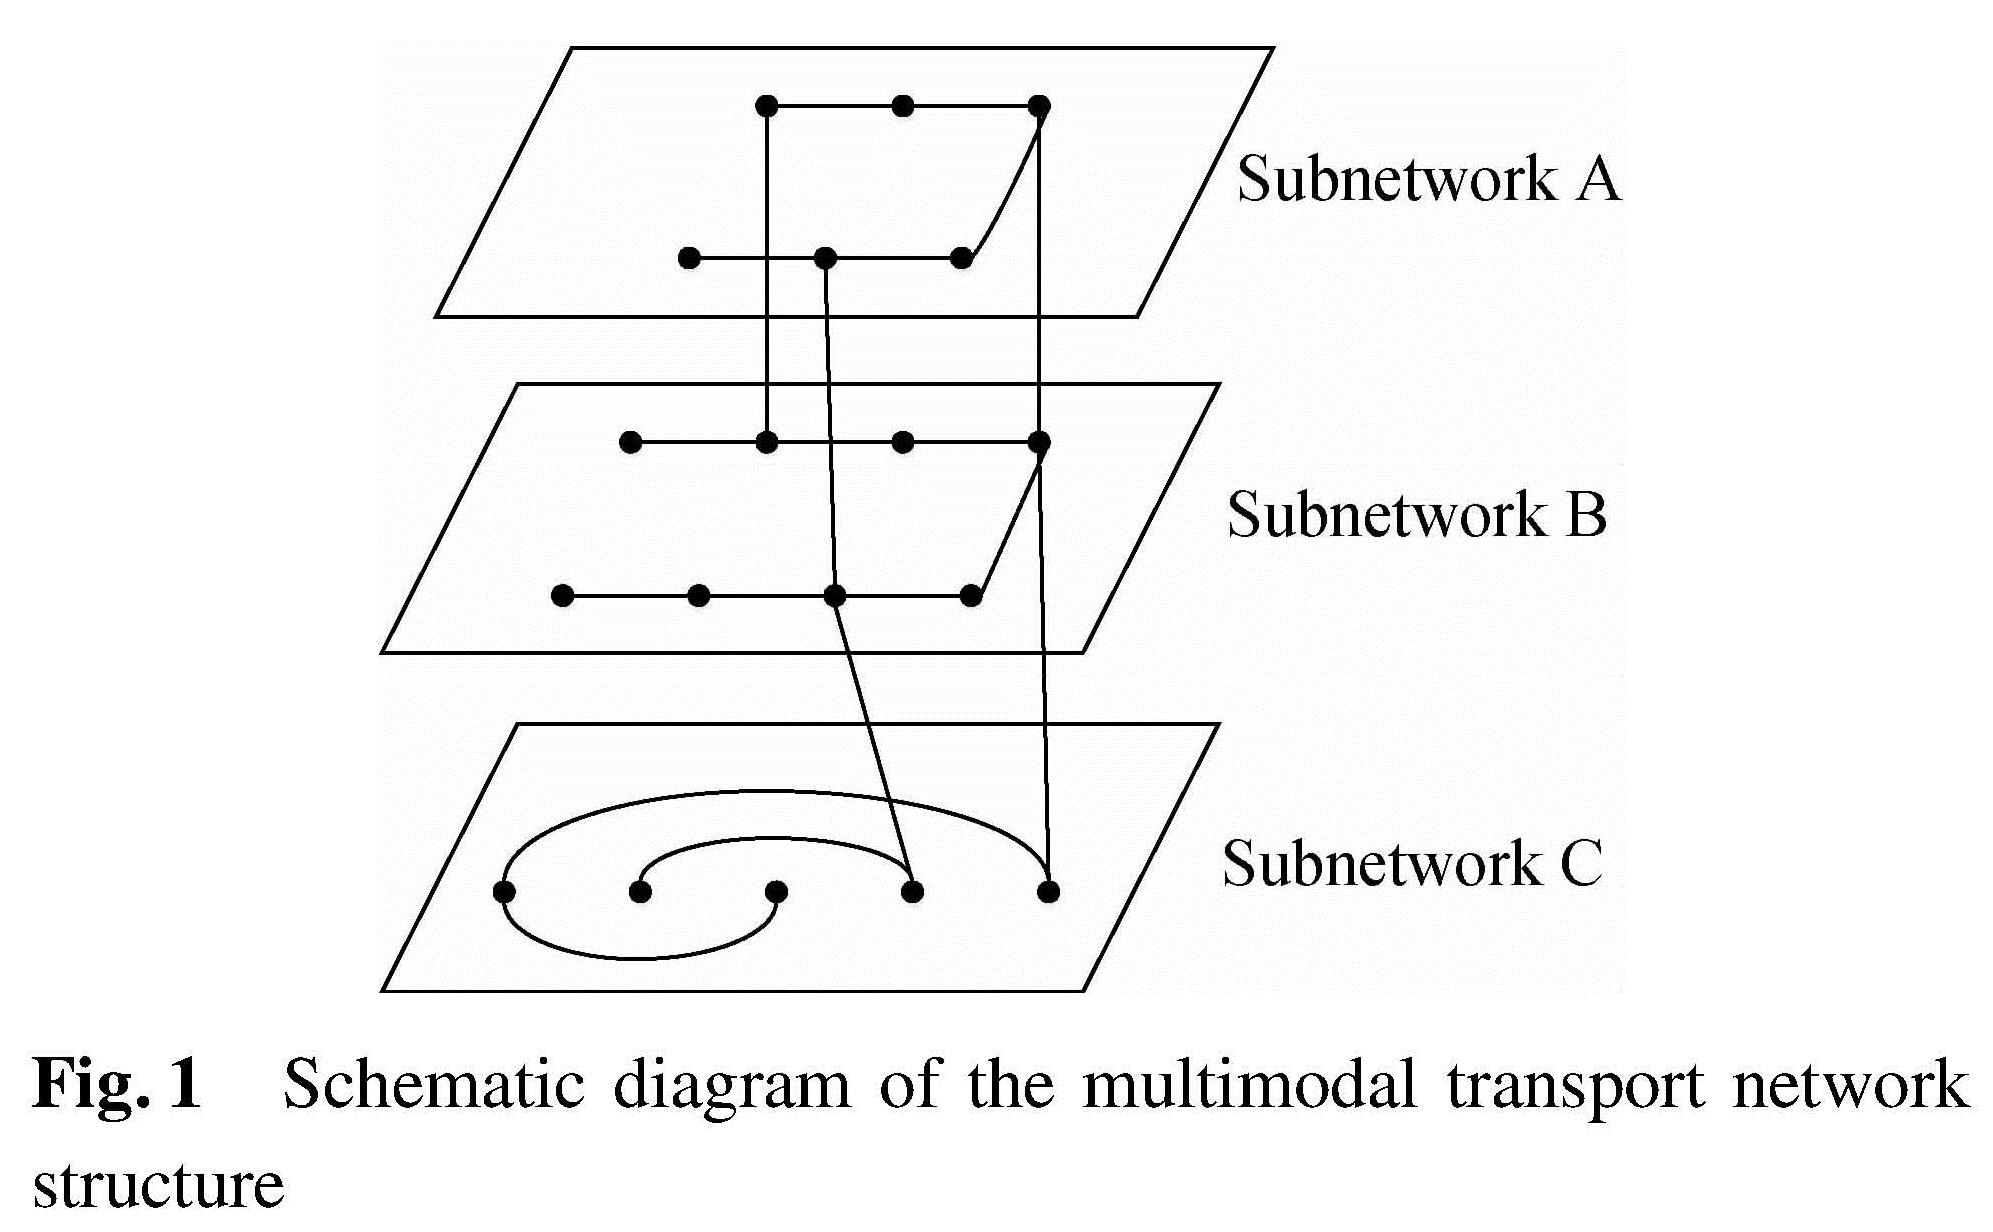
Fig.1 Schematic diagram of the multimodal transport network structure
In Fig.1, the complex network consists of three subnetworks, which are connected by multiple associated nodes. In the multimodal transport network, different indicators such as the subnetwork connection structure and the proportion of connected nodes will have an impact on the network robustness. In reality, most multimodal transport networks are asymmetric, and the number of nodes in each subnetwork is not the same. Meanwhile, the number of associated nodes among subnetworks is less than 100% of the total number of nodes in each subnetwork, which is a partially connected network. Therefore, the research of this paper is carried out on the complex network connected by asymmetric parts.
2 Cascading Failure Model of Multimodal Transport NetworkIn a multimodal transport network, when one or more nodes or links fail due to network attacks, it will cause the successive failure of other nodes or links, and eventually cause partial or even entire network failure. This phenomenon is called a cascading failure phenomenon[16]. For example, in the subway network, the interruption of a station will affect the normal operation of the corresponding lines and even the whole network. In the power network, the failure of a key node may hinder the normal transmission of the whole power network, which are all actual cascading failures. Due to space limitation, this paper only studies the failure of nodes, and the change process is shown in Fig.2.
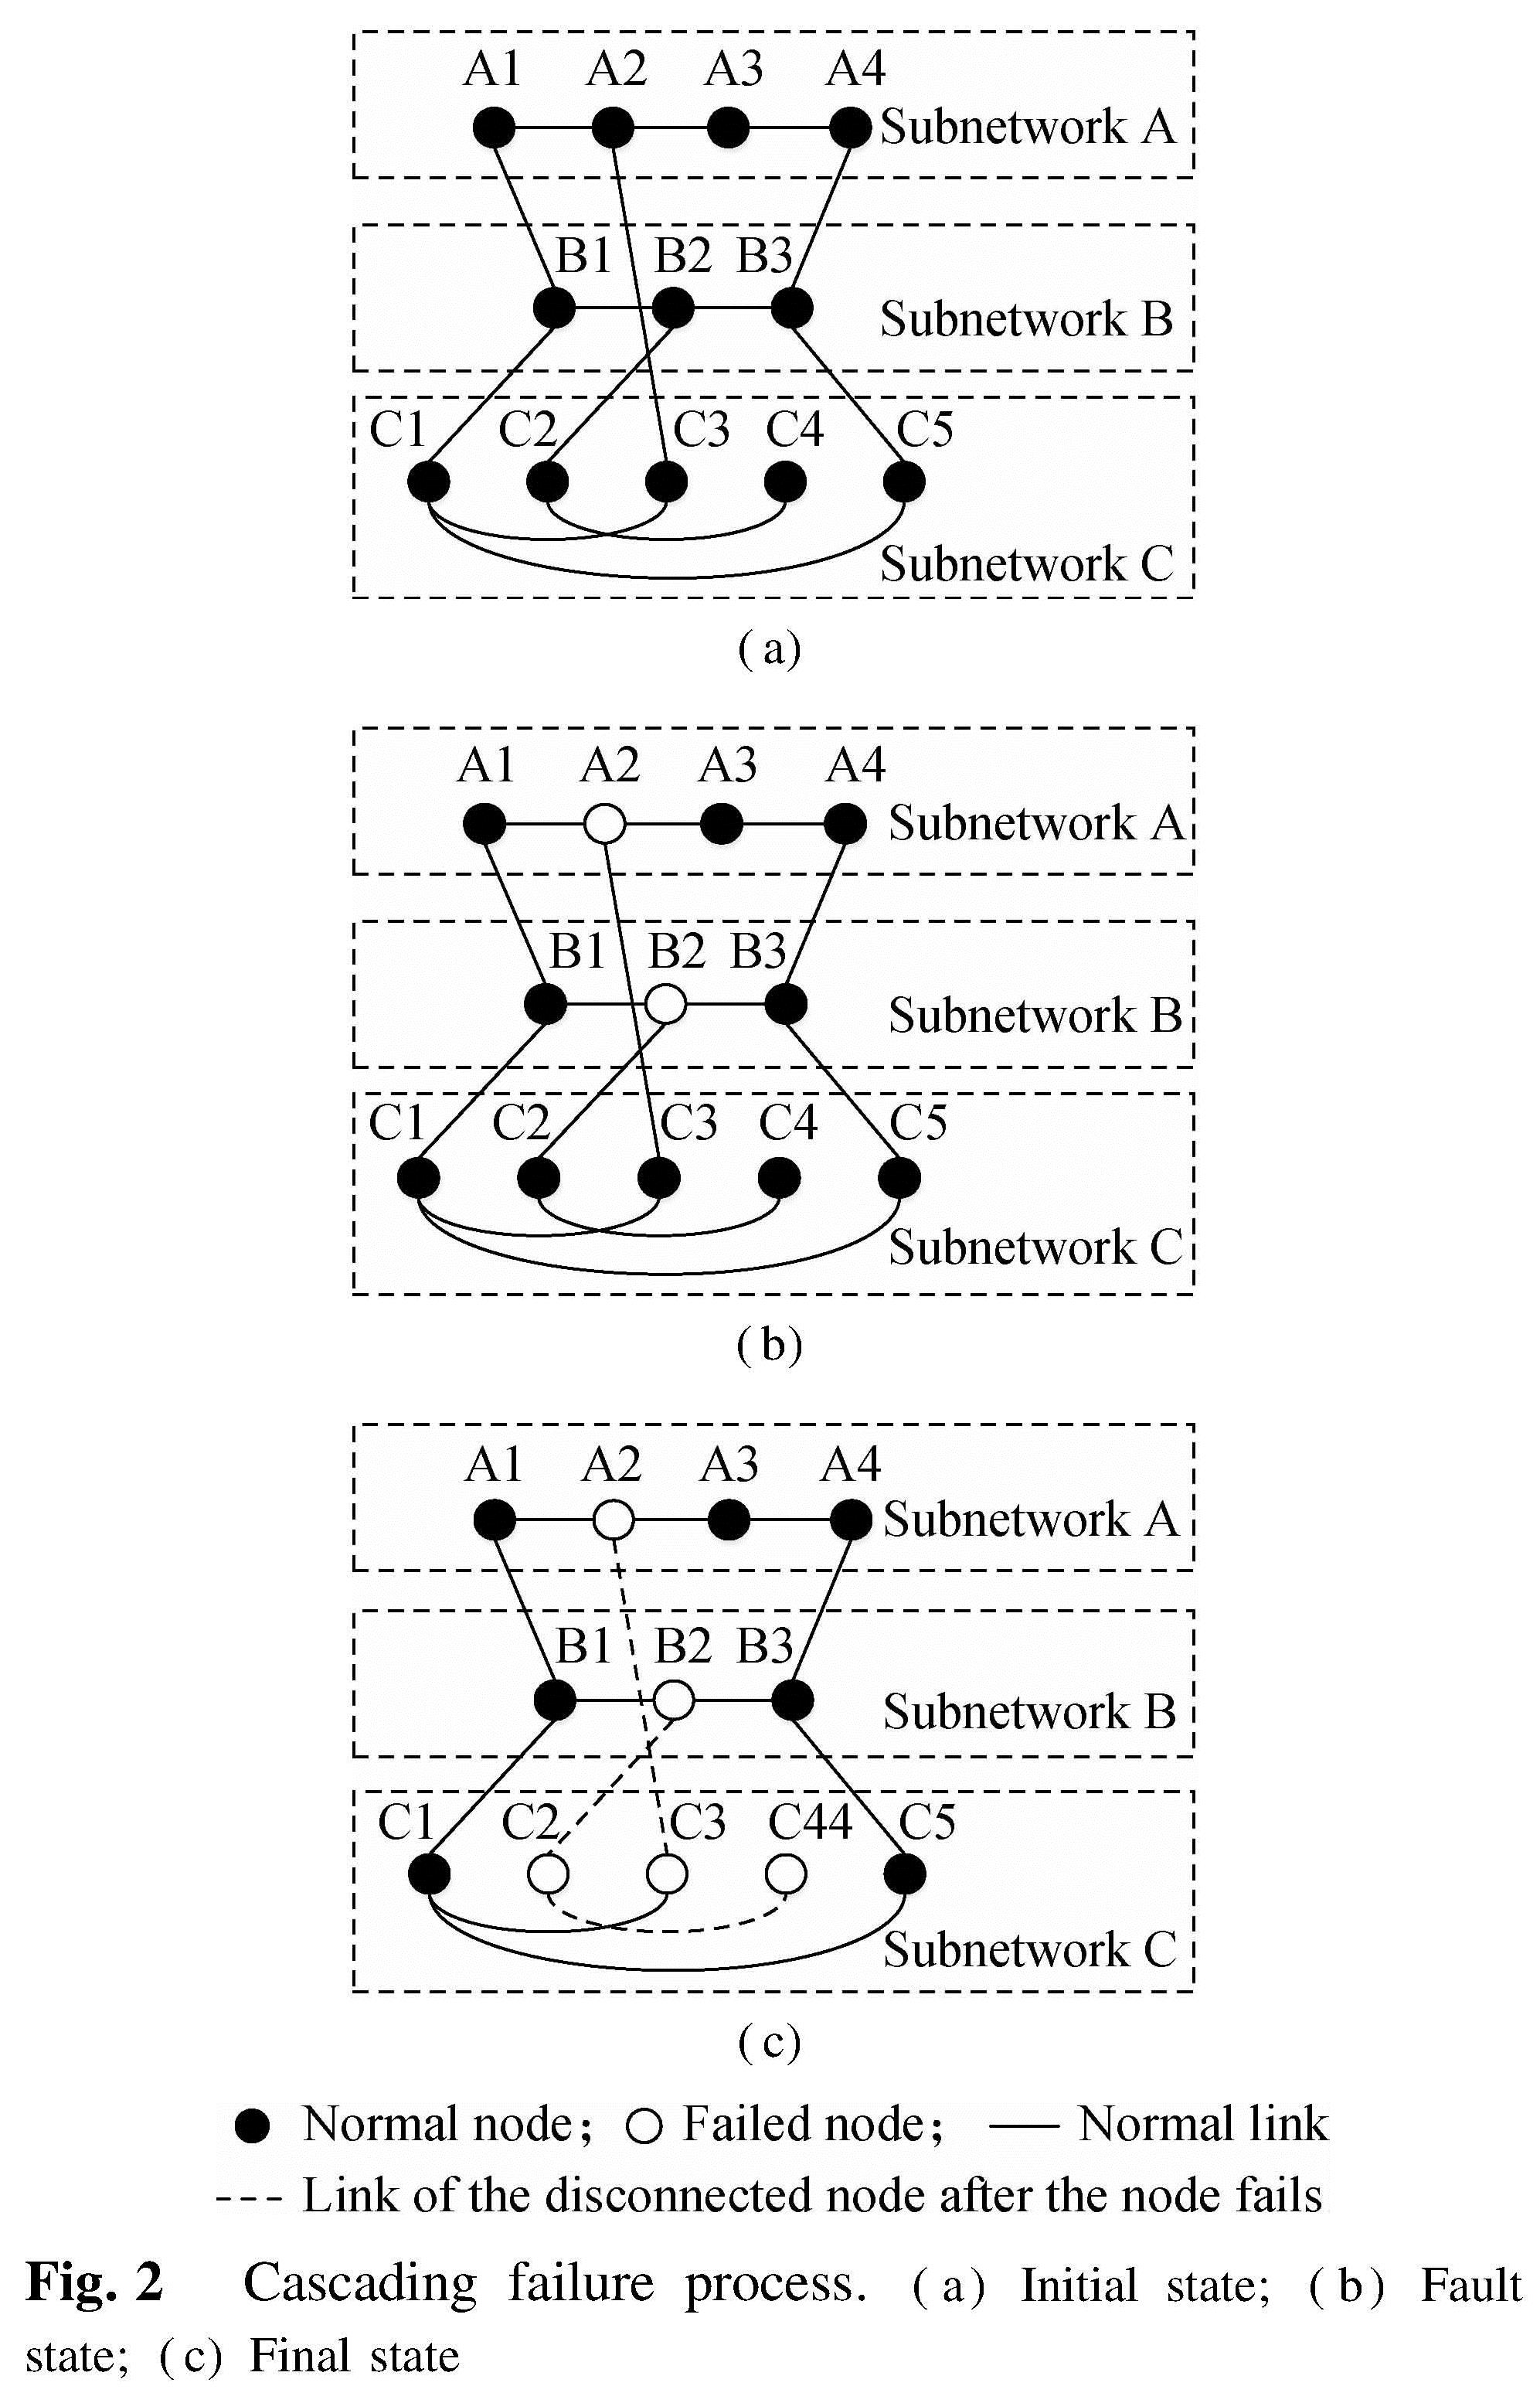
Fig.2 Cascading failure process.(a)Initial stste;(b)Fault state;(c)Final state
The initial state of the network is shown in Fig.2(a). When A2 and B2 in the network are attacked and fail, the network presentation is as shown in Fig.2(b). According to the percolation theory[17-19], only the nodes that belong to the largest connected component in the network can maintain their functions, and some nodes fail immediately due to their inability to connect. The load of the failed nodes is redistributed to the neighboring nodes, the load of node A2 is distributed to nodes A1, A3 and C3, and the load of node B2 is distributed to nodes B1, B3 and C2. It is assumed that C3 fails due to load redistribution, and C2 and C4 cannot connect due to the percolation theory. Under the effect of cascade failure, the changes in the network connectivity are shown in Fig.2(c).
2.1 Load-capacity modelThe node load-capacity model is used for calculation[20]. Let node i have an initial load of L0i, a capacity of Ci, and a degree of ki, and then
Ci=(1+β)L0i=(1+β)kαi(1)
where β is the tolerance factor. The greater the β, the larger the capacity of the node. α is a variable parameter, which is used to adjust the relationship between the node degree and the initial load. According to the previous research[21],α=1.6.
In the multimodal transport network, due to the limitation of the basic settings, the nodes and links in the network are interrelated, which causes the cascading failure phenomenon in the multimodal transport network to have particularities. We define the particularities.
Definition 1 When a node failure occurs in a subnetwork in the multimodal transport network, the failed node becomes a unidirectional circulation node. The load can only flow out, and this process is irreversible. At the same time, the load on the failed node can only flow to other subnetworks.
Definition 2 When a node in an intermodal network becomes overloaded, the overloaded node can only redistribute the load once. When the node becomes overloaded again, it will fail and will be removed from the largest component.
When node i fails, the load on it needs to be allocated to neighboring node j, and the load redistribution method based on the local weighted traffic distribution is adopted with the goal of network balance. Then, the additional load ΔLij received by node j is
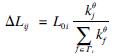 (2)
(2)
where Γi is a set of all nodes adjacent to node i; θ is a variable parameter. When Lj+ΔLij>Cj, node j is overloaded. When node j becomes overloaded for the first time, the part beyond Cj will be redistributed according to Eq.(2). When node j becomes overloaded for the second time, the node will fail and be removed from the largest component.
2.2 Cascading failure measurement indexIn the multimodal transport network, the proportion of nodes in the largest component G is taken as the measurement index. In the network, We define that the total number of nodes in the multimodal transport network is N, and the total number of nodes in subnetworks A,B,C are NA,NB and NC, respectively. In the largest component, the total number of nodes is N', and the total number of normal nodes in subnetworks A, B, C are N'A,N'B and N'C, respectively.
G=(N')/N=(N'A+N'B+N'C)/(NA+NB+NC)(3)
3 Linking Strategies and Algorithm Design3.1 Linking strategiesIn the multimodal transport network, due to the limitations of practical factors, no link between any two nodes can be added to the network. The link strategies can be described according to the characteristics of different transport networks:
1)For the highway, it depends on the construction of infrastructure. Considering the high cost of infrastructure construction and a long construction period, it is difficult to increase links within the highway network. Therefore, the highway network can only increase links with other transport networks.
2)For the railway, the method of increasing links is to organize the direct trains between two nodes.
3)For aviation and waterways, the way of increasing links is to increase routes between two nodes where routes have not been scheduled.
4)Increasing a link between two different transport networks means building a logistics park between the two nodes so that cargos can be transferred quickly.
Increasing links is one of the most effective methods to improve network robustness. According to the previous research[22-23], the more uniform the network, the higher its robustness. Based on the node attributes, we compare three low polarization linking strategies to improve the network uniformity: D_LPLS, B_LPLS and C_LPLS. Related concepts are defined as follows[23]:
Definition 3 The degree of all nodes in the multimodal transport network are k={kA1,…,kB1,…,kC1,…}, the corresponding pole number in the network is π=(kmax-〈k〉)/(〈k〉), where π represents the degree of polarization based on the overall degree distribution of nodes in the network, kmax is the maximum degree of nodes in the network, 〈k〉 is the average degree of nodes in the network, and the smaller the π, the more uniform the distribution of the entire network.
Definition 4 The betweenness of all nodes in the multimodal transport network is b={bA1,…,bB1,…,bC1,…}, and bi= , where δs,t(i)represents the number of paths through node i between node s and node t, and δs,t represents the number of paths between node s and node t[24]. The corresponding pole number in the network is πb=(bmax-〈b〉)/(〈b〉). It is similar to Definition 1, the smaller the πb, the more uniform the network.
Definition 5 The closeness of all nodes in the multimodal transport network are c={cA1,…,cB1,…,cC1,…}, and ci= Among them, NG is the total number of nodes in the network, and d(i,j)represents the distance between node i and node j in the network[25]. The corresponding pole number in the network is πc=(cmax-〈c〉)/(〈c〉), and it is similar to Definition 1. The smaller the πc, the more uniform the network.
In this paper, the algorithms of three low polarization linking strategies are designed. We take D_LPLS as an example to present the process of the algorithm.
1)Determine the number of the nodes N in the transport network and number them from 1 to N. Meanwhile, determine the serial numbers of highway NHS to NHE, and NHS>1.
2)Determine the degree of all nodes ki, and the nodal degree matrix k.
3)Calculate the pole number based on degree πk.
4)Let i=1, j=2, πmin=πk, E={0,0}.
5)Connect node i and node j so that ki=ki+1,kj=kj+1,and the updated nodal degree matrix is kij.
6)Calculate the updated pole number based on degree πkij.
7)If πkij<πk, then πmin=πkij, E={i,j} and turn to step 8).
8)j=j+1.
9)If j>N, then i=i+1 and turn to step 10), else turn to step 5).
10)If i>N-1, then turn to step 12), else turn to step 11).
11)If i∈[NHS,NHE], then i=i+1 and turn to step 10), else turn to step 5).
12)Output πmin, E.
The obtained links can be added to the original network, and according to the increased number of links, the required results can be obtained by setting the number of cycles.
4 Case StudyWe take the multimodal transport network consisting of chain-type subnetworks as the research body, which is the most common network in western China. This paper selects the multimodal transport network in the Sichuan-Tibet region, which is composed of three subnetworks: The Sichuan-Tibet railway, Sichuan-Tibet highway, and aviation. The pivot point of each transport mode is the node in the network. A multimodal transport network with 71 nodes and 98 links is formed. The network structure is shown in Fig.3.
A1 to A43 represent the nodes in the highway network; B1 to B23 represent the nodes in the railway network; C1 to C5 represent the nodes in the aviation network. In this paper, MATLAB and Origin software are used to determine the values of different parameters. Then, the changes of the proportion of connected nodes under different
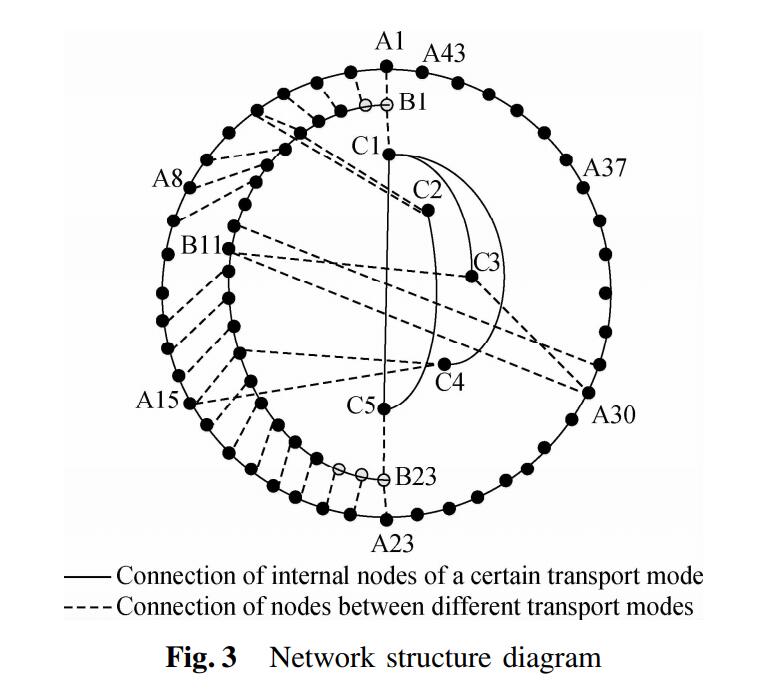
Fig.3 Network structure diagram
attack modes and different linking strategies are analyzed to prove the effectiveness of the strategy. The attack modes include random attacks and intentional attacks. A random attack refers to randomly selecting a certain proportion of nodes in the network for failure processing. For example, when the network is attacked by natural disasters, such as earthquakes, floods, mudslides, etc., the occurrence of natural disasters and the destruction of nodes are random and such attacks are random attacks. An intentional attack refers to selecting nodes with a large degree of nodes in the network for failure processing. For example, when the network is artificially damaged, the node with the highest degree is the most intuitively important one, and attacking the node with the highest degree can make the network have a greater impact.
4.1 Parameter determinationIn the multimodal transport network, the maximum load redundancy of nodes is less than or equal to 0.5,that is 0≤β≤0.5,and the value of θ is usually distributed from 0.5 to 2.0[15]. Therefore, when β=0.3,θ={0.5,1.0,1.5,2.0,2.5} and θ=1.0,β={0.1,0.2,0.3,0.4,0.5}, respectively, the impact of random attack mode on the proportion of connected network nodes can be calculated as shown in Fig.4.
The overall trend of Fig.4(a)and Fig.4(b)are consistent. The changes of parameters will affect the reduction speed of G, but they will not change the reduction of G. It can be seen from Fig.4(a)that the greater the value of the tolerance factor β, the higher the proportion of attacked nodes that can be dealt with, the slower the network crash rate, the more stable the network. When β=0.5, the network robustness is relatively optimal. It can be seen from Fig.4(b)that the crash speed of the network is the slowest when the variable parameter θ=1.0, and the reticle of 0.5 and 1.5 almost coincides. When the value exceeds 1.0, the robustness of the network decreases with the increase in θ. Therefore, in the following, β=0.5,θ=1.0.
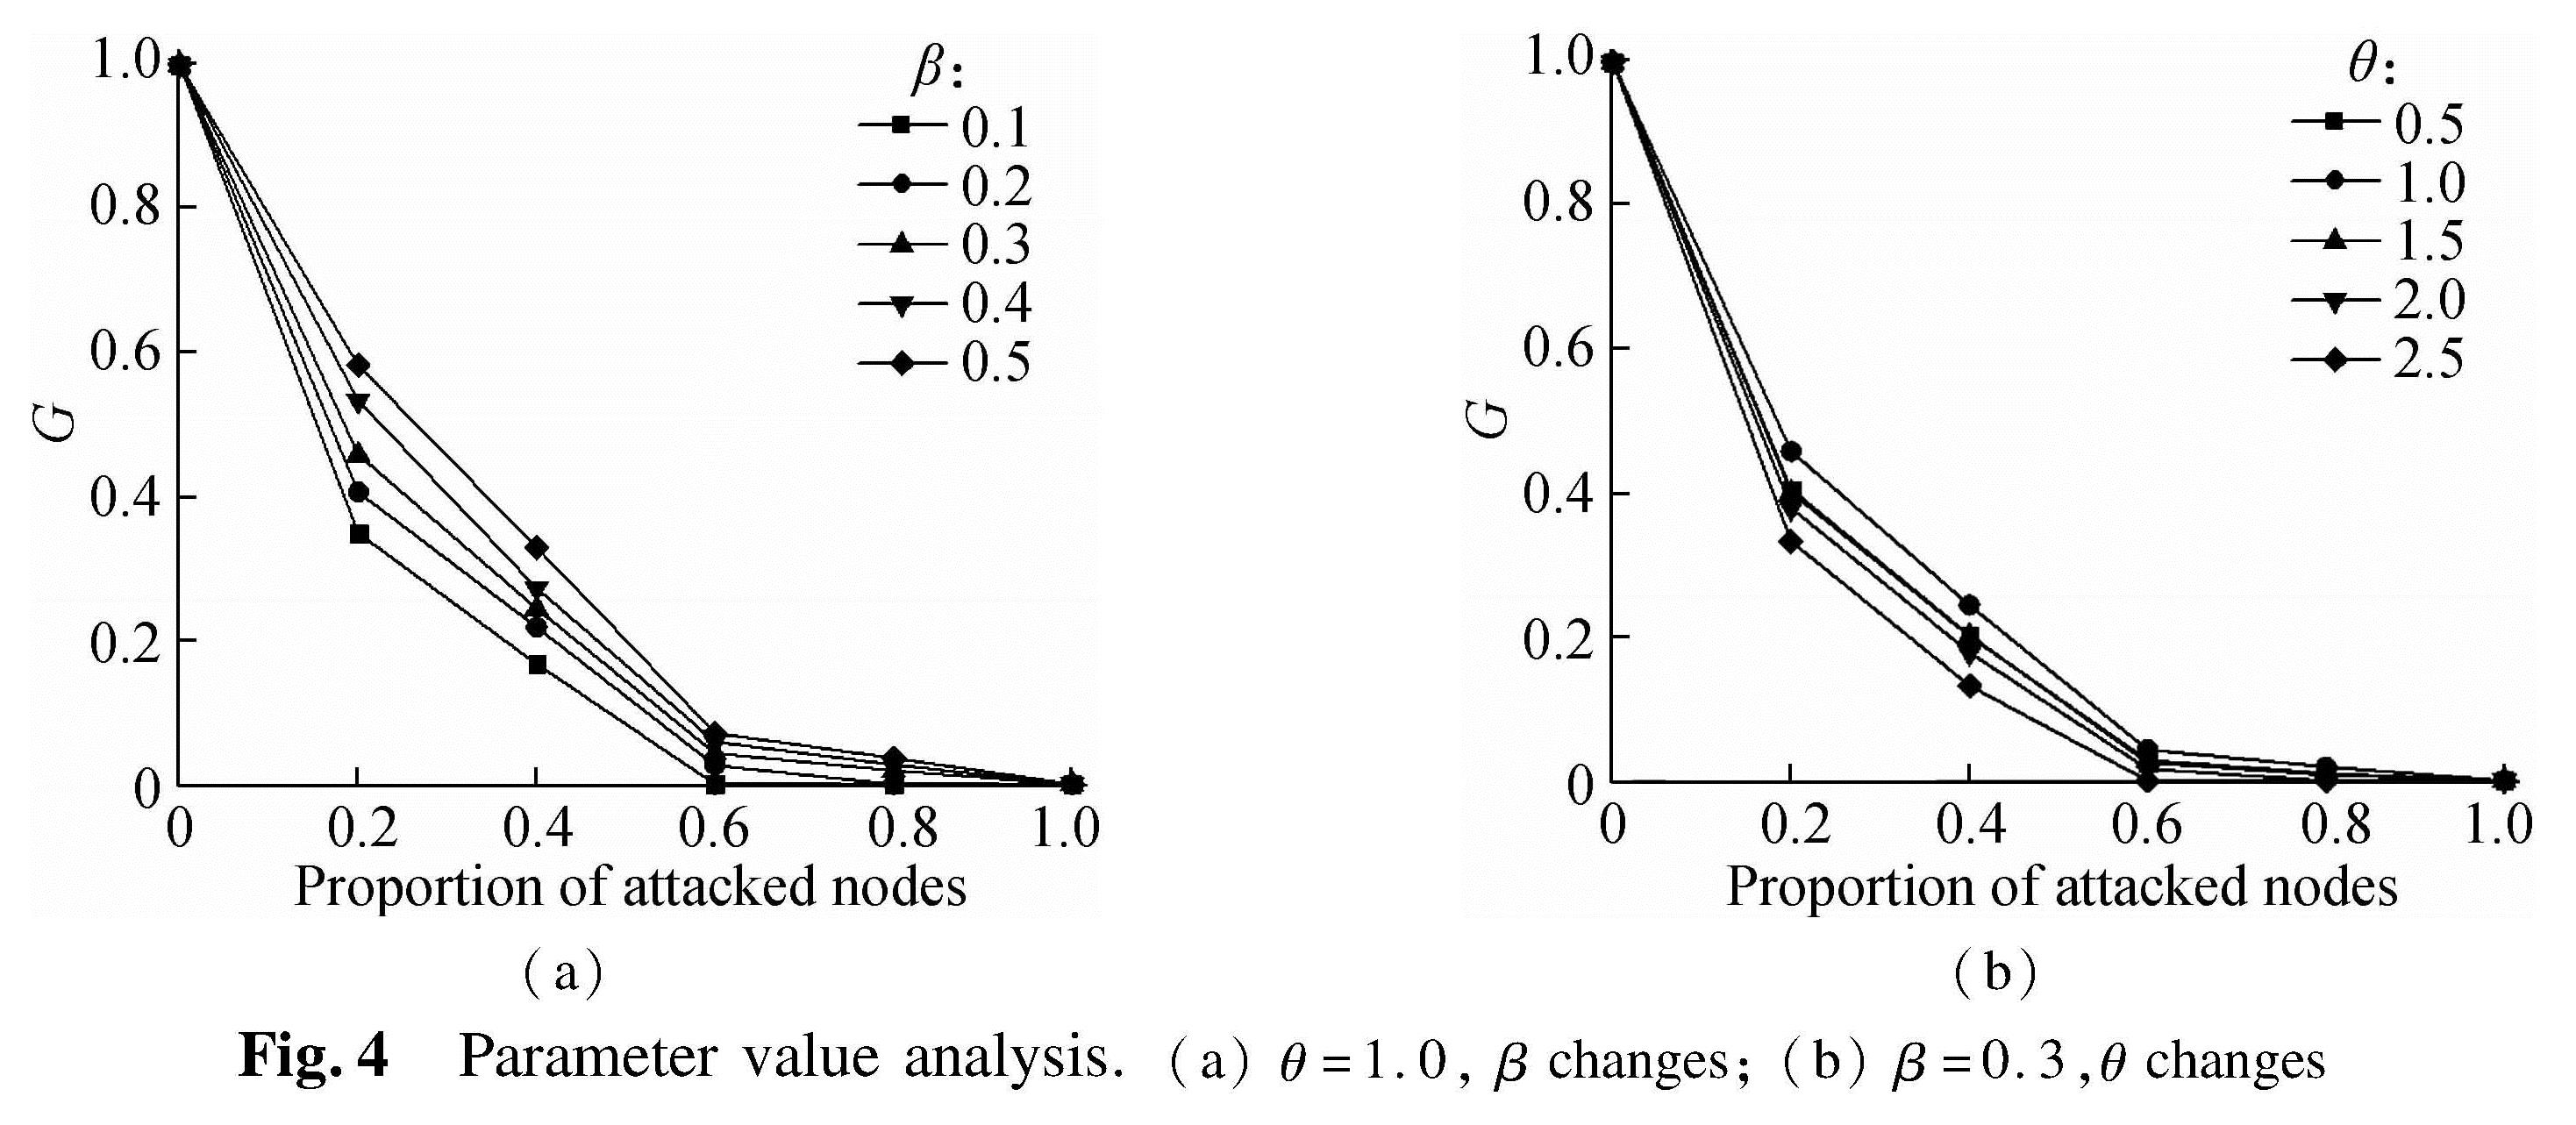
Fig.4 Parameter value analysis.(a)θ=1.0,βchanges;(b)β=0.3,θchange
4.2 Effect comparison of different linking strategies
In fact, when the network is under attack, the connectivity of the network depends on the robustness of the entire network rather than a certain subnetwork. Therefore, we consider the multimodal transport network as a whole, with the goal of minimizing the number of poles in the network, and the optimal links are increased in turn. Considering that it is difficult to achieve a large-scale increase of links in actual networks, we set the ratios of the increased links to be 5%, 10%, 15%, 20%, 25%, and 30%. According to the algorithm in Section 3.2, the optimized networks using different link strategies can be obtained. The effects of cascading failure in multimodal transport are simulated under random attacks and intentional attacks, and compared with RLS, as shown in Fig.5 and Fig.6, respectively.
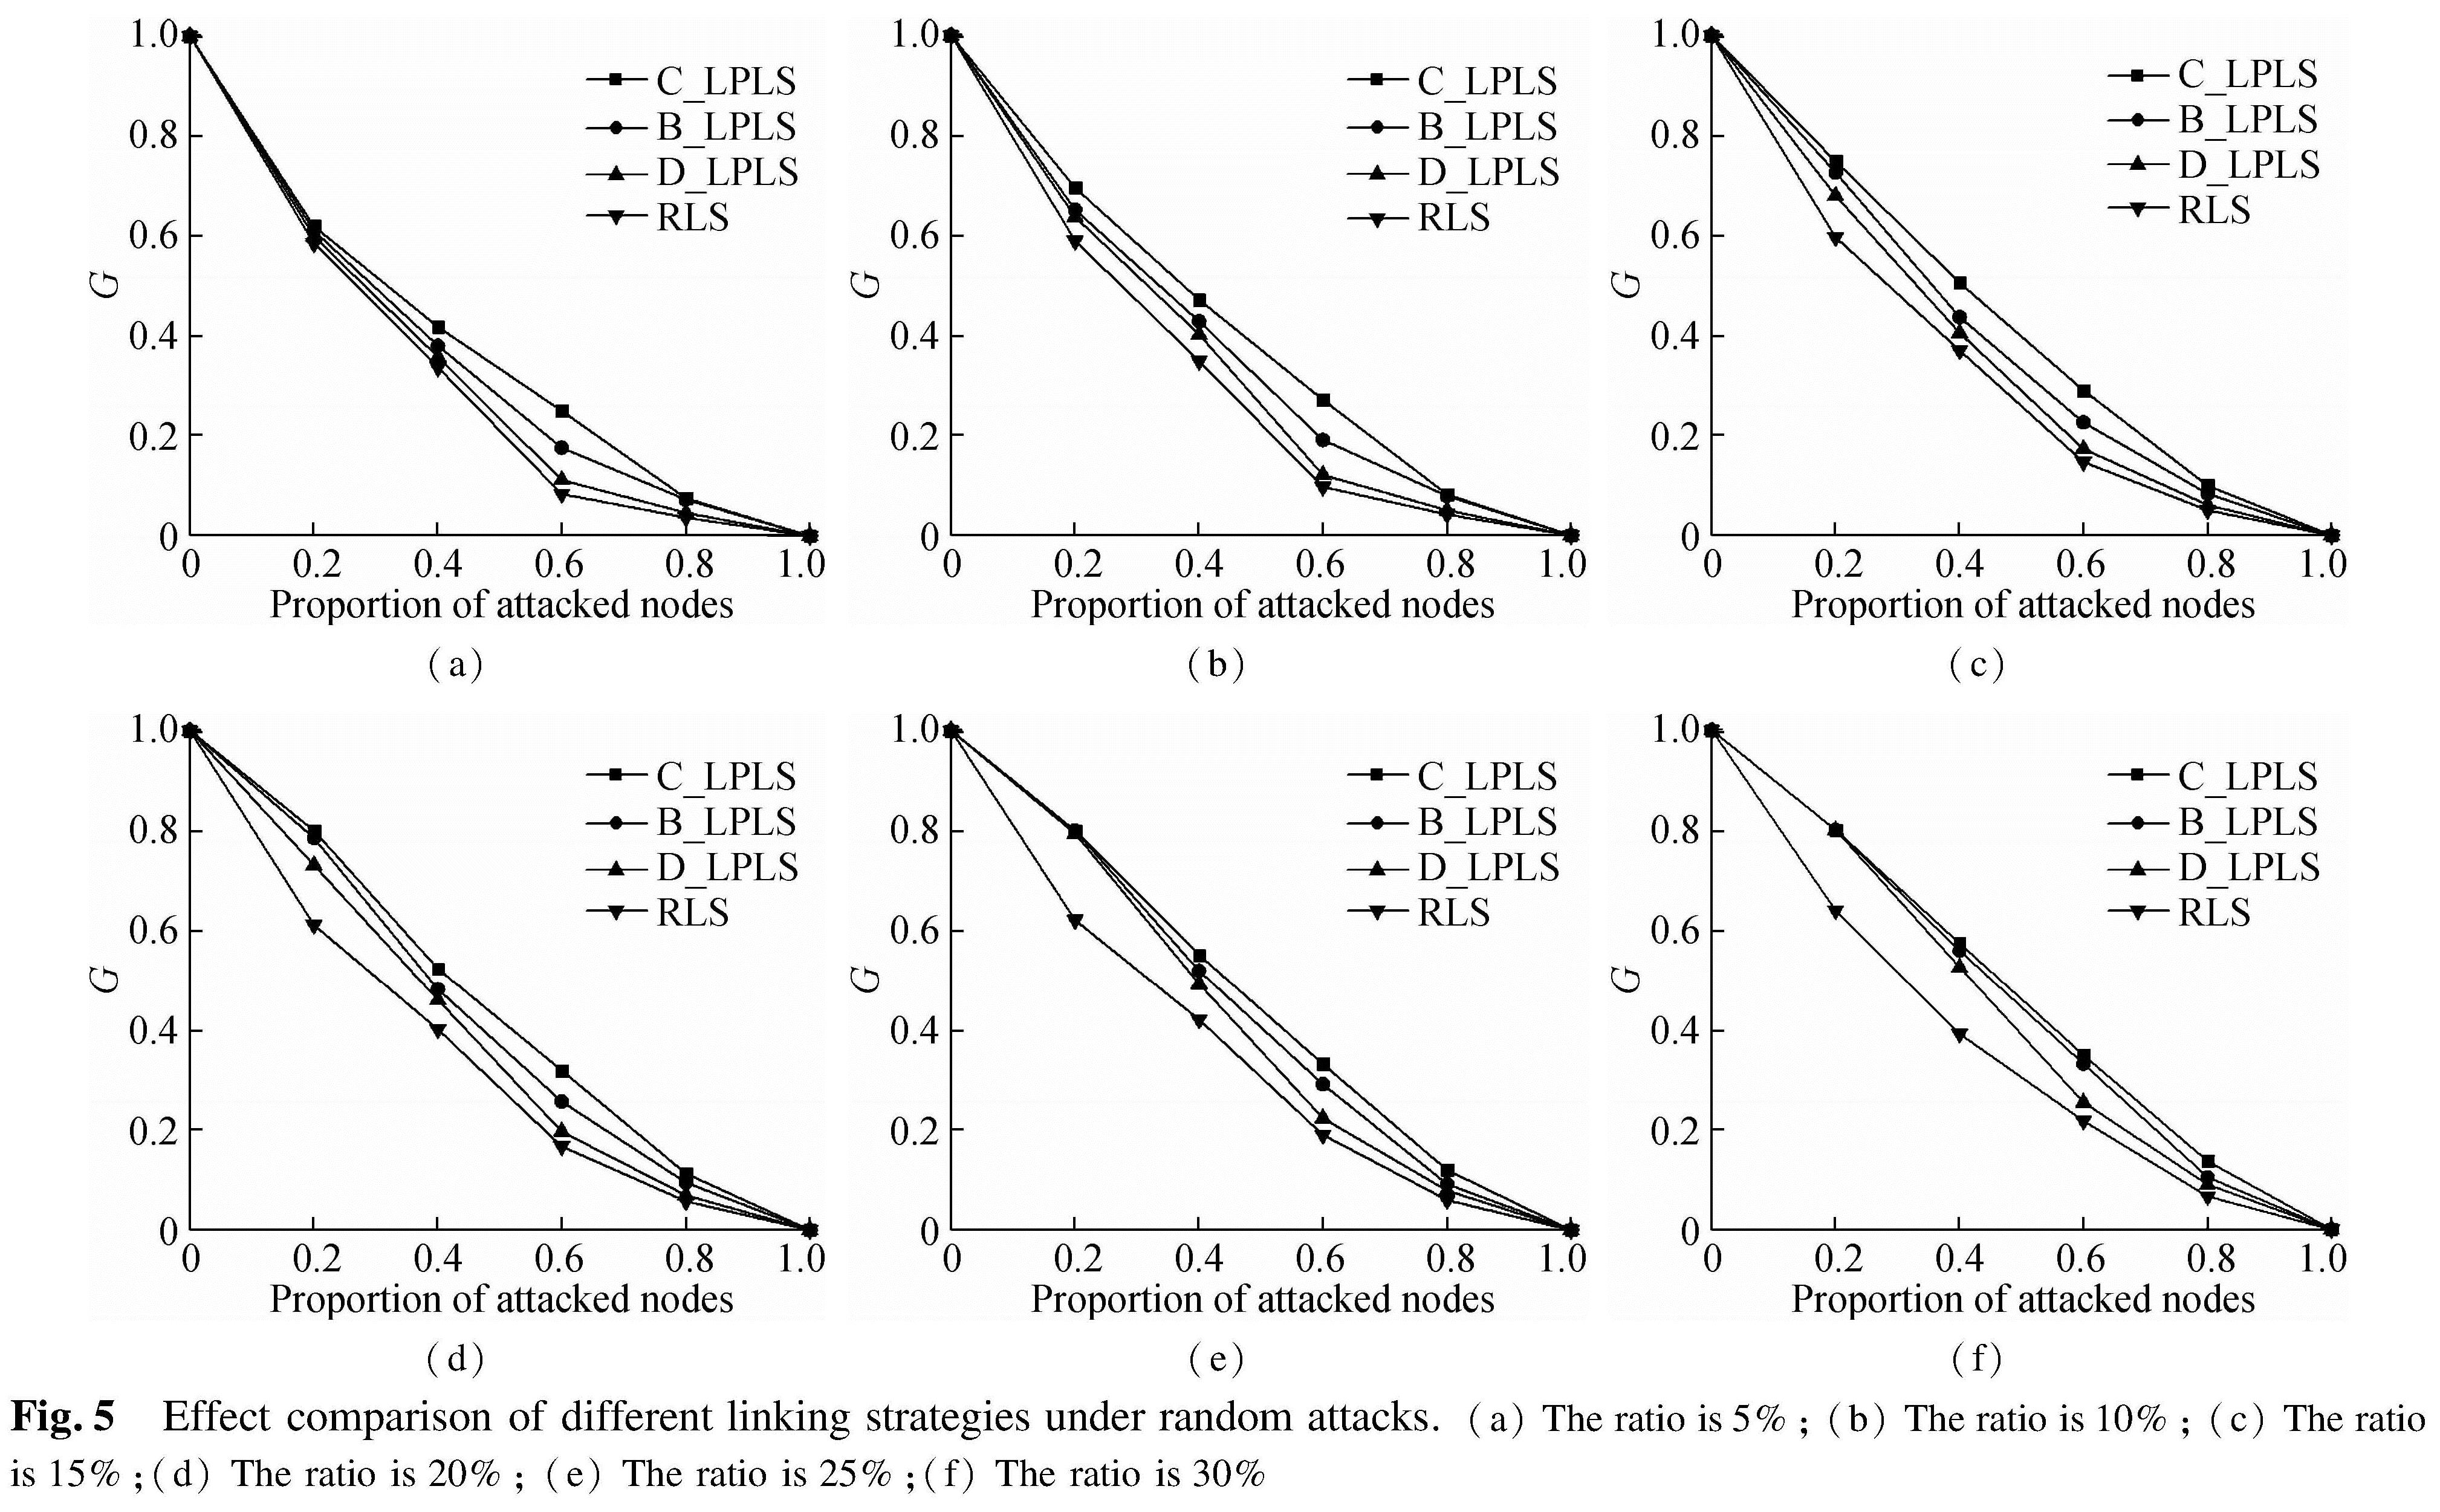
Fig.5 Effect comparison of different linking strategies under random attacks.(a)The ratio is 5%;(b)The ratio is 10%;(c)The ratio is 15%;(d)The ratio is 20%;(e)The ratio is 25%;(f)The ratio is 30%
In the random attack mode, from the view point of the changes of the ratio of attacked nodes, when the ratio is less than 1, different linking strategies have various positive effects on the connectivity of the network. The effects of linking strategies are sorted in a descending order:C_LPLS, B_LPLS, D_LPLS, RLS, and the effects of three low polarization strategies are better than that of RLS. Meanwhile, C_LPLS and B_LPLS have obvious advantages over D_LPLS. However, although C_LPLS has the best effect in resisting random attacks, it is surprising that with the rising of the ratio of increased links, the gap between C_LPLS and B_LPLS gradually narrows down. As a whole, we also find that the differences between the four strategies also decrease with the rising of the ratio of increased links, and the reason is that the random attack does less damage to the network. With the rising of the ratio of increased links, the overall robustness of the network is enhanced, which results in a reduction in the differences between the four strategies. In addition, the differences weaken until the network completely collapses with the rising of the ratio of increased links.
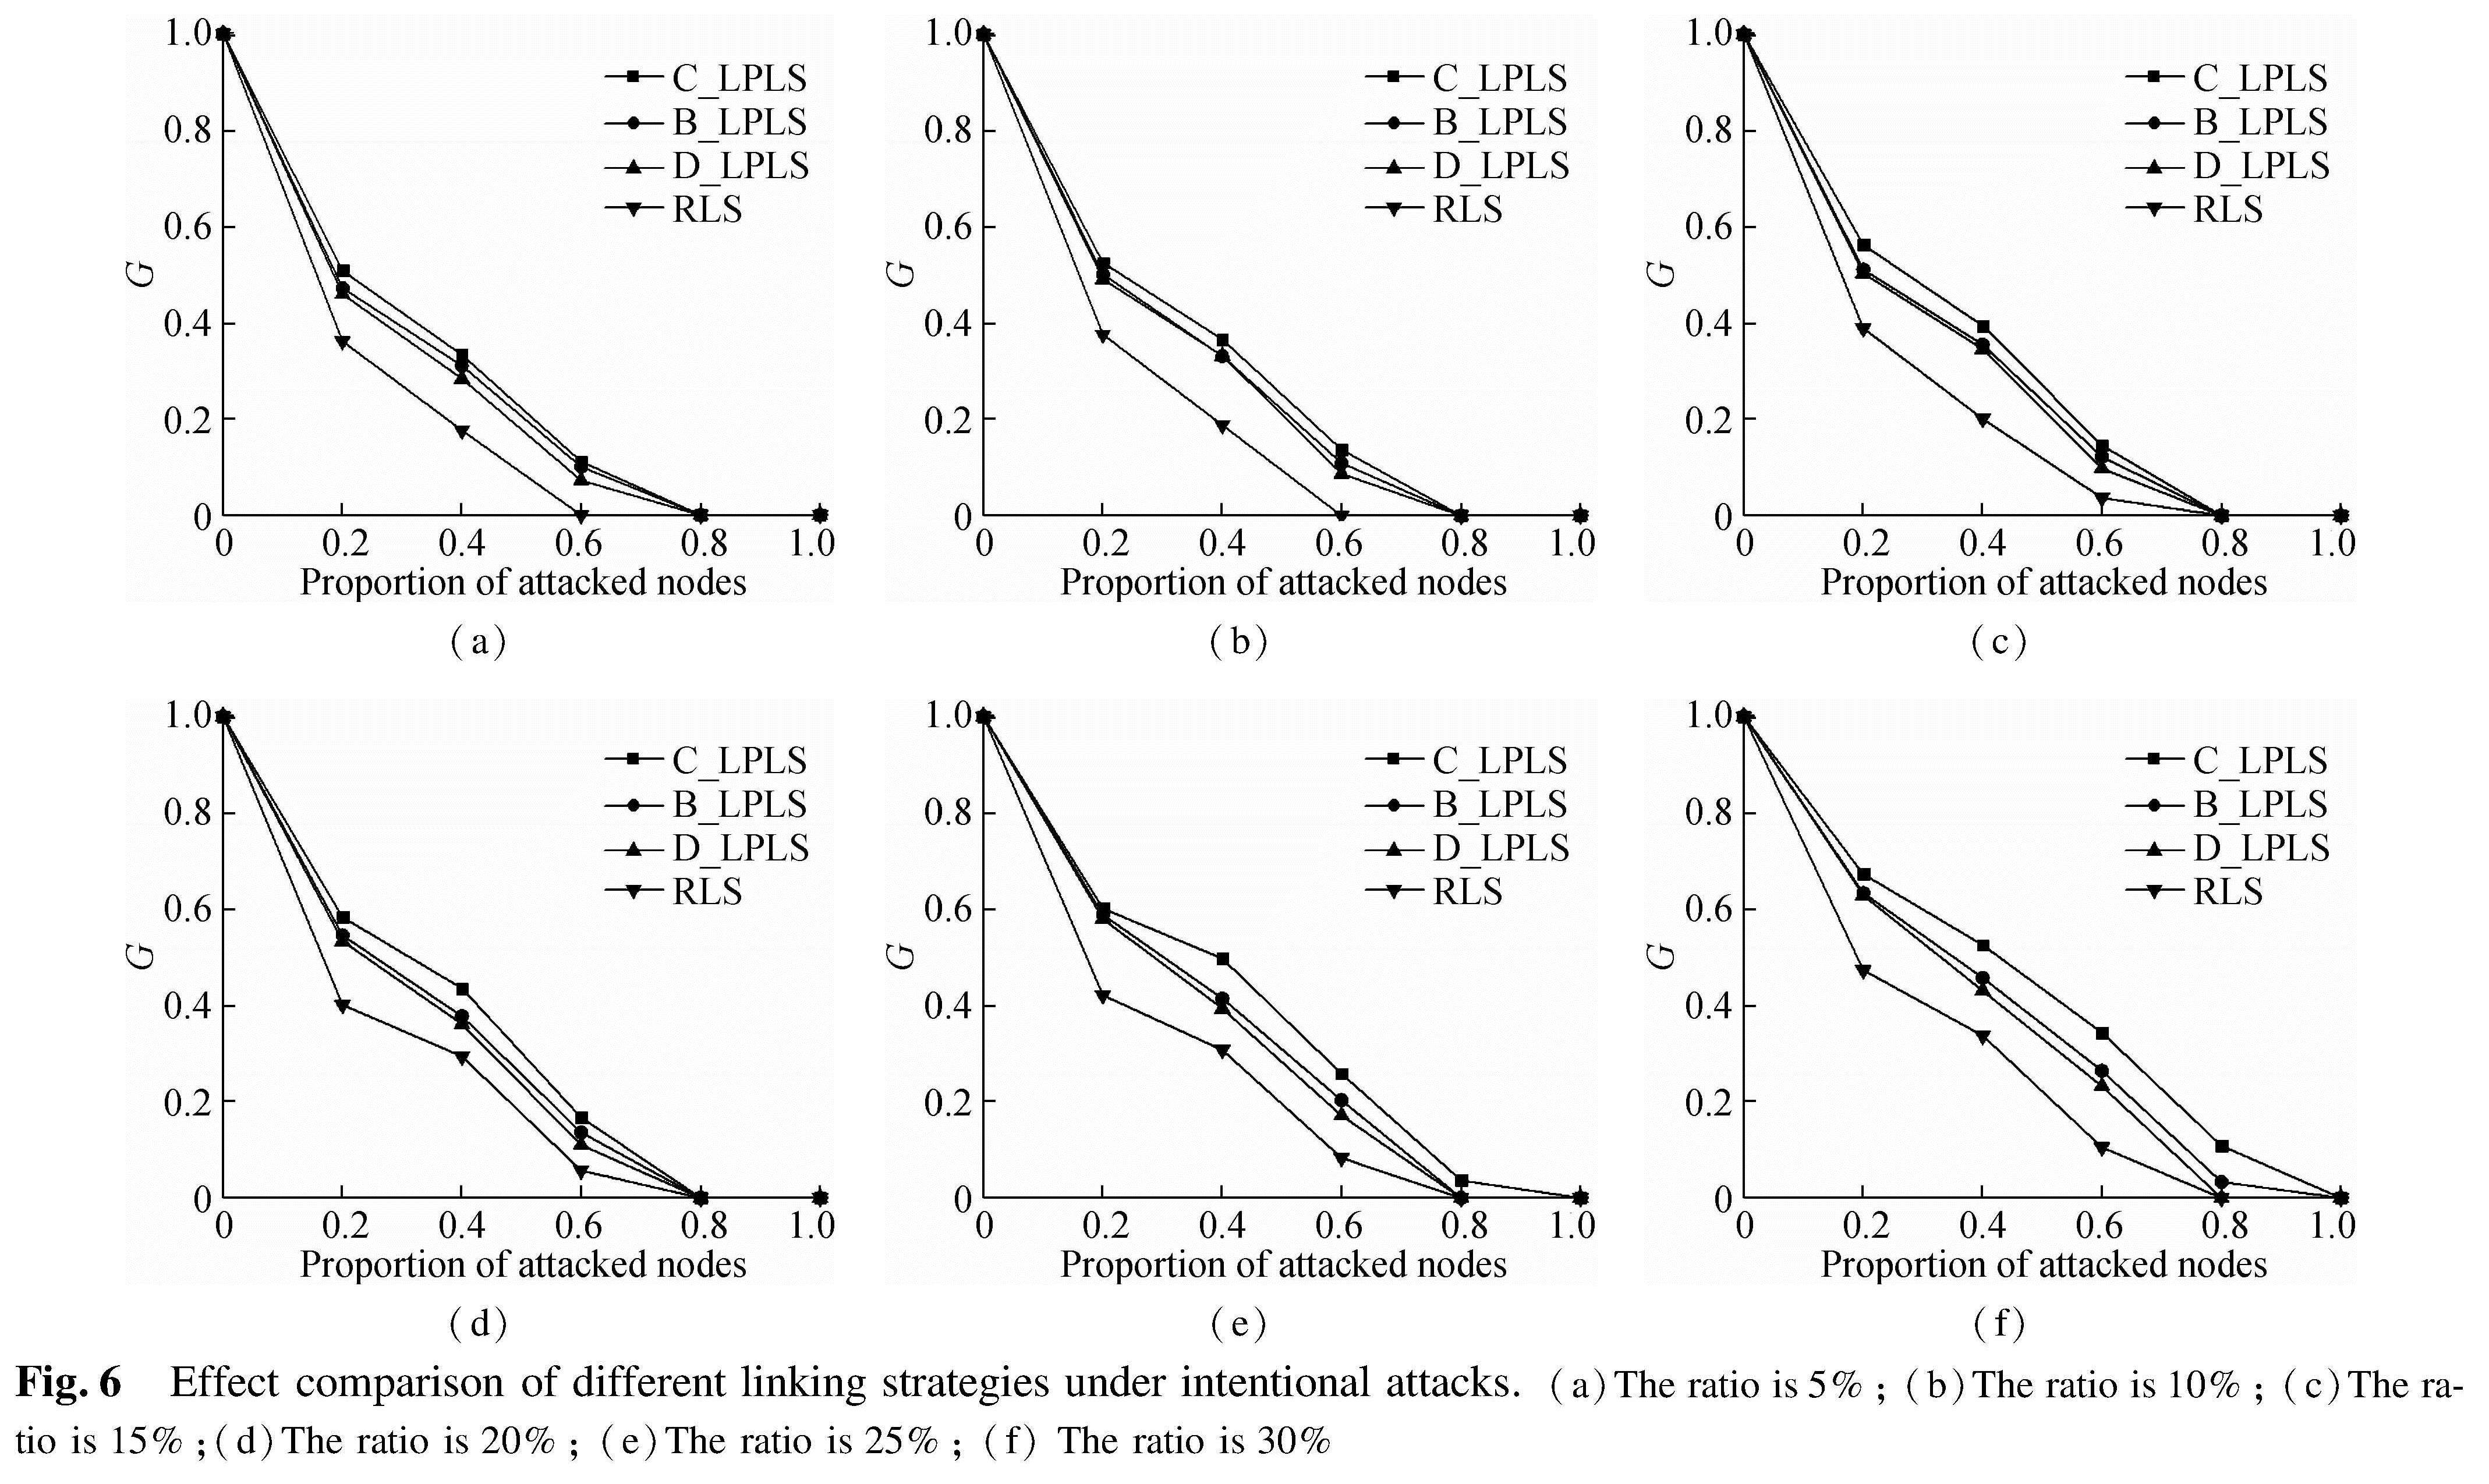
Fig.6 Effect comparison of different linking strategies under intentional attacks.(a)The ratio is 5%;(b)The ratio is 10%;(c)The ratio is 15%;(d)The ratio is 20%;(e)The ratio is 25%;(f)The ratio is 30%
In the intentional attack mode, the connectivity effect of the network is weaker than that of the random attack mode, because intentional attacks can cause more damage to the network than random attacks. With the rising of the ratio of increased links, the connectivity of the network is optimized as a whole. The effects of linking strategies are sorted in descending order:C_LPLS, B_LPLS, D_LPLS, RLS, and it shows that C_LPLS has the best defense effect against intentional attacks. But different from random attacks, with the rising of the ratio of increased links, the differences between the four strategies become more obvious until the network completely crashes. We think this is because the intentional attacks are more disruptive to the network, and the optimization degree of each link to the network robustness needs to be considered, which is called the marginal optimization degree of a link. The marginal optimization degree of a link of C_LPLS is greater than that of other strategies. Under the superposition of many new links, the advantages of C_LPLS become more obvious.
All in all, under different attack modes, the effects of different linking strategies on the network connectivity vary. Under random attacks and intentional attacks, the optimization effect of C_LPLS on network connectivity is more obvious.
4.3 The comparison of algorithmsTo verify the feasibility of the proposed algorithm, we compare it with the genetic algorithm, and set the parameters of the genetic algorithm as shown in Tab.2.
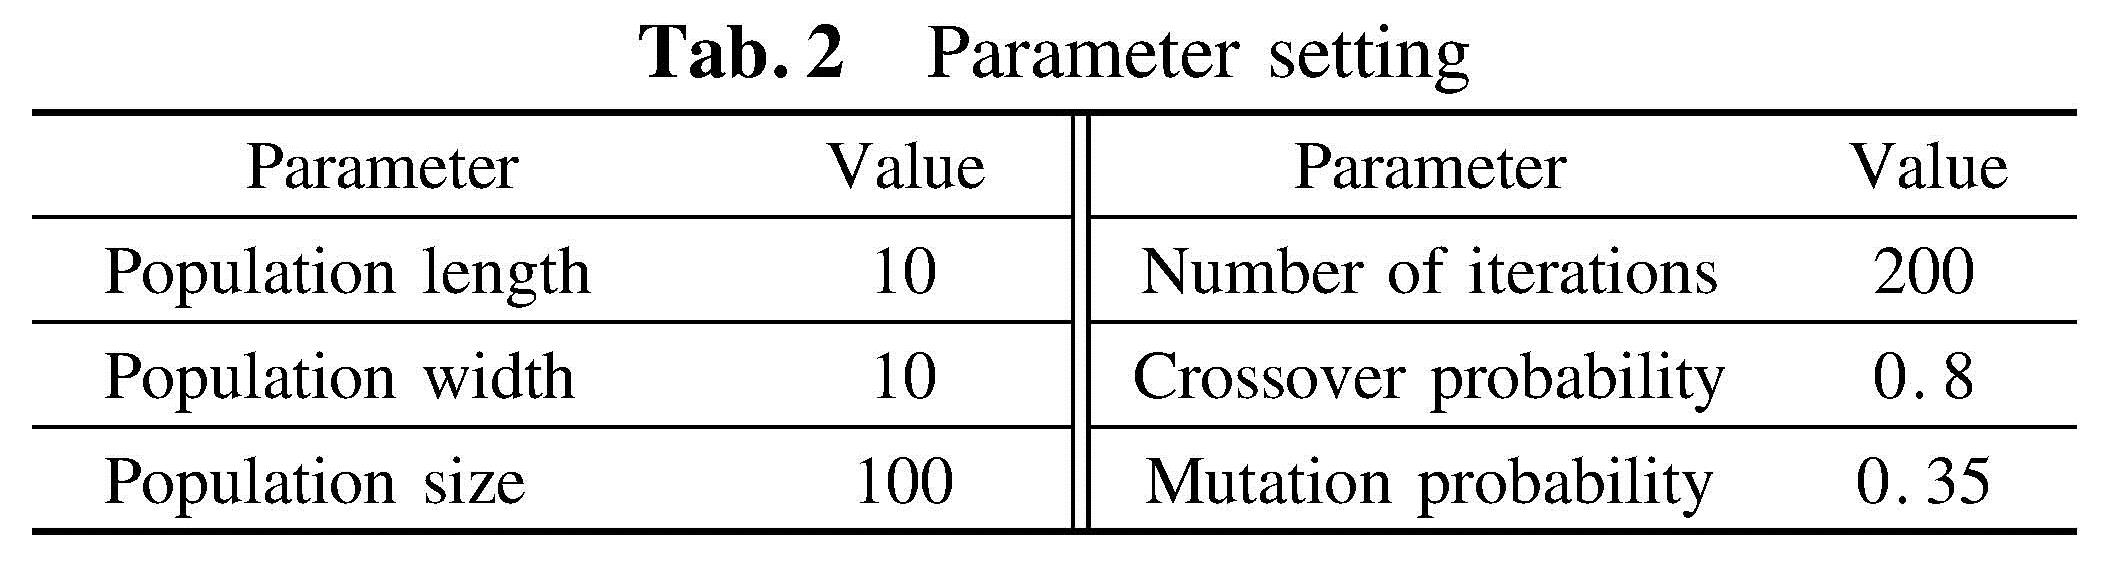
Tab.2 Parameter setting
Parameter Value Parameter ValuePopulation length 10 Number of iterations 200Population width 10 Crossover probability 0.8Population size 100 Mutation probability 0.35
With three linking strategies C_LPLS, B_LPLS and D_LPLS under intentional attacks, the calculation results under different algorithms can be obtained as shown in Fig.7. The ratio of increased links is 20%, and the ratio of attack nodes is 40%, β=0.5,θ=1.0.
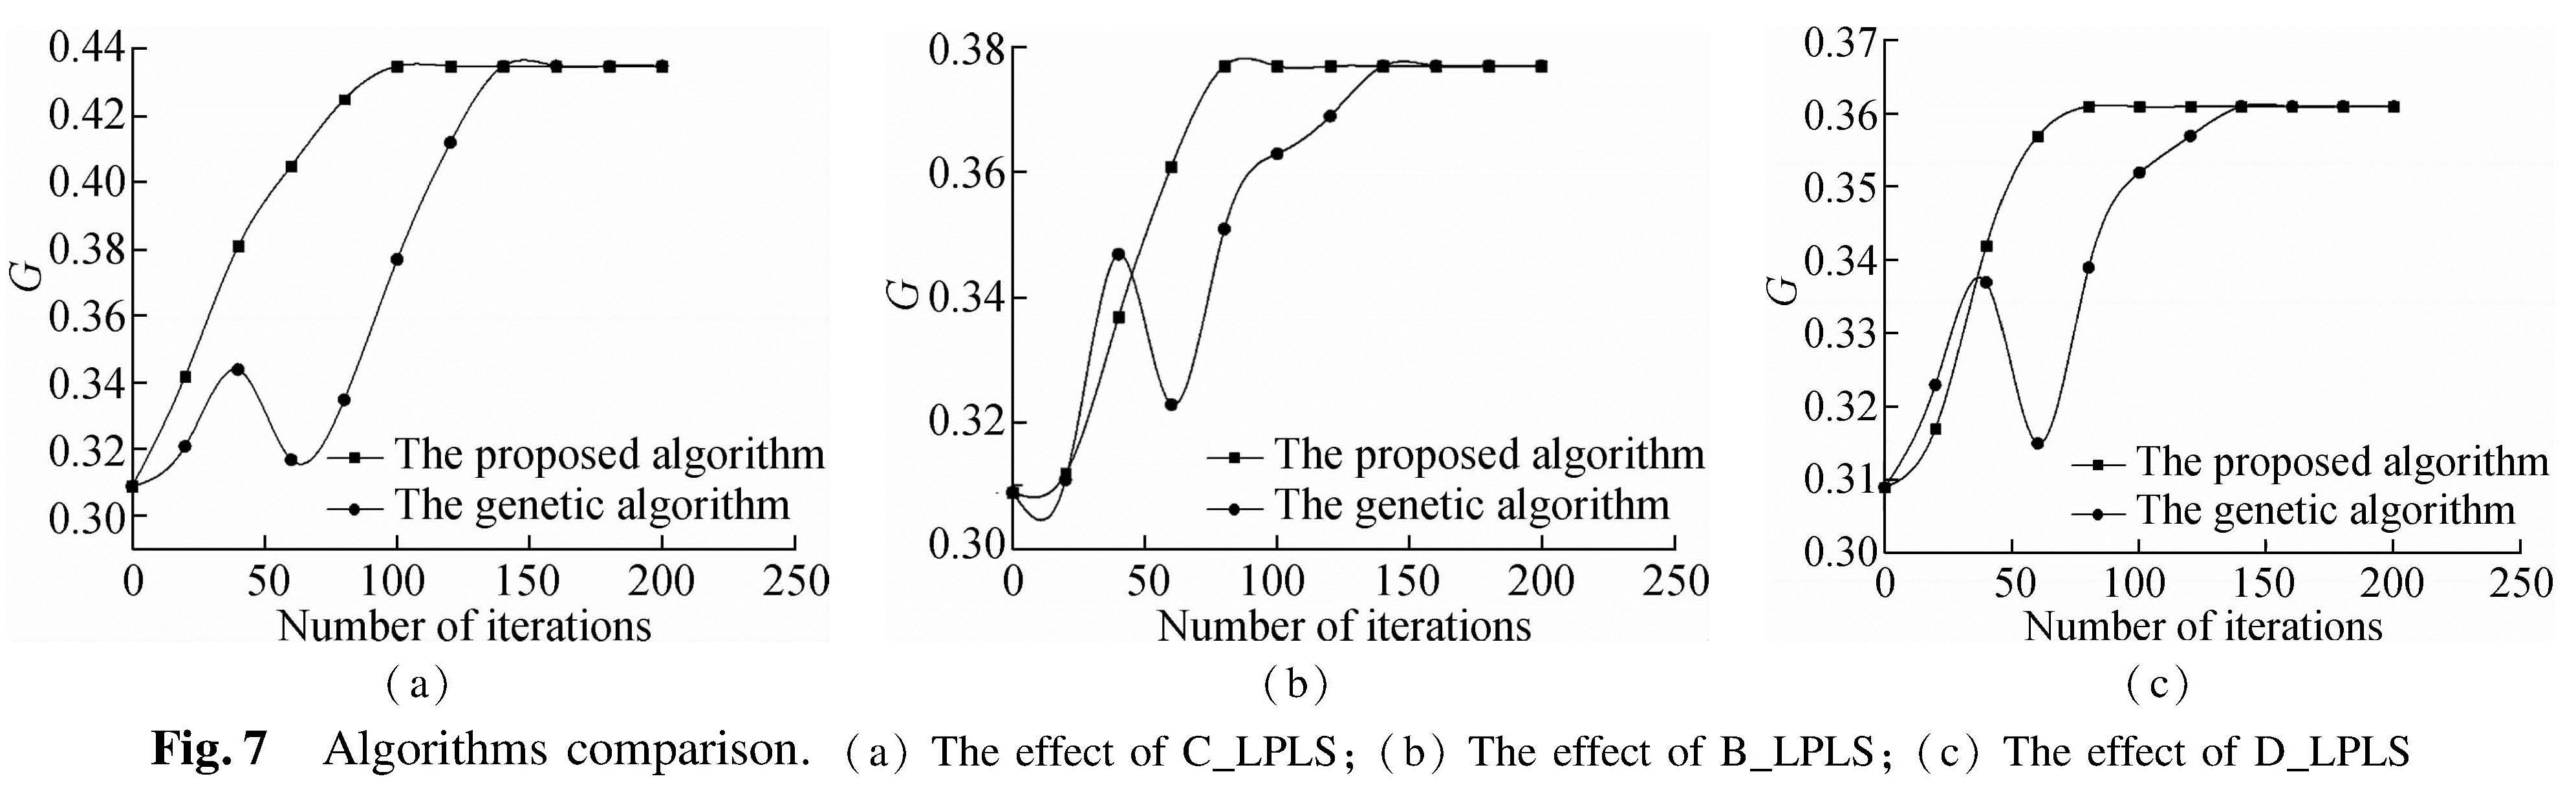
Fig.7 Algorithms comparison.(a)The effect of C_LPLS;(b)The effect of B_LPLS;(c)The effect of D_LPLS
It can be seen from Fig.7 that the final calculated results of the two algorithms are the same. But due to the randomness of the search for the genetic algorithm, the calculated results fluctuate greatly, and the convergence effect is far less than that of the algorithm proposed in this paper. This result is consistent with the three linking strategies, which can prove the effectiveness of the algorithm proposed in this paper.
5 Conclusions1)We take the multimodal transport network composed of chain-type subnetworks as the research subject, and study the linking strategies of the multimodal transport network. Research on linking strategies for the multimodal transport network can contribute to enhancing the robustness of the network.
2)We describe in detail the linking methods in an multimodal network, and propose three linking strategies considering the characteristics of the multimodal network: D_LPLS, C_LPLS and B_LPLS. Taking the Sichuan-Tibet multimodal transport network as an example, the results show that the increase in links by C_LPLS is conducive to the risk control of the network.
3)We will consider the structure optimization strategy of the multimodal transport network under different disturbances, which can provide theoretical support for the optimization of future multimodal transport network structures.
- [1] Xia Y X, Liu N J, Iu H H C. Oscillation and chaos in a deterministic traffic network[J].Chaos, Solitons & Fractals, 2009, 42(3): 1700-1704. DOI:10.1016/j.chaos.2009.03.097.
- [2] Wang J W. Modeling cascading failures in complex networks based on radiate circle[J].Physica A: Statistical Mechanics and Its Applications, 2012, 391(15): 4004-4011. DOI:10.1016/j.physa.2012.02.006.
- [3] Li S D, Li L X, Yang Y X, et al. Revealing the process of edge-based-attack cascading failures[J].Nonlinear Dynamics, 2012, 69(3): 837-845. DOI:10.1007/s11071-011-0308-8.
- [4] Zhang Y P,Fang B P,Deng X C, et al. An improved target immunization strategy[C]//2010 International Conference on Digital Manufacturing & Automation. Changsha, China, 2010:206-209. DOI: 10.1109/ICDMA.2010.168.
- [5] Lazaros K G, Fredrik L, Panos A, et al. Improving immunization strategies[J]. Physical Review E, 2007,75(4 Pt 2): 045104. DOI: 10.1103/PhysRevE.75.045104.
- [6] Yuan J Z, Zhao D Y, Long K P, et al. Improved immunization strategy to reduce energy consumption on nodes traffic[J].Optics Communications, 2017, 389: 314-317. DOI:10.1016/j.optcom.2016.12.045.
- [7] Xia L L, Song Y R, Li C C, et al. Improved targeted immunization strategies based on two rounds of selection[J].Physica A: Statistical Mechanics and Its Applications, 2018, 496: 540-547. DOI:10.1016/j.physa.2017.12.017.
- [8] Huang W, Chow T W S. Effective strategy of adding nodes and links for maximizing the traffic capacity of scale-free network[J].Chaos(Woodbury, N.Y.), 2010, 20(3): 033123. DOI:10.1063/1.3490745.
- [9] Gross T, D'Lima C J D, Blasius B. Epidemic dynamics on an adaptive network[J].Physical Review Letters, 2006, 96(20): 208701. DOI:10.1103/PhysRevLett.96.208701.
- [10] Dangerfield C E, Ross J V, Keeling M J. Integrating stochasticity and network structure into an epidemic model[J].Journal of the Royal Society, Interface, 2009, 6(38): 761-774. DOI:10.1098/rsif.2008.0410.
- [11] Liu D C, Ji X P, Wang B, et al. Analysis and countermeasures of topology vulnerability of power communication network based on complex network theory[J]. Power System Technology, 2015,39(12):3615-3621. DOI: 10.13335/j.1000-3673.pst.2015.12.042.(in Chinese)
- [12] Zhang Y, Xiao X Y, Li C S. Vulnerability analysis and improvement strategy of power-information coupling network considering information physical interaction[J]. Power System Technology, 2018,42(10):3136-3147. DOI: 10.13335/j.1000-3673.pst.2017.2602.(in Chinese)
- [13] Jiang Z Y, Liang M G, An W J. Effects of efficient edge rewiring strategies on network transport efficiency[J].Physica A: Statistical Mechanics and Its Applications, 2014, 394: 379-385. DOI:10.1016/j.physa.2013.09.069.
- [14] Jiang Z Y, Liang M G, Guo D C. Enhancing network performance by edge addition[J].International Journal of Modern Physics C, 2011, 22(11): 1211-1226. DOI:10.1142/s0129183111016841.
- [15] Cao X B, Hong C, Du W B, et al. Improving the network robustness against cascading failures by adding links[J].Chaos Solitons & Fractals, 2013, 57: 35-40. DOI:10.1016/j.chaos.2013.08.007.
- [16] Chen S M, Pang S P, Zou X Q. An LCOR model for suppressing cascading failure in weighted complex networks[J].Chinese Physics B, 2013, 22(5): 058901. DOI:10.1088/1674-1056/22/5/058901.
- [17] Hu Y Q, Ksherim B, Cohen R, et al. Percolation in interdependent and interconnected networks: Abrupt change from second- to first-order transitions[J].Physical Review E, 2011, 84(6 Pt 2): 066116. DOI:10.1103/PhysRevE.84.066116.
- [18] Parshani R, Buldyrev S V, Havlin S. Interdependent networks: Reducing the coupling strength leads to a change from a first to second order percolation transition[J].Physical Review Letters, 2010, 105(4): 048701. DOI:10.1103/PhysRevLett.105.048701.
- [19] Zhang T Q, Zhang Y, Zhu X Z, et al. Cascading failures on interdependent networks with star dependent links[J].Physica A: Statistical Mechanics and its Applications, 2019, 535: 122222. DOI:10.1016/j.physa.2019.122222.
- [20] Chen S M, Pang S P, Zou X Q, et al. Robustness optimization of load-capacity nonlinear model in weighted network for cascading failure[J].Control and Decision, 2013, 28(7): 1041-1045.(in Chinese)
- [21] Jiang Z Y, Ma J F, Shen Y L, et al. Effects of link-orientation methods on robustness against cascading failures in complex networks[J].Physica A: Statistical Mechanics and its Applications, 2016, 457: 1-7. DOI:10.1016/j.physa.2016.03.107.
- [22] Motter A E, Lai Y C. Cascade-based attacks on complex networks[J].Physical Review E, 2002, 66(6 Pt 2): 065102. DOI:10.1103/PhysRevE.66.065102.
- [23] Guimerá R, Díaz-Guilera A, Vega-Redondo F, et al. Optimal network topologies for local search with congestion[J].Physical Review Letters, 2002, 89(24): 248701. DOI:10.1103/PhysRevLett.89.248701.
- [24] Freeman L C. A set of measures of centrality based on betweenness[J].Sociometry, 1977, 40(1): 35-41. DOI:10.2307/3033543.