Zhou Xinwen,Liu Jianzhong,Zhu Jiang,et al.Shape characterization of sand particles based on digital image processing technology[J].Journal of Southeast University(English Edition) ,2020,36(03):313-321.[doi:10.3969/j.issn.1003-7985.2020.03.009]

为表征砂颗粒形貌,提出了一种评价颗粒形貌的DIP方法.通过分析采集到的砂粒投影图获取颗粒的长、宽和高, 进而计算砂粒轴径比,同时获取颗粒投影的面积与周长来计算砂粒圆形度.将DIP方法和游标卡尺测量结果进行对比,验证所提方法的测量准确性; 通过样本容量试验分析该方法测量结果的统计意义; 利用该方法实际测量各类砂形貌,检验了该方法的可操作性.试验结果表明:DIP方法测量得到的几何体轴径比和圆形度与游标卡尺测量结果相同; DIP方法表征结果受颗粒数目影响,当颗粒数目达到350时测量结果有代表性.实例分析结果表明,DIP方法能够区分各类砂的形貌差异,实现了对颗粒厚度的直接测量,准确表征了砂粒轴径比与圆形度,测量结果具有统计意义,可行性高,适用于砂颗粒形貌的定量表征.
To characterize the shape of sand particles for concrete, a new method is proposed based on digital image processing(known as the DIP method). By analyzing sand particles projection, the length, width and thickness of sand were measured to characterize particle form. The area and perimeter were measured to characterize particle angularity. The results of the DIP method and Vernier caliper were compared to examine the accuracy of the DIP method. The sample size test was conducted to show the statistical significance of shape results measured by the DIP method. The practicality of the DIP method was verified by instance analysis. The results show that aspect ratios and roundness measured by the DIP method are equal to ones by the Vernier caliper. Results by DIP are dependent on the sand particle number, and at least 350 particles should be measured to represent the overall shape property of sand. The results show that the DIP method is able to distinguish the differences in the shape of sand particles. It achieves the direct measurement of sand particle thickness, and the characterization results of sand aspect ratios and roundness are accurate, statistically significant and practical. Therefore, the DIP method is suitable for sand particle shape characterization.
Sand,the raw material of concrete, affects the workability and other properties of concrete. Manufactured sand(MS)as a substitute for river sand(RS)is widely used in civil engineering construction. There are differences between RS and MS in terms of particle shape, gradation and powder content[1-2]. Recent research concentrated on the influences of gradation[3-5] and powder content[6-9] on concrete properties. As for MS particle shape, little literature has reported that particle shape affectes the rheological[10-13] and mechanical properties of concrete[14-16]. However, the particle shape measurement methods ignored an important shape parameter, the flatness of sand particles. Therefore, it is critical to investigate the characterization method for MS shape.
Particle shape characterization is a hot topic in industry. Generally speaking, there are two techniques including digital image processing(DIP)and X-ray computed tomography(X-CT). Firstly, DIP is widely used due to the convenience of images captured by digital camera. Based on the DIP technology, Masad et al.[17-18] made an excellent contribution to aggregate shape characterization by means of the aggregate imaging system(AIMS), which successfully guided materials production in pavement engineering. Due to the reflective light of the particle surface, Chandan et al.[19] obtained the information of grain surface texture by processing high resolution images with wavelet decomposition technology. Masad et al.[20-21] defined the area lost after an erosion-dilation operation as a percentage of its original particle area to describe sand particle shape, but this method required high resolution images and the calculation was sensitive to loop count of erosion-dilation. Brzezicki et al.[22] measured the length, width and height of coarse aggregates by designing a device which can obtain the shadows of particles in two perpendicular directions, and then evaluated the length-width ratio and width-height ratio of coarse particles. Moaveni et al.[23] and Fletcher et al.[24] extracted the outline of particle projection, and the outline was approximated by a polygon, then the sum of angles subtended at each vertex of the polygon was used to describe particle angularity. Zhang et al.[25] defined the perimeter difference between the particle projection outline and its convex outline to describe particle angularity and surface texture. By comparison, it was found that these methods have a limitation on the direct measurement of particle thickness of sand particle, and it is difficult to describe the flat level of the particle due to the unknown of thickness size. Secondly, X-CT is also used in particle shape characterization, since it can reconstruct the three-dimensional solid body of grains. Estephane et al.[26-28] reconstructed the three-dimensional body of particles with X-CT technology and spherical harmonic analysis. The spherical harmonic analysis was applied to store and extract the shape information of aggregates, and aspect ratios and convexity were proposed to describe the particle shape[29-35]. However, X-CT experienced an issue concerning efficiency in shape characterization for sand particles. Since the shape of sand particles is non-uniform, one particle shape cannot represent the overall shape property of sand, and X-CT can only measure several particles which takes hours at each time. Thus, a new method that is suitable for sand particle shape characterization should be studied. This method will help design concrete proportion and understand concrete properties.
In this study, based on the DIP technology, we propose a new method to measure the length, width and thickness of the particles, which describes the elongation and flatness of sand particles. In addition, the area and perimeter of particle projection were measured to describe the angularity of the sand particles. The sample size test was conducted to find the minimum number of sand particles which can represent the overall shape property by the DIP method. Finally, we measured five kinds of sand to examine the practicality of the DIP method in particle shape characterization.
1 Materials and Image Processing1.1 MaterialsFour kinds of manufactured sand(MS1, MS2, MS3 and MS4)and one river sand(RS)were selected as materials(see Fig.1). MS1, MS2 and MS3 are commercially manufactured sand, and they are limestone, tuff and granite, respectively. MS4 is basalt stone crushed by a jaw crusher without shaping. The sand was classified into 1.18-2.36 mm and 2.36-4.75 mm according to the sieve mesh. RS_1.18 represents the RS of 1.18-2.36 mm, and MS1_2.36 represents the MS1 of 2.36-4.75 mm and so on.
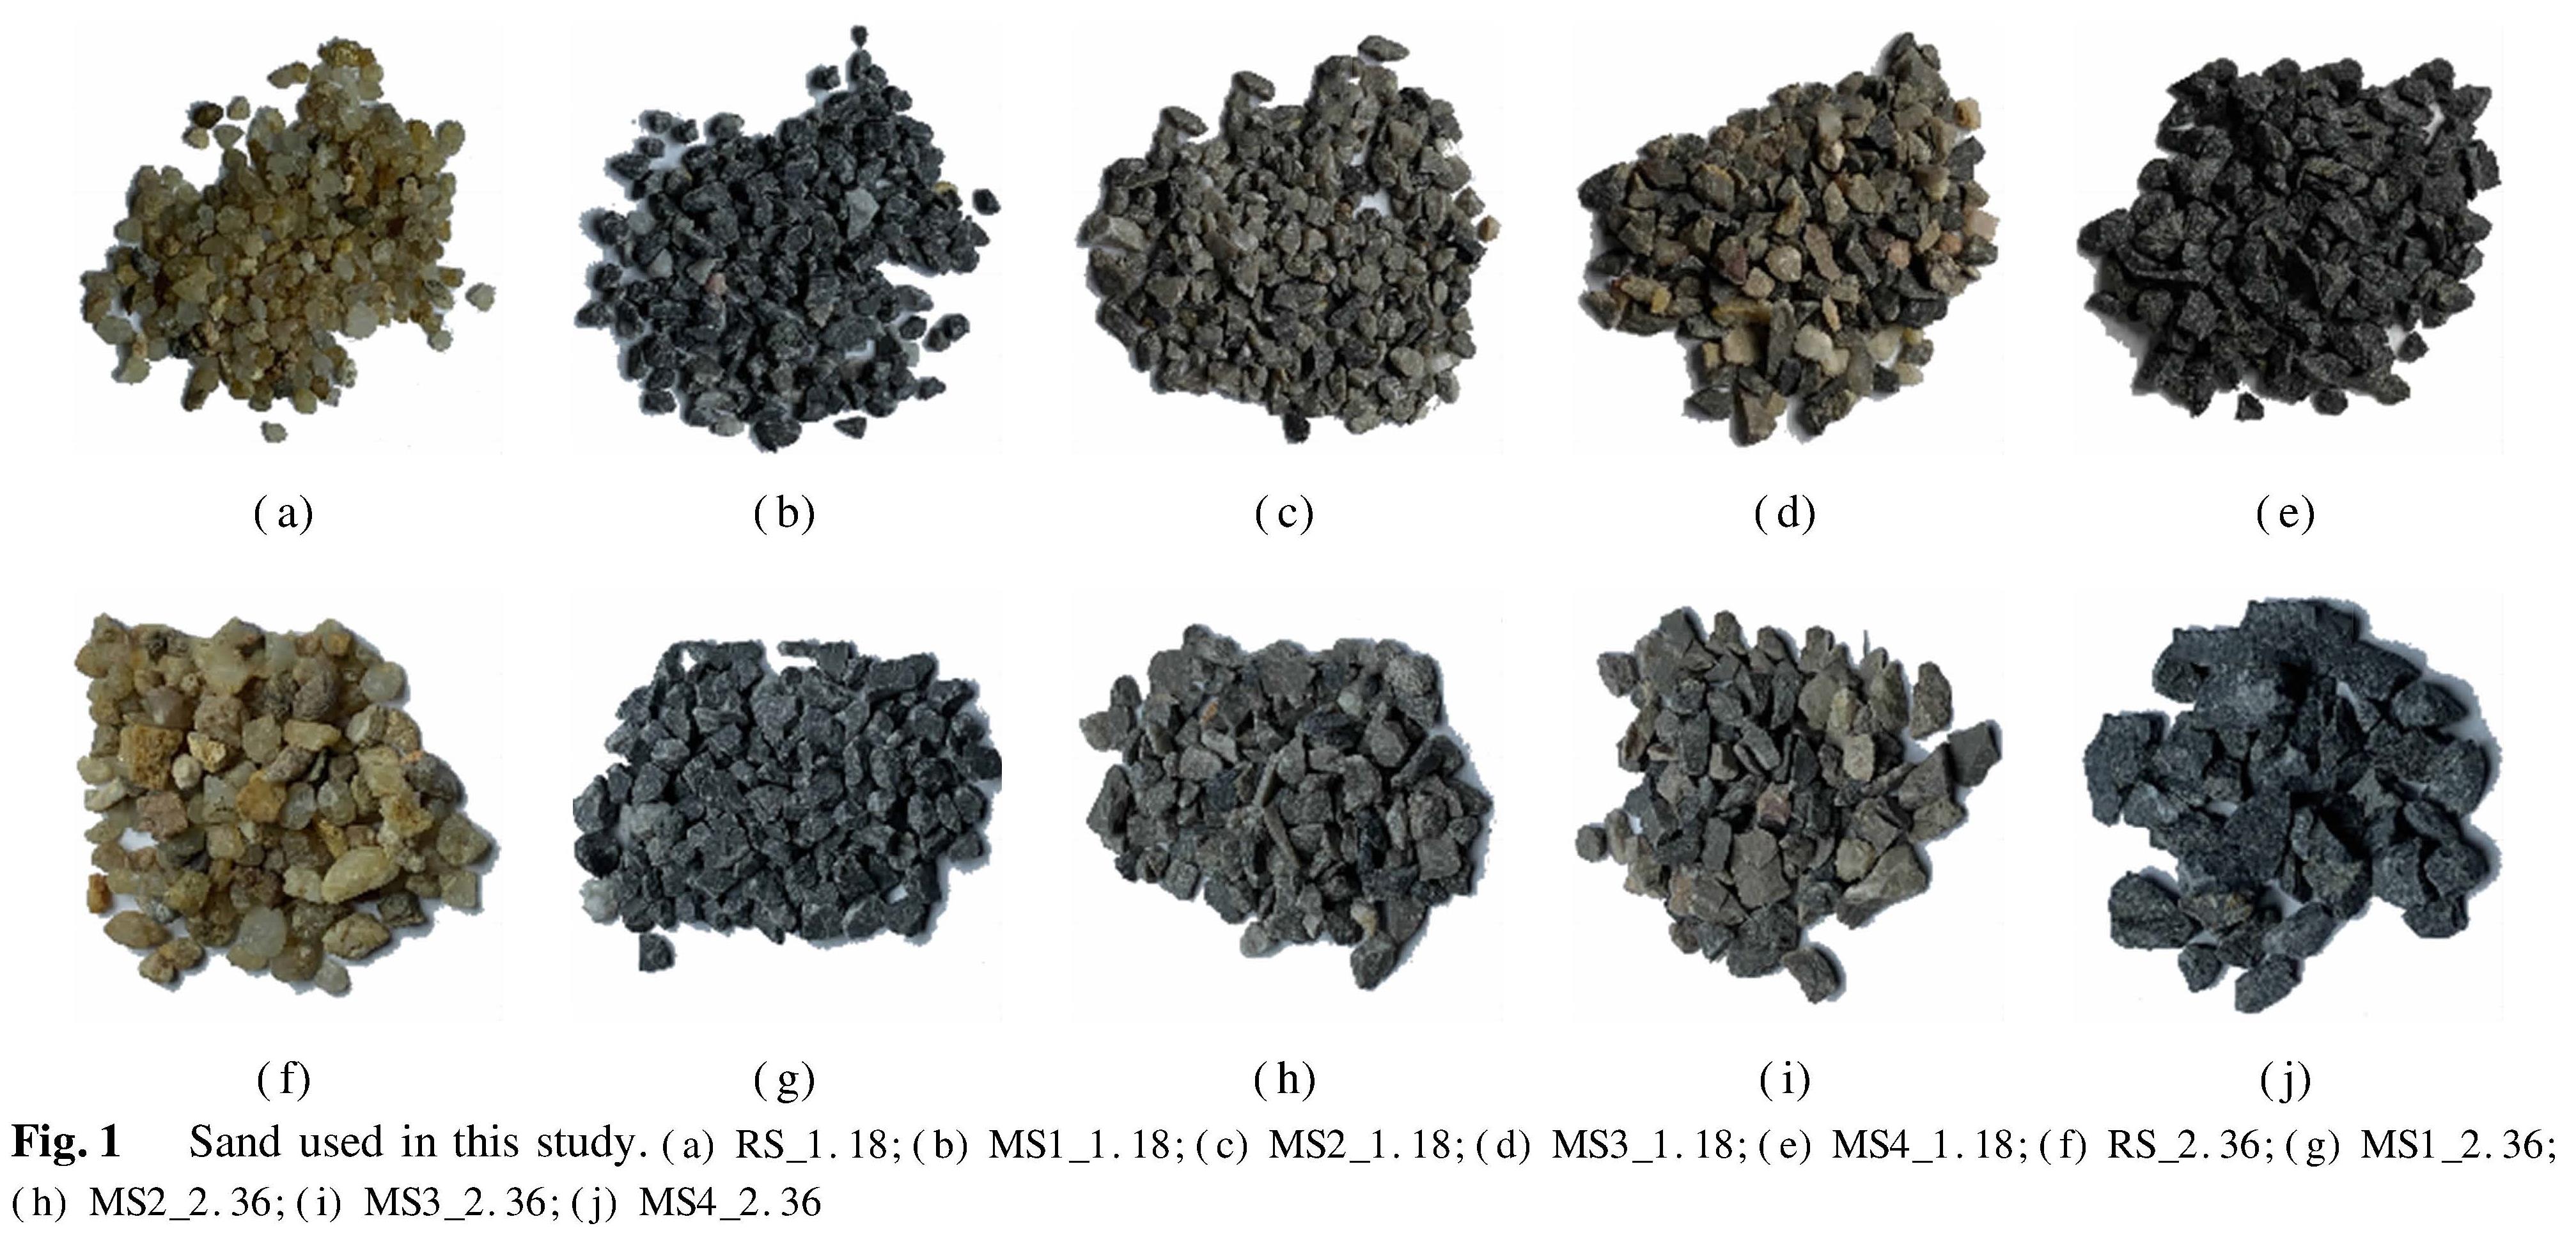
Fig.1 Sand used in this study.(a)RS_1.18;(b)MS1_1.18;(c)MS2_1.18;(d)MS3_1.18;(e)MS4_1.18;(f)RS_2.36;(g)MS1_2.36;(h)MS2_2.36;(i)MS3_2.36;(j)MS4_2.36
1.2 Image processing
The process of the DIP method is shown in Fig.2. At the beginning, image segmenting was conducted to extract the object from the image. Then, object labeling was carried out to realize the measurement of multi-particle shapes at one time. After that, the nominal length and width were calculated by the top view image, and the nominal thickness was calculated by the front view image. Moreover, the area and perimeter of particle projection were measured by the top view image. Finally, the elongation and flatness were calculated based on length, width and thickness measurements, and roundness was calculated based on area and perimeter measurements.
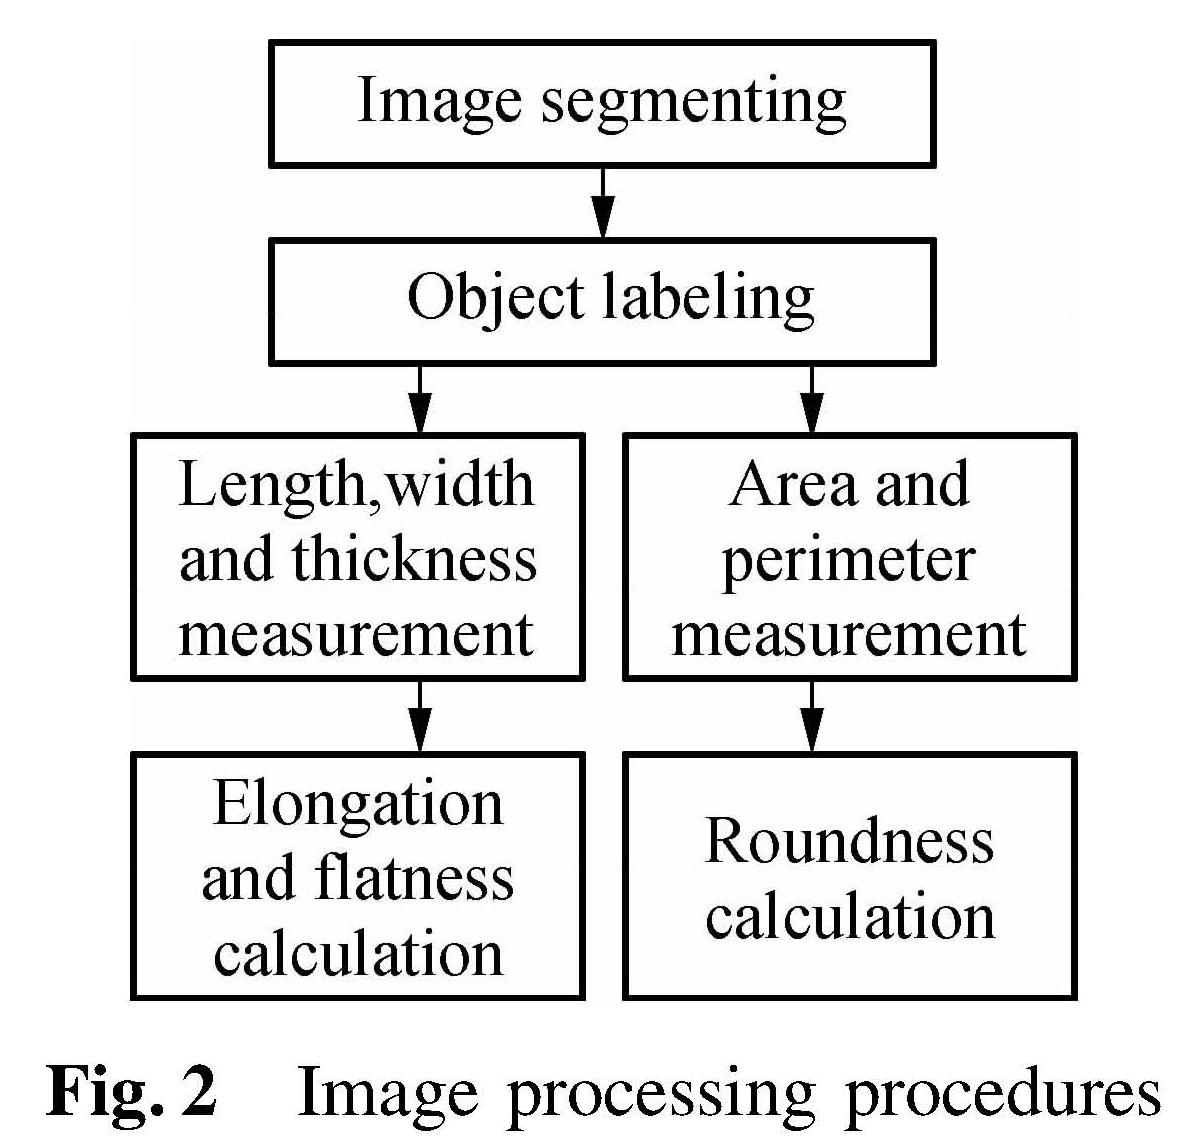
Fig.2 Image processing procedures
1.2.1 Definitions of form and angularity
Form is the first-order property which reflects the variations in the proportions of sand particles. Thus, aspect ratios are common indicators of the particle form. A particle is surrounded by a bounding cuboid, and the length, and width and thickness of the particle are illustrated in Fig.3. Note that the descending order is L>W>T. Aspect ratios are characterized by flatness ratio F and elongation ratio E, which are defined as
E=(L)/(W)(1)
F=(W)/(T)(2)
where L, W and T are the length, width and thickness of the particle, respectively. According to the definitions, F describes how flat the particle is, and E describes how long and narrow the particle is.
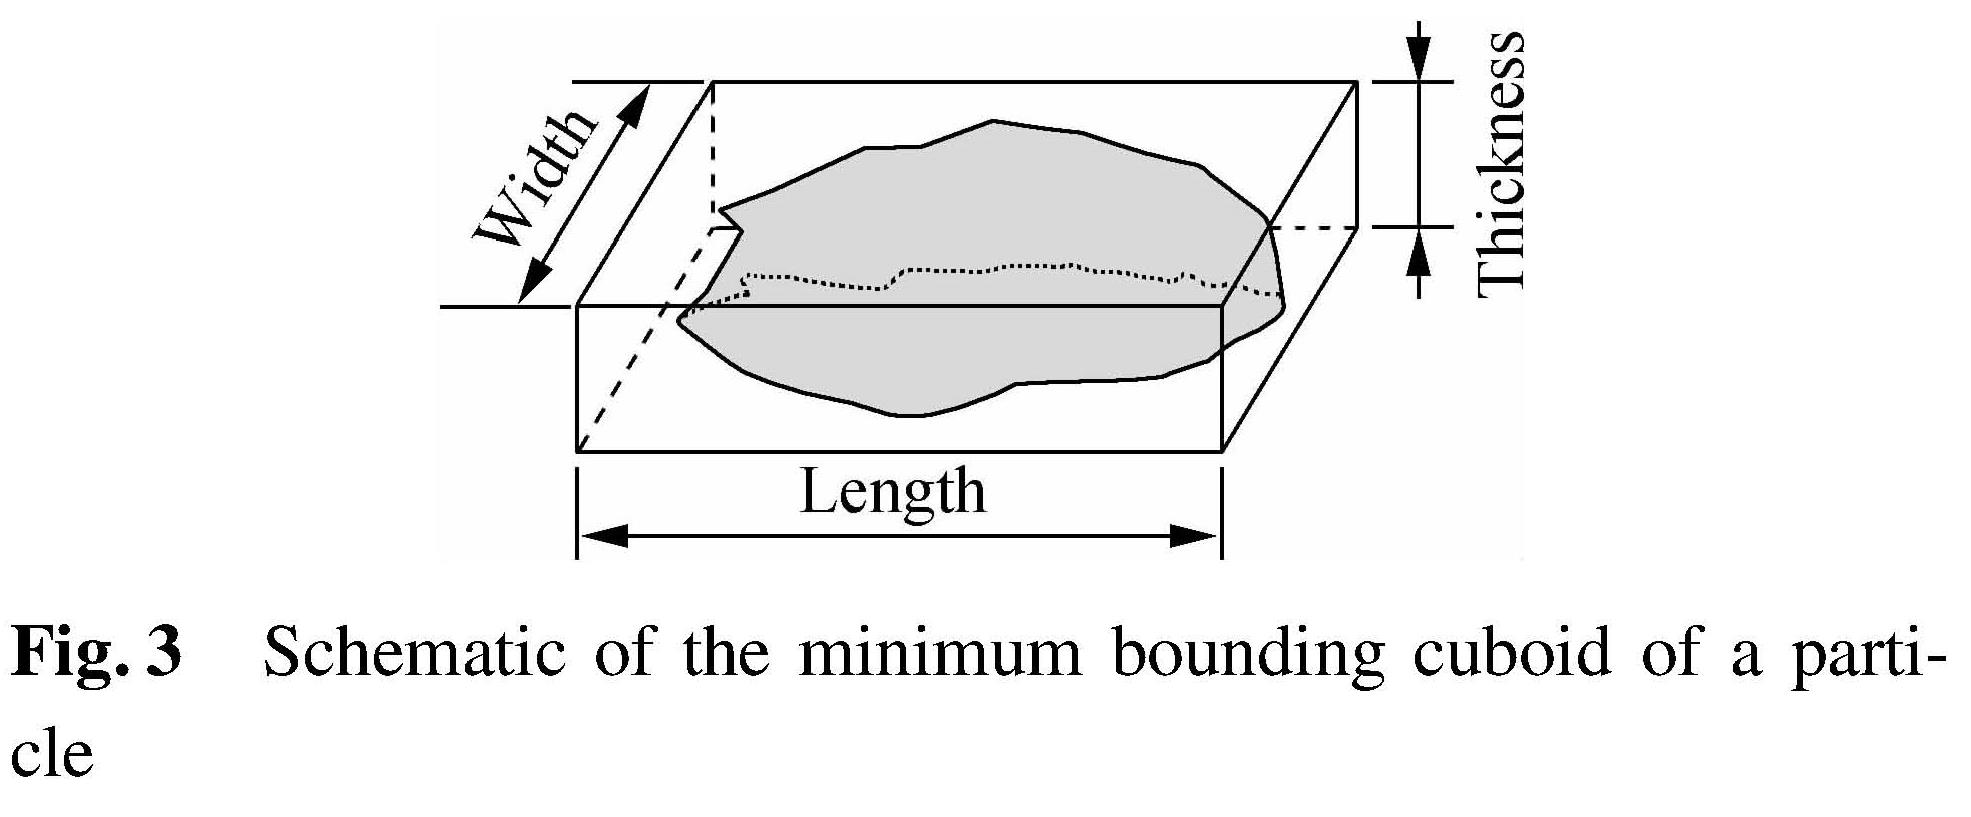
Fig.3 Schematic of the minimum bounding cuboid of a particle
Angularity is the second-order property which reflects the variations at the corners of sand particles, and the particle angularity is represented by roundness R. Fig.4 illustrates that the area and perimeter of particle two-dimensional projection can be calculated by image processing. R is defined as the ratio between areas and perimeter is used to describe the angularity of sand particles.
R=(4πA)/(C2)(3)
where A is the area of particle projection, and C is the perimeter of particle projection.
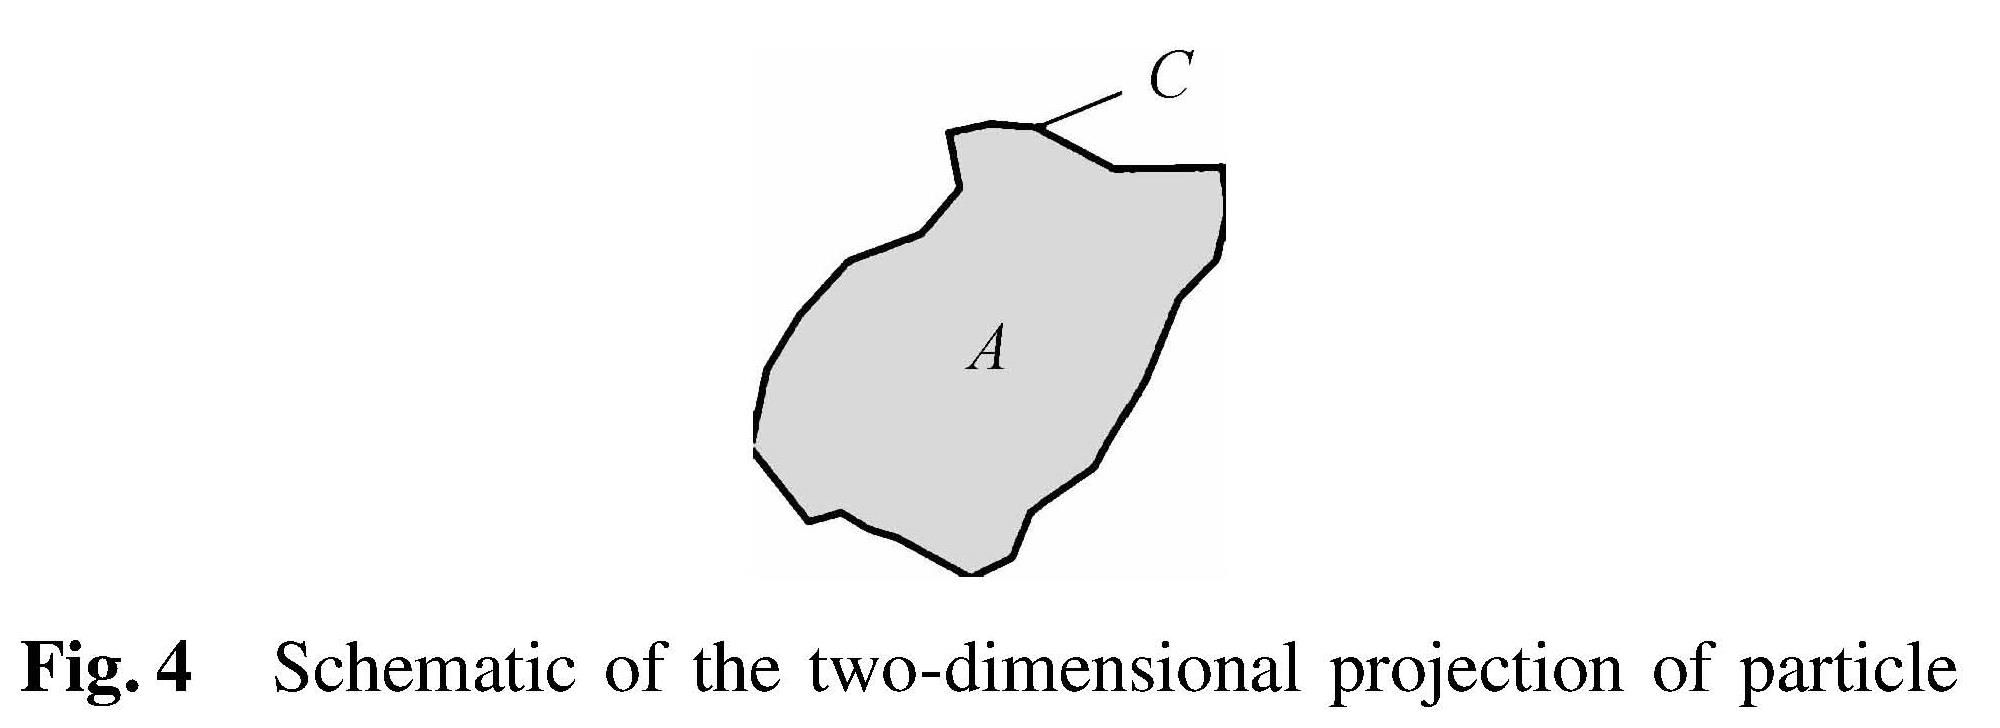
Fig.4 Schematic of the two-dimensional projection of particle
Surface texture is the third-order property which reflects the variations of height on the sand particle surface. The main difference between angularity and surface texture is that the surface texture is a micro-property, and angularity is a macro-property in comparison. In addition, surface texture is a three-dimensional property while angularity is two-dimensional. The surface texture property is out of scope due to this limitation of this method.
The examples of geometrical 3D shapes and their morphological parameters are shown in Tab.1.
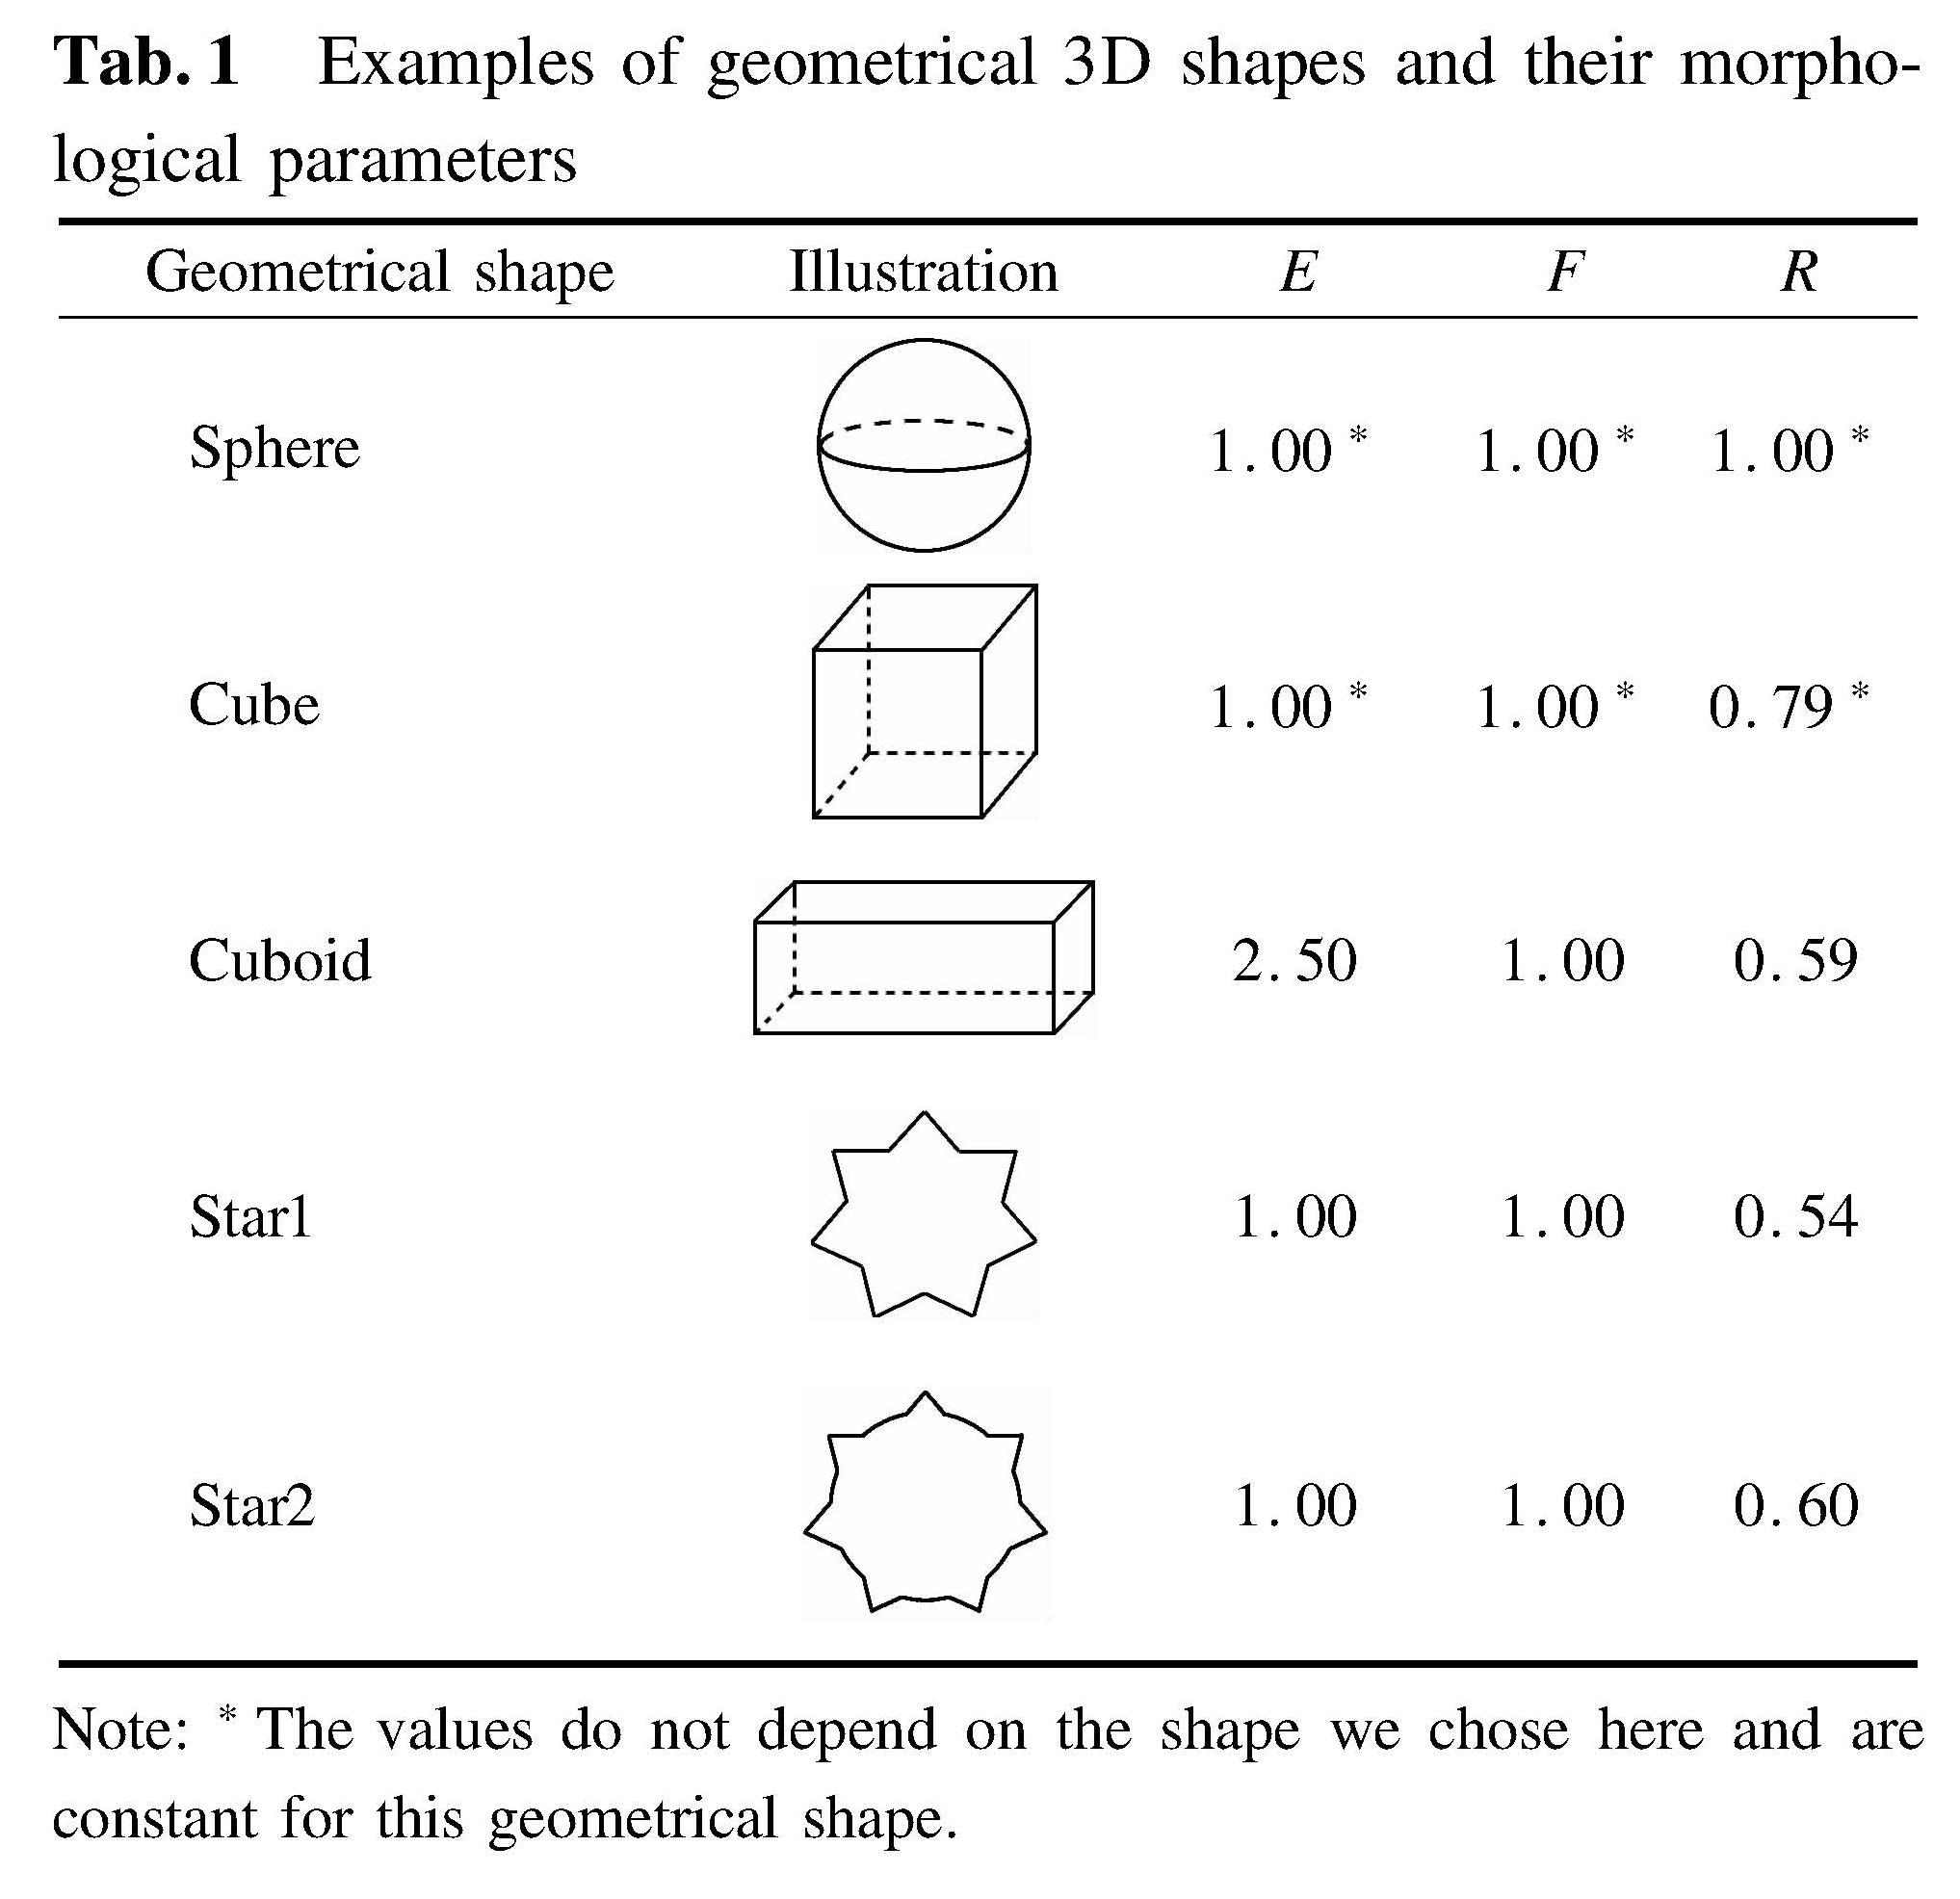
Tab.1 Examples of geometrical 3D shapes and their morphological parameters
Geometrical shape Illustration E F RSphere 1.00* 1.00* 1.00*Cube 1.00* 1.00* 0.79*Cuboid 2.50 1.00 0.59Star1 1.00 1.00 0.54Star2 1.00 1.00 0.60
Note:*The values do not depend on the shape we chose here and are constant for this geometrical shape.
1.2.2 Acquisition of digital imagesThe image acquisition platform and unprocessed image are illustrated in Fig.5. LED lamps are placed perpendicular to each other, and sand particles are placed on the horizontal platform(see Fig.5(a)). With this method, the image of black particle and gray background(see Fig.5(b))can be captured, and the complete outline of sand particles can be extracted clearly. Sand particles are lined up parallel to the vertical lamp to collect multi-particle information in one image. Top view and front view images are captured, respectively. Thus, the three-dimensional sizes of a particle can be obtained. The camera pixel is 12 ×106, and the distance between particles from the camera is 15 cm.
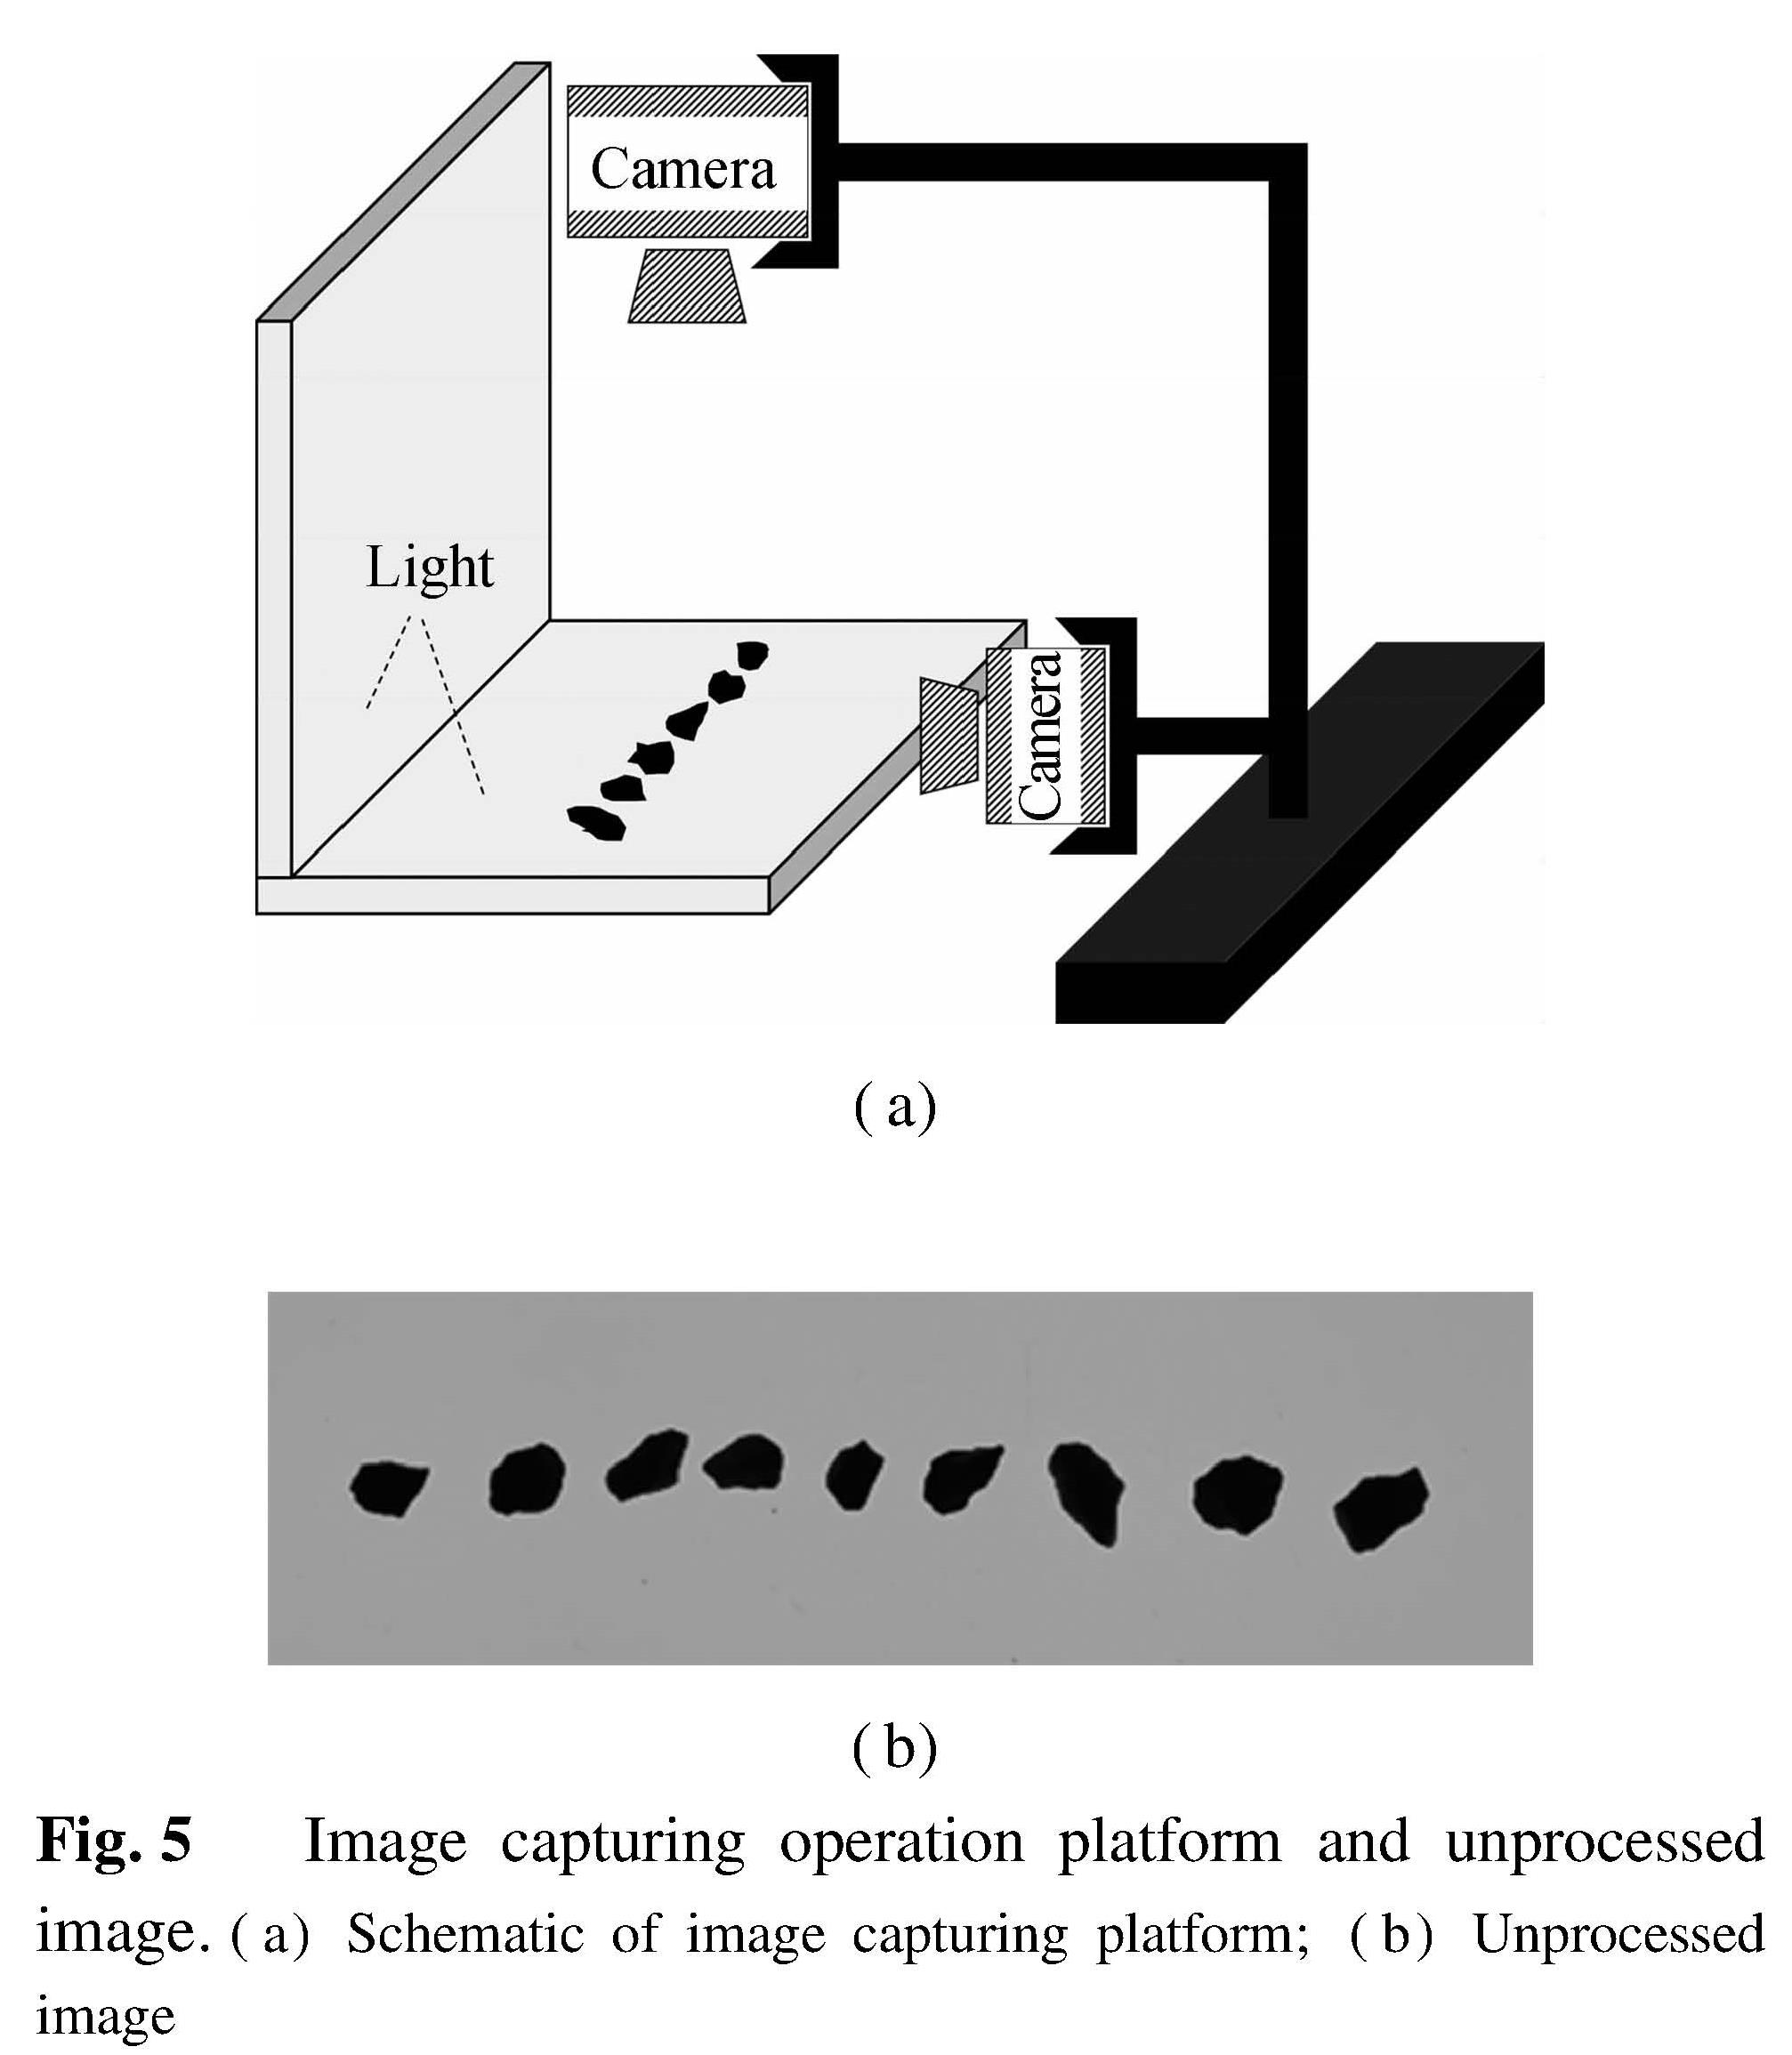
Fig.5 Image capturing operation platform and unprocessed image.(a)Schematic of image capturing platform;(b)Unprocessed image
1.3 Digital image processing1.3.1 Image segmenting and object labeling
Sand particle shape characterization is achieved on the condition that the particles are recognized from a digital image. Therefore, the extraction of particle projection from the image begins prior to image processing. A binary image with white object region and black background is required for further processing. After that, particle labeling is used to attach every particle a unique number, so the shapes of multi-particle can be measured efficiently at one time(see Fig.6).
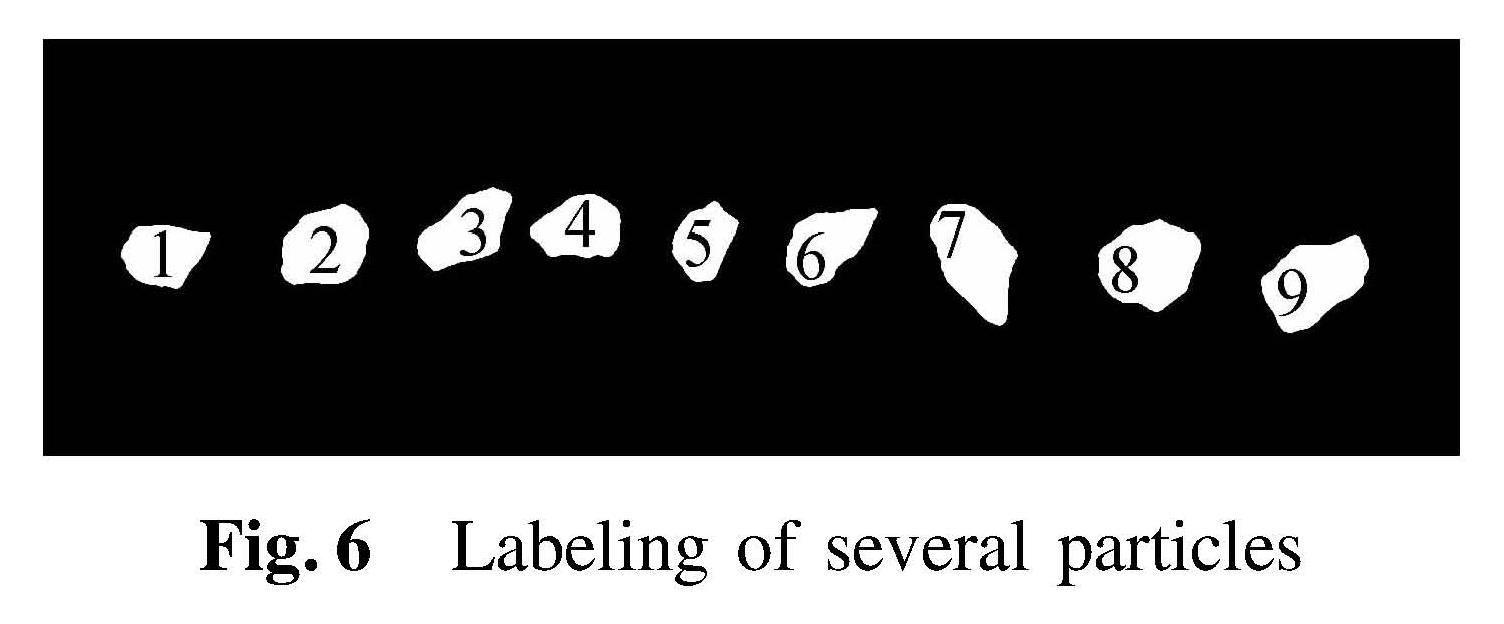
Fig.6 Labeling of several particles
1.3.2 Minimum bounding rectangle
The determination of length, width and thickness is divided into two steps. The first step is nominal length and width measurement by the top view image. As shown in Fig.7(b), the minimum bounding rectangle surrounding particles can be determined, and the sizes of this rectangle are taken as nominal length and width of the particle. The second step is nominal thickness measurement by the front view image, and the vertical projection size of a particle was taken as its nominal thickness(see Fig.7(a)). Then, the true sizes of a particle can be obtained by sorting the nominal length, width and thickness in the order from largest to smallest.
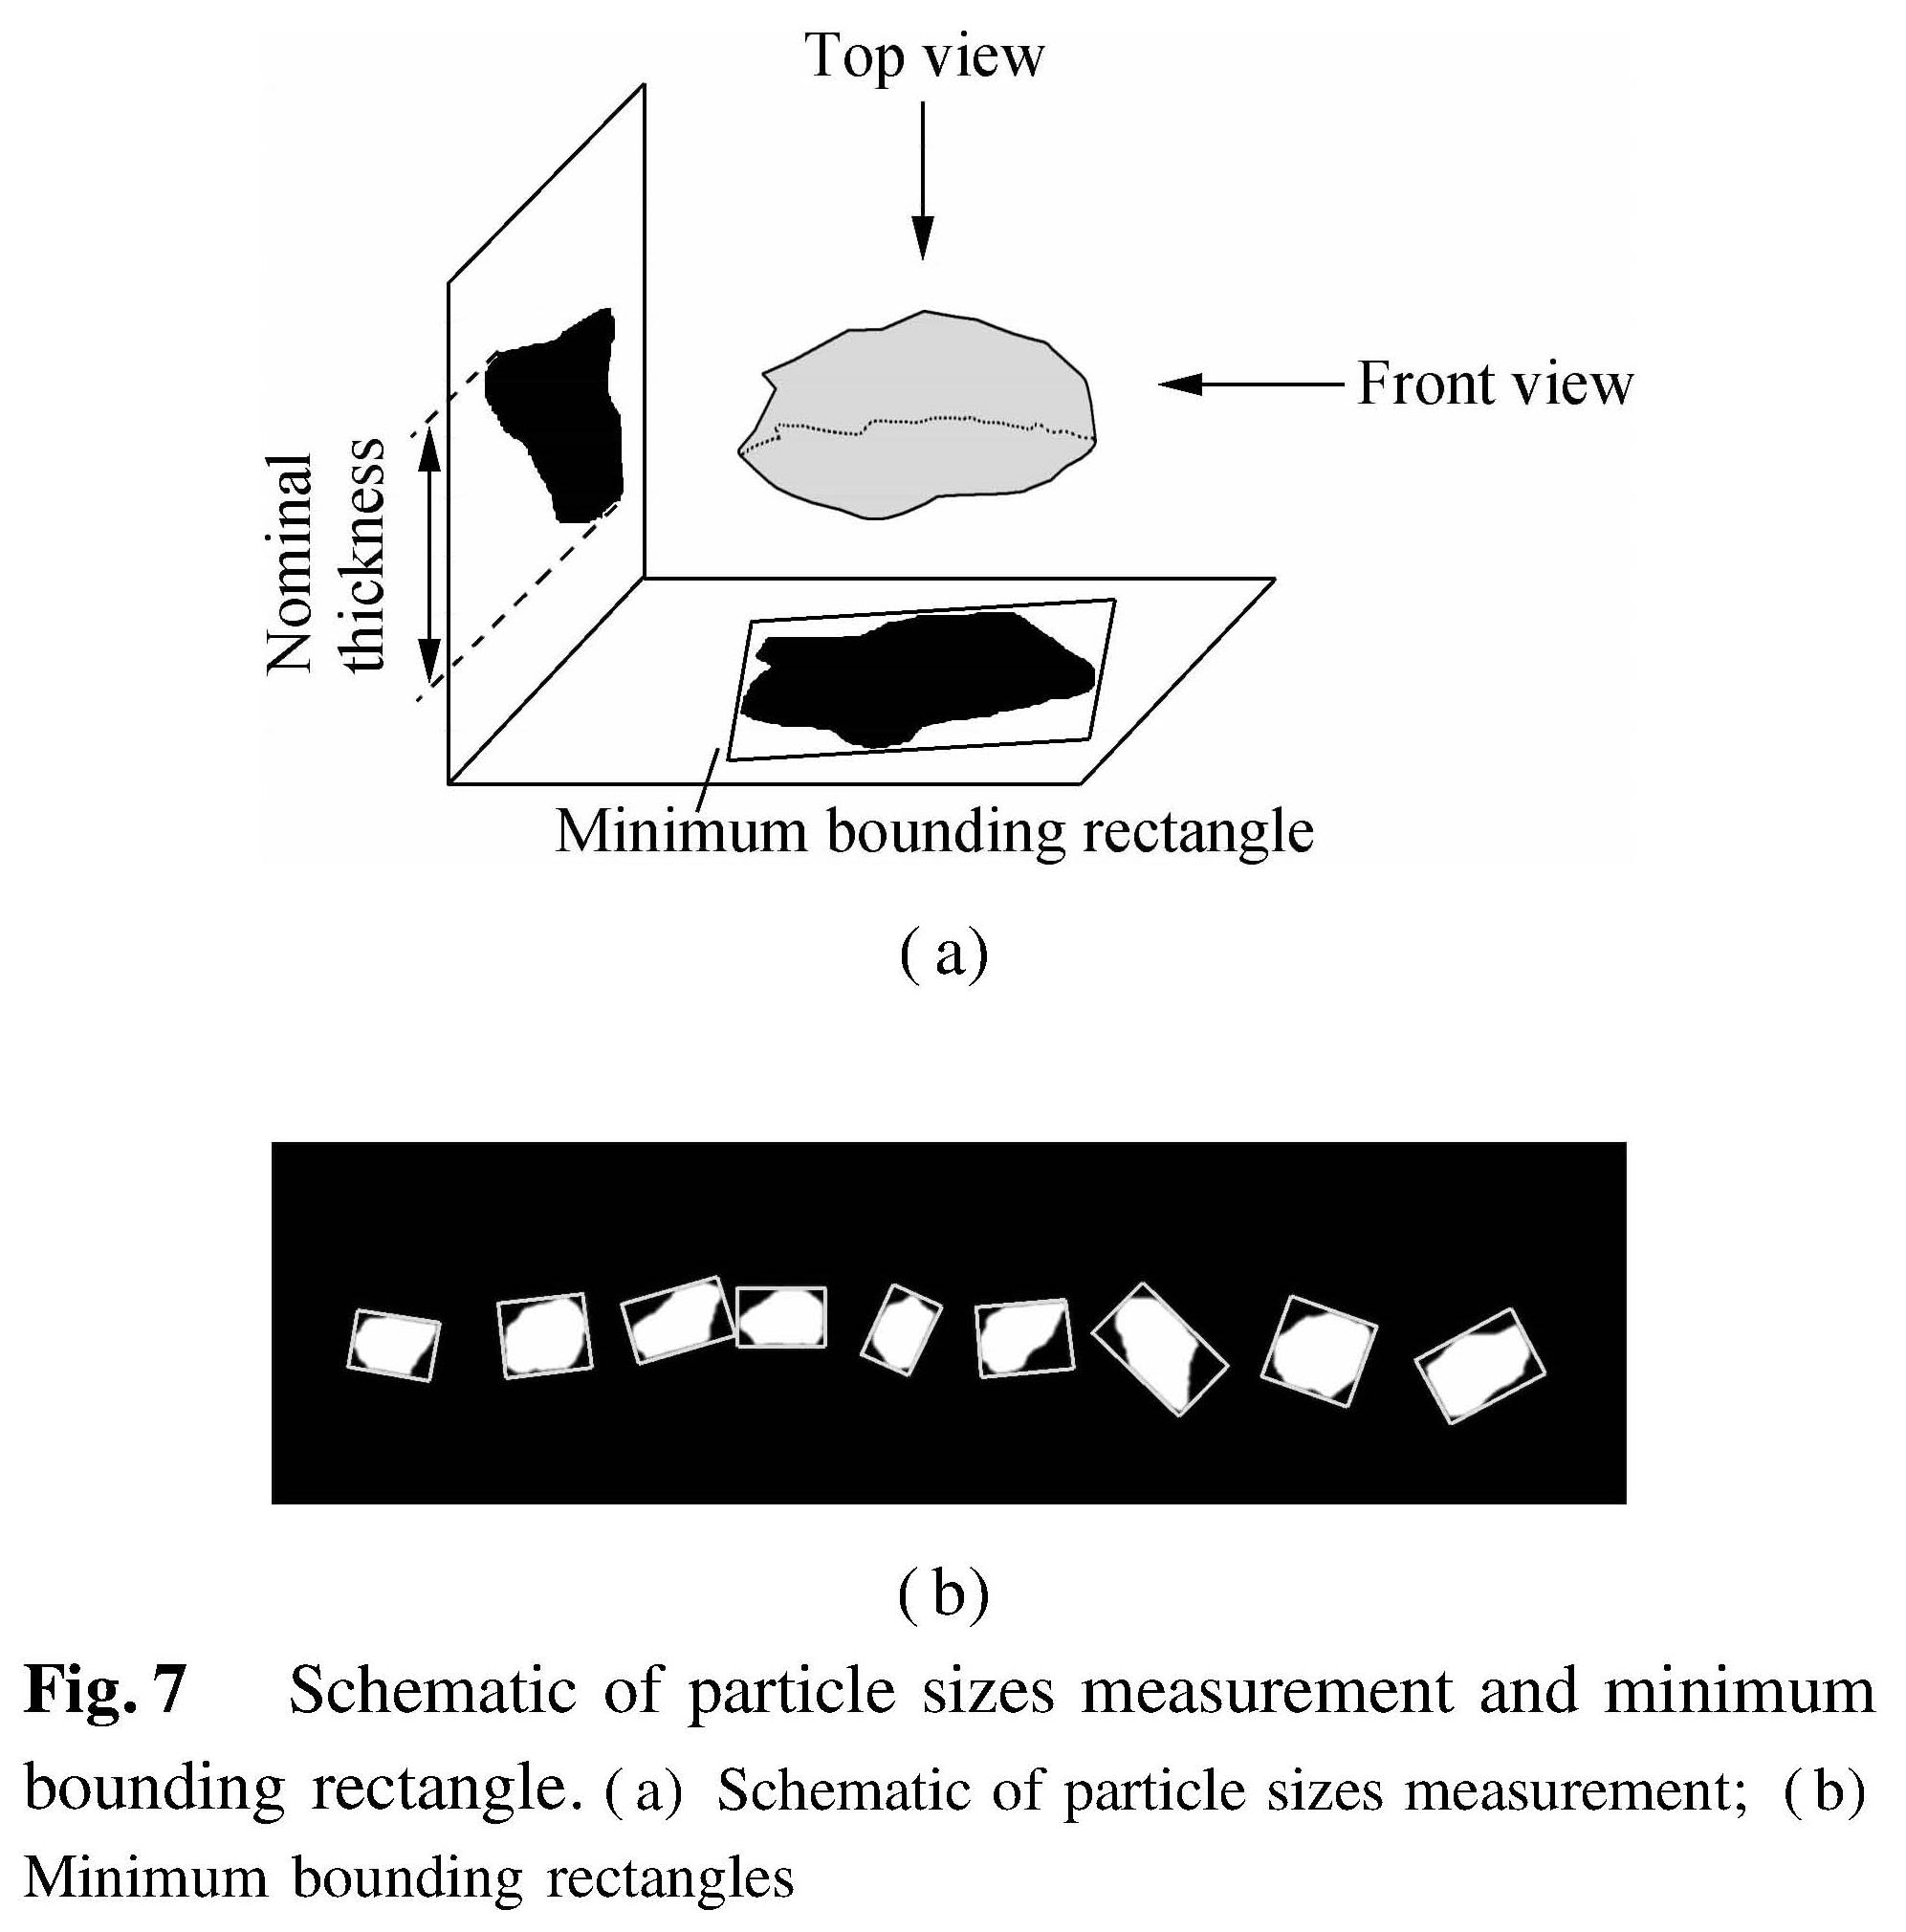
Fig.7 Schematic of particle sizes measurement and minimum bounding rectangle.(a)Schematic of particle sizes measurement;(b)Minimum bounding rectangles
1.3.3 Area and perimeter of particles
The particle area can be determined by counting the pixel number of the particle region. The perimeter measurement is relatively complex because the particle outline is irregular. As Fig.8 illustrates, the black region is a particle projection, the area of the particle is 42(by counting the number of black squares), and the particle contour is constituted by external squares(constituted by the connection of square 1-2-6-12-19-26-33-39-38-42-41-40-34-27-20-13-7-3-1). The length of line segment 2-6(referred to as the connection of square 2 and square 6)is 20.5, and the length of line segment 1-2(referred to as the connection of square 1 and square 2)is 1. Thus, counting the quantity of line segments like 1-2 and 2-6 is the key to perimeter determination. Freeman chain code[36] is used here to achieve this, and the calculated perimeter is 21.3.
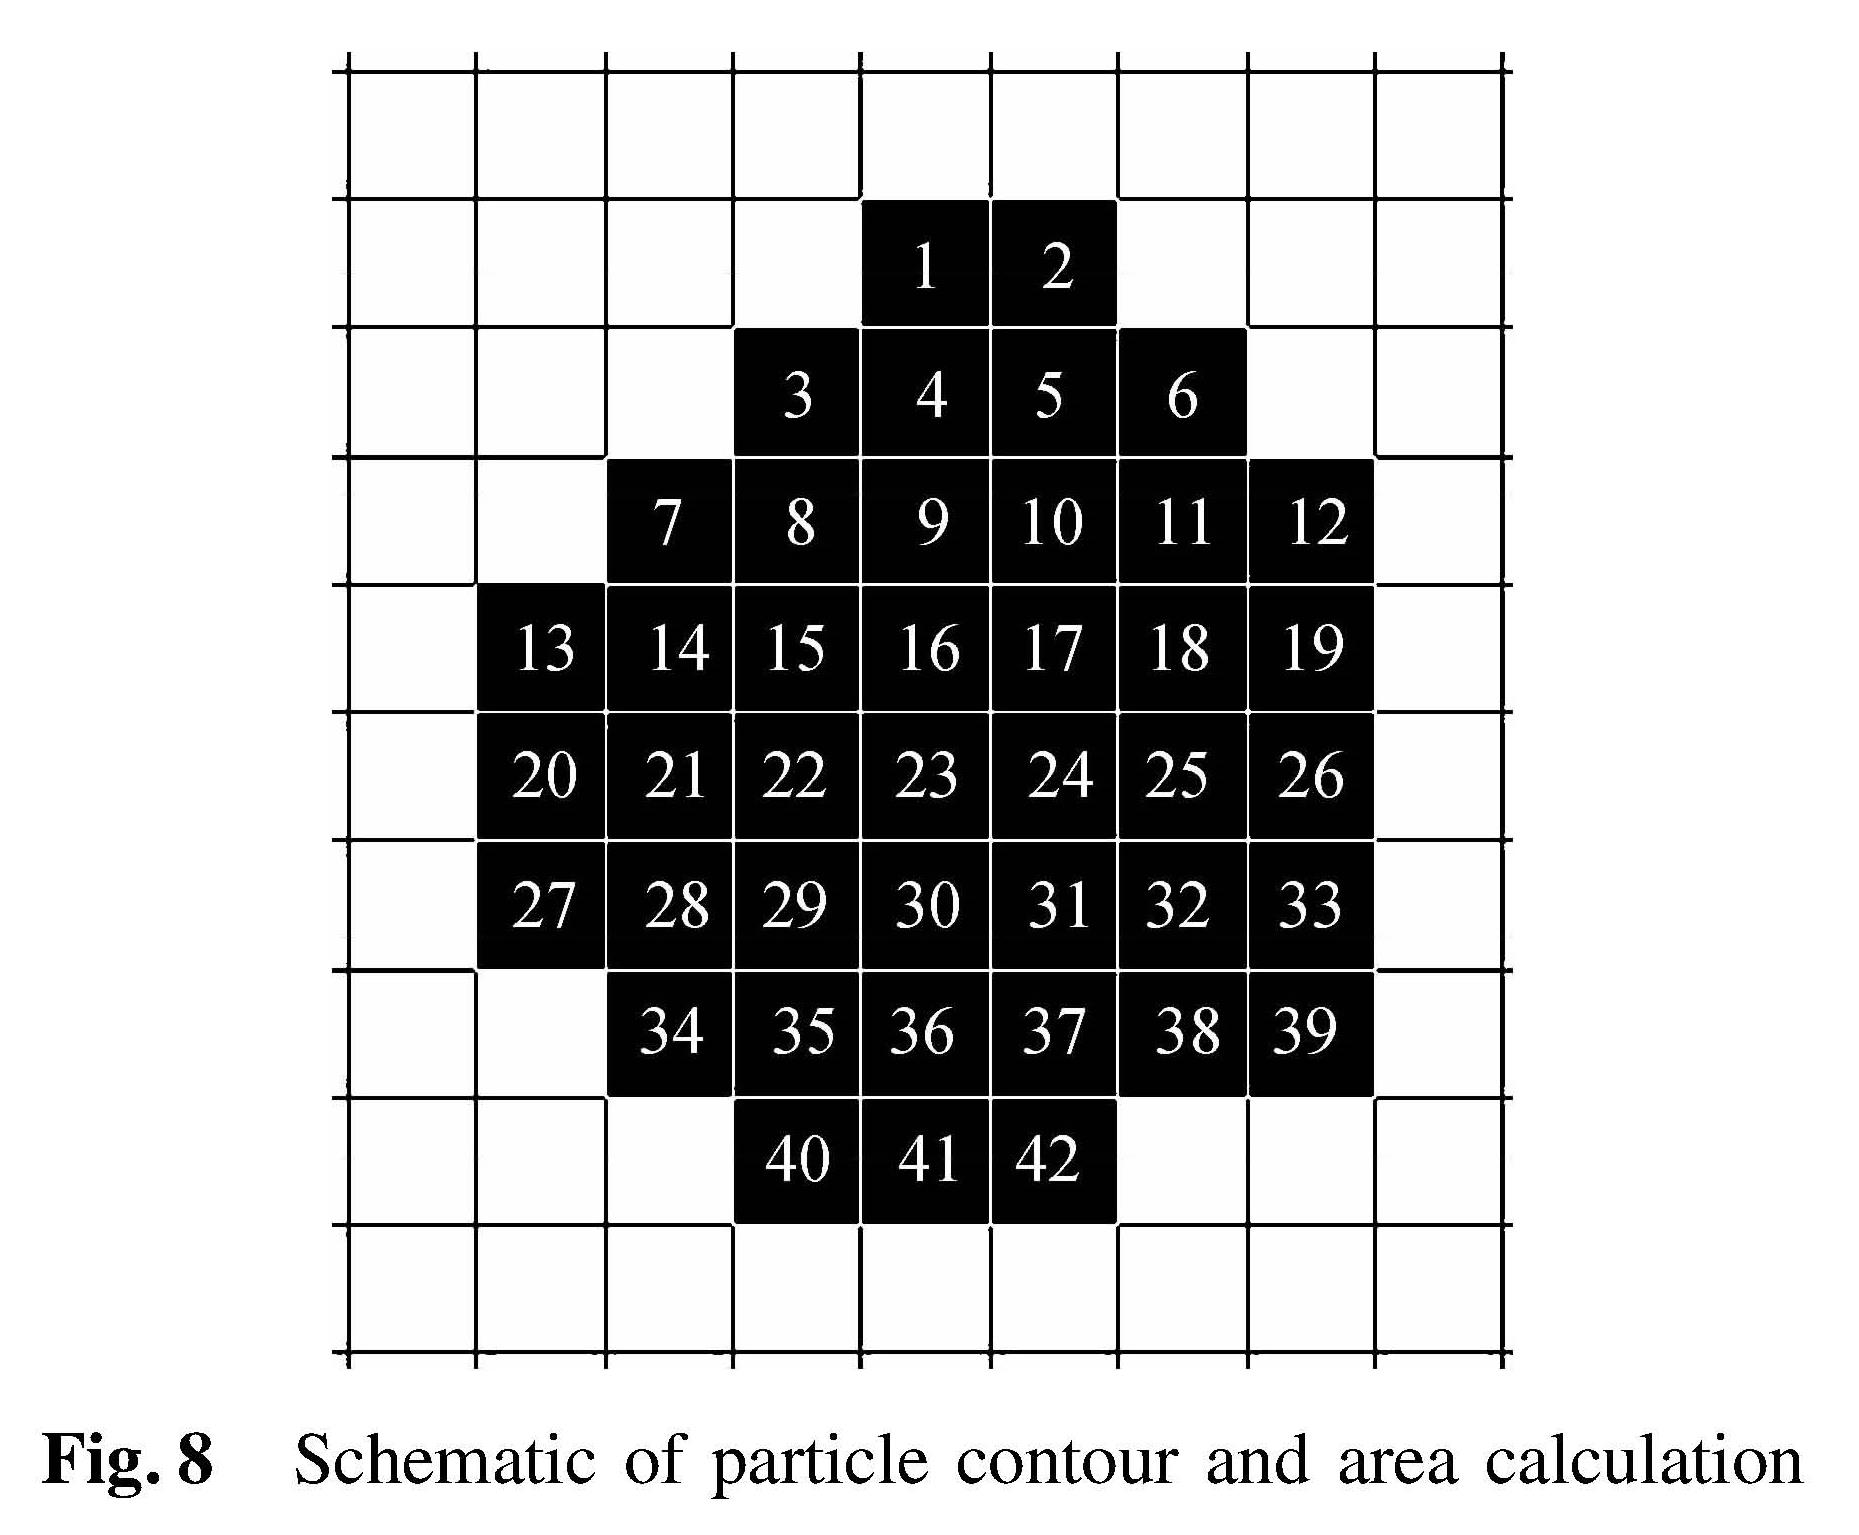
Fig.8 Schematic of particle contour and area calculation
2 Results and Discussion2.1 Accuracy test of the DIP method
The practical basis of the DIP method is the measurement accuracy. Hence, the shape index results by the Vernier caliper taken as true values are compared to those by the DIP method to analyze the measurement accuracy of the DIP method.
2.1.1 Aspect ratios moduleOne cuboid is used to verify the aspect ratios measurement accuracy of the DIP method. As shown in Tab.2, the values of L, W and T measured by the Vernier caliper of the cuboid are 50.02, 40.77 and 40.18 mm, respectively, consequently E and F calculated according to Eqs.(1)and(2)are 1.23 and 1.01. Then, the cuboid is measured by the DIP method, and E and F of the cuboid are 1.23 and 1.01, which are separately equal to the Vernier caliper measurement.
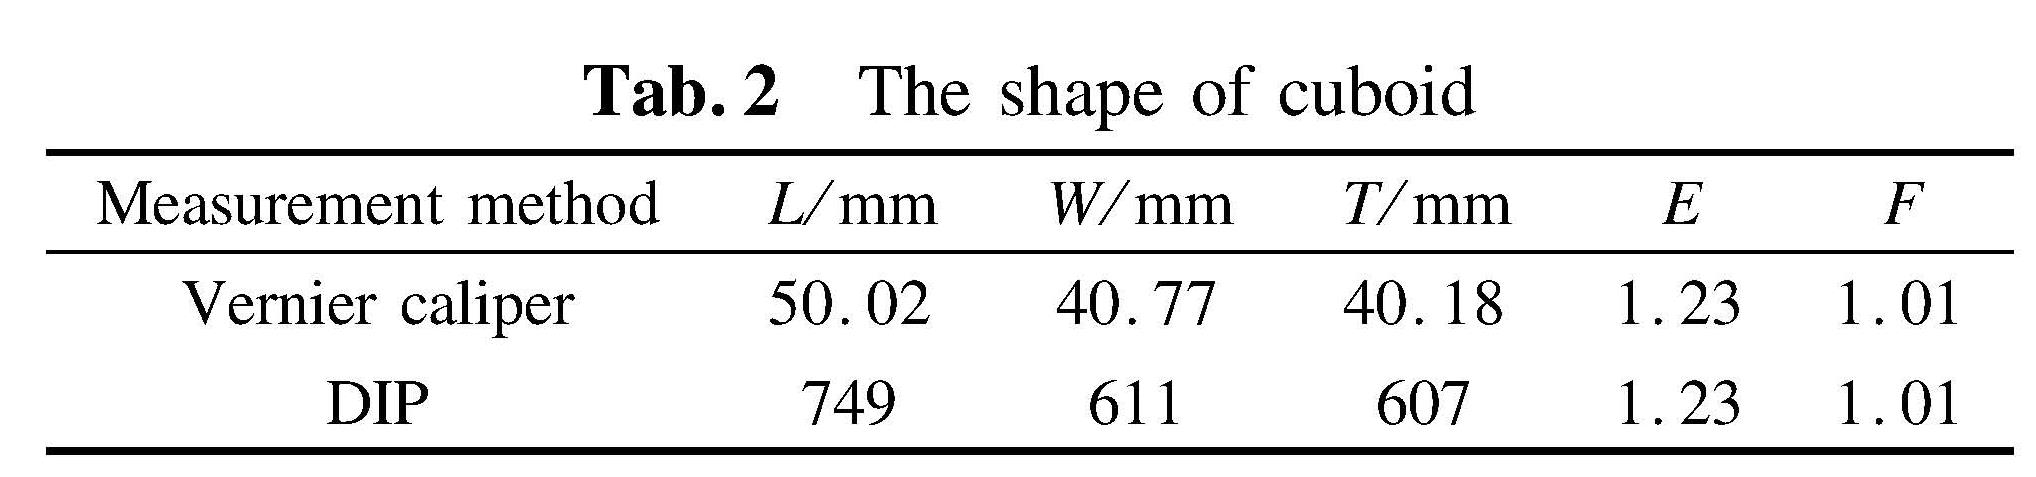
Tab.2 The shape of cuboid
2.1.2 Roundness module
Similarity to the aspect ratios module, one rectangle was used to verify the R measurement accuracy of the DIP method. As shown in Tab.3, the length and width of the rectangle measured by the Vernier caliper are 50.02 and 40.18 mm, consequently A and C are 2 009.80 mm2 and 180.40 mm, respectively, and R calculated according to Eq.(3)is 0.78. Then, the R of the rectangle measured by the DIP method is equal to the Vernier caliper measurement.
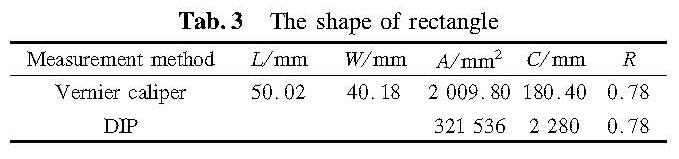
Tab.3 The shape of rectangle
2.2 Sample size test of the DIP method
It is pointless to measure one sand particle since the sand particle shape is non-uniform, and one particle shape cannot represent its overall shape property. Besides, it is impossible to measure all the particles we used in concrete. Thus, the issue that remained to be solved is how many particles should be measured at least to represent the overall shape property of sand. This is called the sample size problem in statistics.
2.2.1 Aspect ratios moduleA sample size test was performed to determine a scientific and reasonable number of sand particles for aspect ratios evaluation. Some indices are defined as
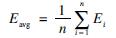 (4)
(4)
 (5)
(5)
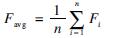
where Eavg is the mean elongation of particles; Ei is the elongation of particle i; n is the number of particles we measured; Favg is the mean flatness of particles; Fi is the flatness of particle i.
As shown in Fig.9, the average aspect ratio of 500 particles is taken as the overall shape parameters of particles, denoted as Et. In Fig.9(a), as for RS_2.36, Et=1.24, which shows that Eavg approaches 1.24 with the increase in the measured particle number. The other types of sand(such as MS1_2.36 etc.)have the same tendency. Besides, when the measured number reaches 350, it is found that the relative error of Eavg is smaller than 1%. In Fig.9(b), the similar situation of Favg occurs as shown in Fig.9(a). Moreover, when the measured number reaches 350, it is found that the relative error of Favg is lower than 1.5%.
2.2.2 Roundness moduleAs shown in Fig.10, for RS_2.36, Rt=0.793 8. The results suggest that Ravg approaches 0.793 8 with the increase in the measured particle number, and the other types of sand(such as MS1_2.36 etc.)have the same tendency. Moreover, when the measured number of particles reaches 350, it is found that the relative error of Ravg is lower than 1%.
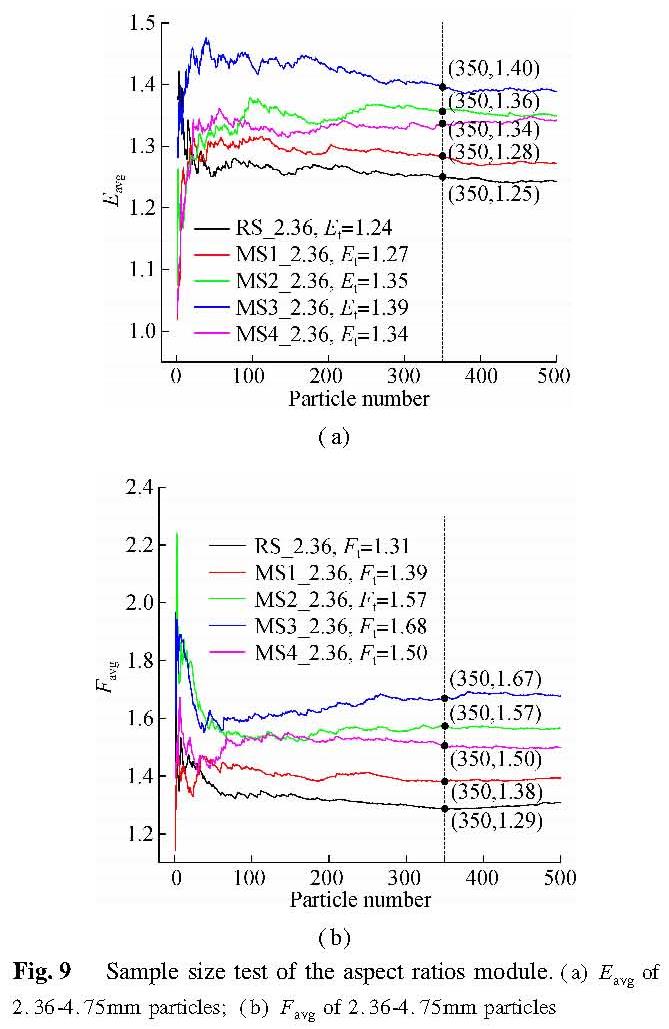
Fig.9 Sample size test of the aspect ratios module.(a)Eavg of 2.36-4.75mm particles;(b)Favg of 2.36-4.75mm particles
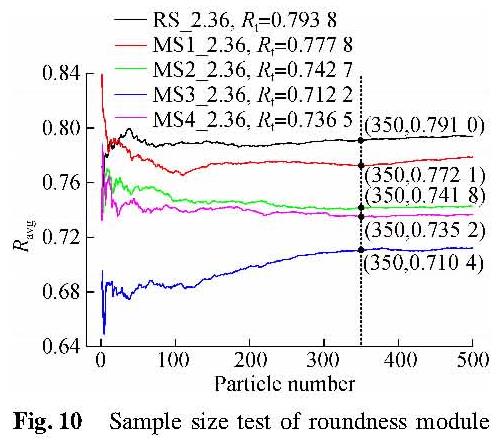
Fig.10 Sample size test of roundness module
2.3 Instance analysis
The instance analysis of sand particle shape measurement by the DIP method was performed to examine whether the DIP method is suitable for sand particle shape characterization. Based on the results of sample size tests, 350 particles of each type of sand were measured by the DIP method to determine the aspect ratios and roundness which represent the overall shape property of sand.
2.3.1 Aspect ratios moduleThe aspect ratios scatter diagram of RS_2.36 is shown in Fig.11. It is found that Eavg and Favg of RS_2.36 are 1.25 and 1.29, respectively, and their standard deviations ESD and FSD are 0.22 and 0.28, respectively. The aspect ratio results of all kinds of sand are listed in Tab.4. We find that Eavg of RS is lower than that of MS except MS1_1.18, and Favg of RS is lower than that of all kinds of MS. Furthermore, the aspect ratio results show that MS1 has the smallest Eavg and Favg of MSs. It means that MS1 particles are less elongated and flat than the other MSs. It may be explained by different mineral compositions and production processes. Furthermore, Eavg measured by the DIP method is compared with that by Camsizer(a commercial particle shape characterization software from the Retsch Technology company)in Fig.12. The results suggest that Eavg by the DIP method is highly correlated with that of Camsizer. Especially for the sand of 2.36-4.75 mm, almost a linear relationship between both methods is observed.
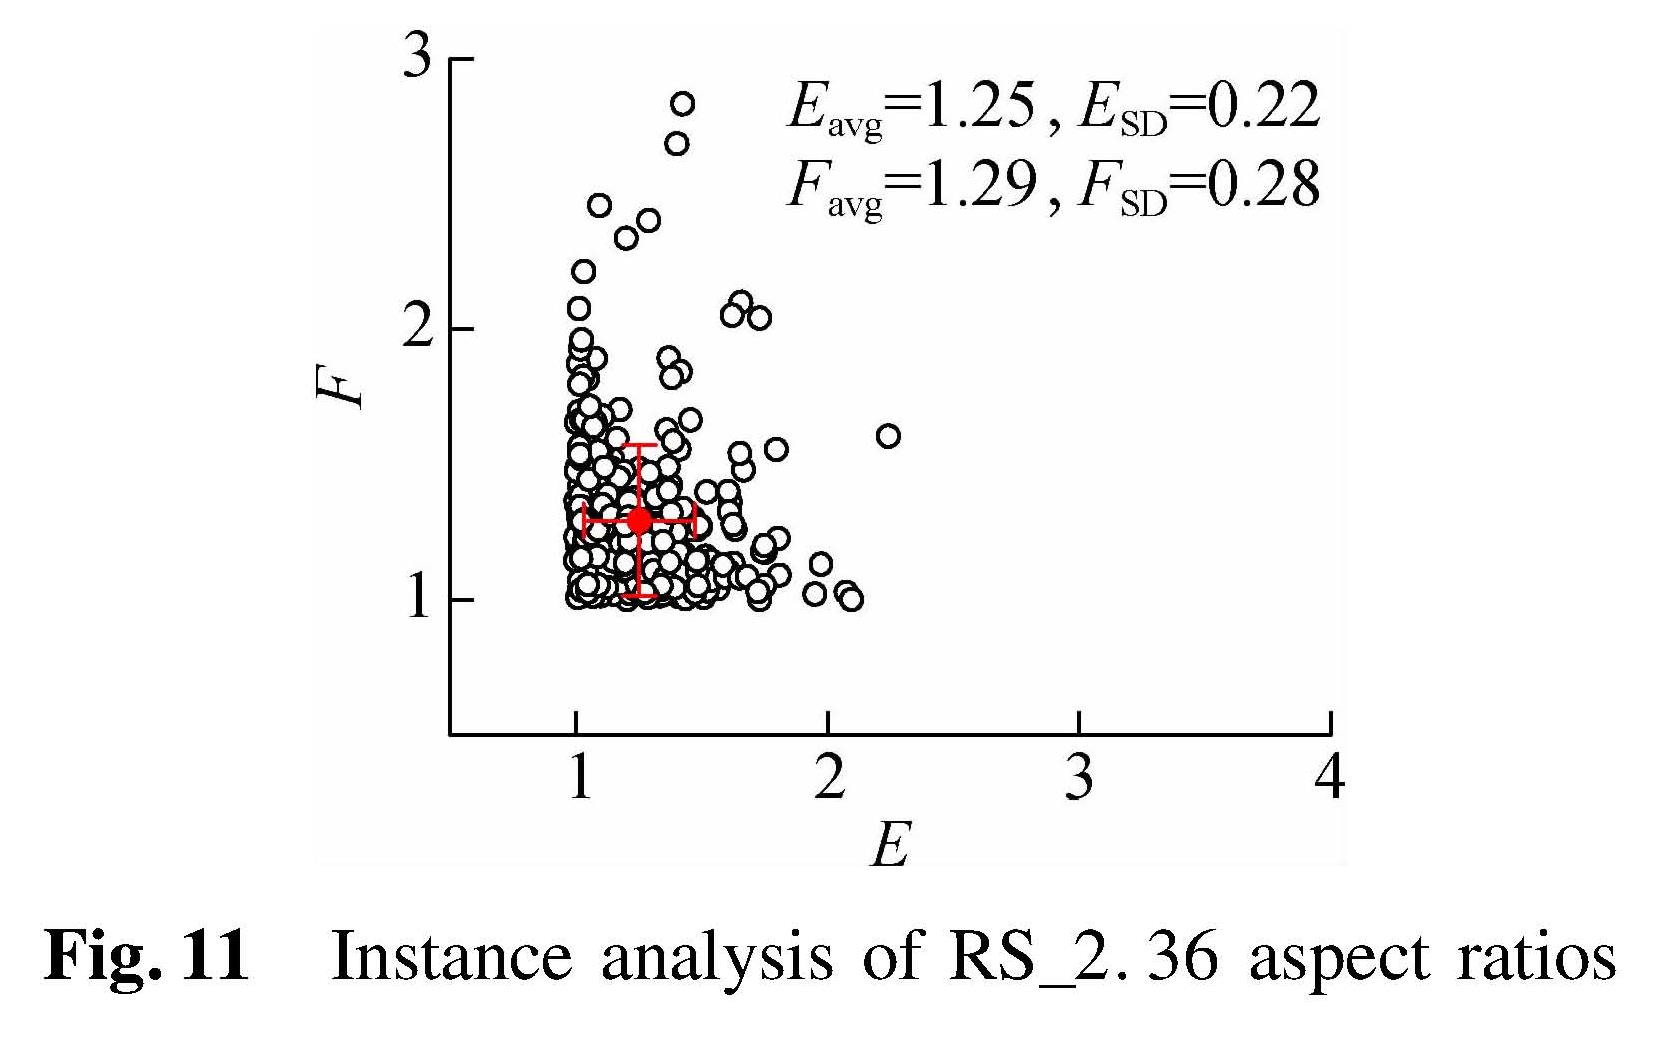
Fig.11 Instance analysis of RS_2.36 aspect ratios
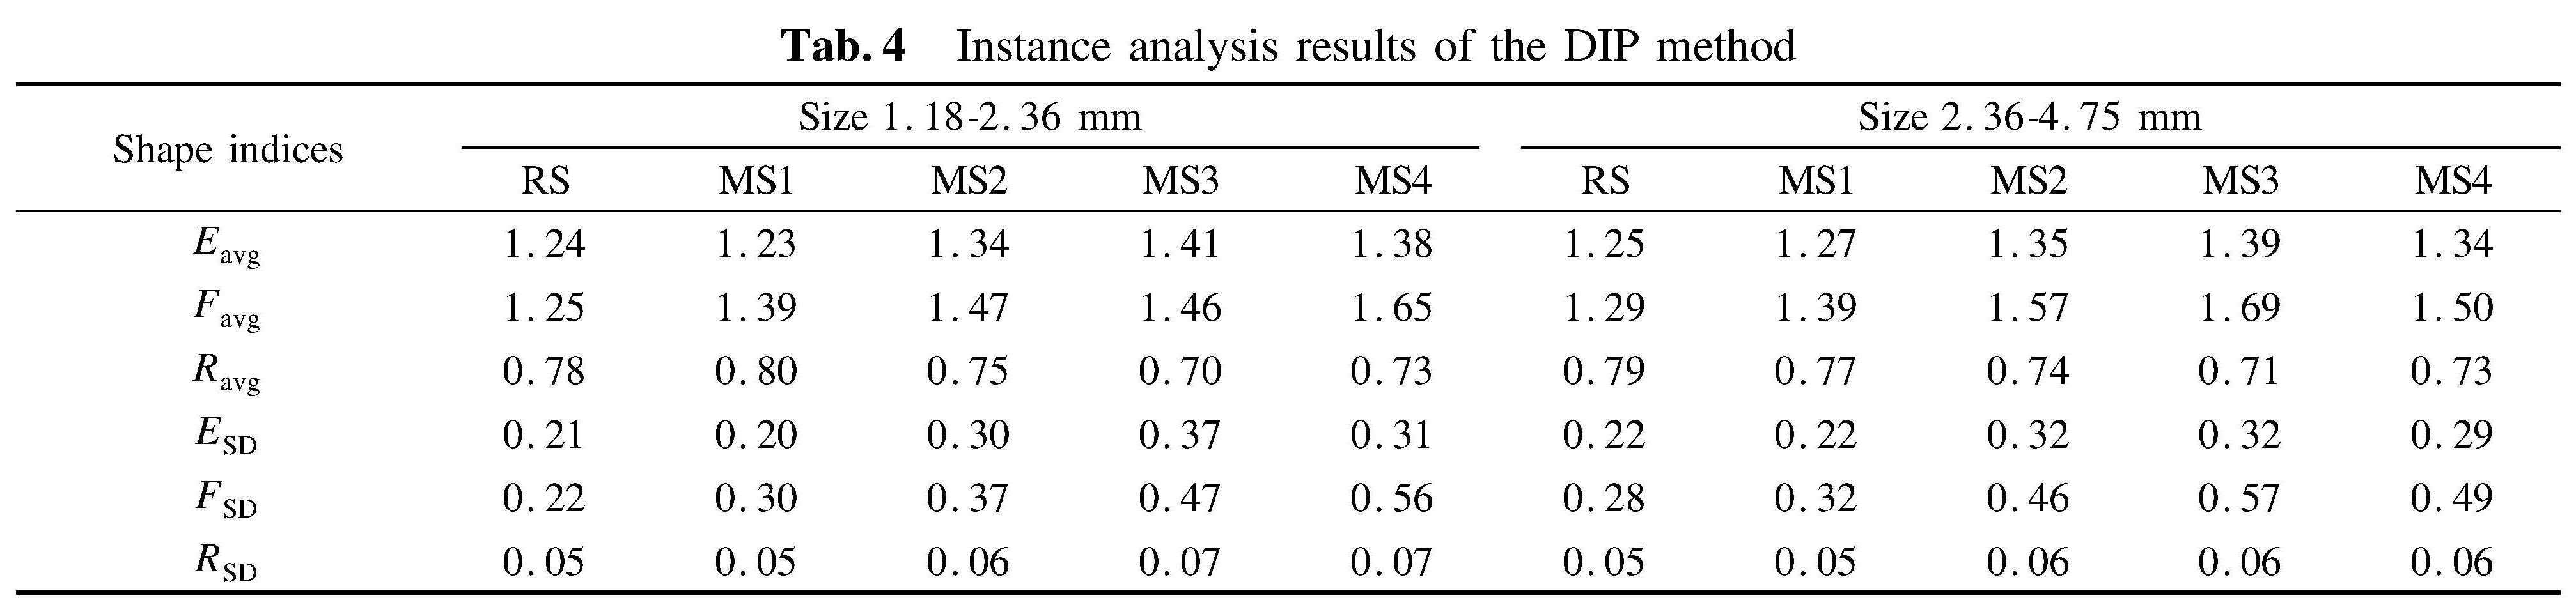
Tab.4 Instance analysis results of the DIP method
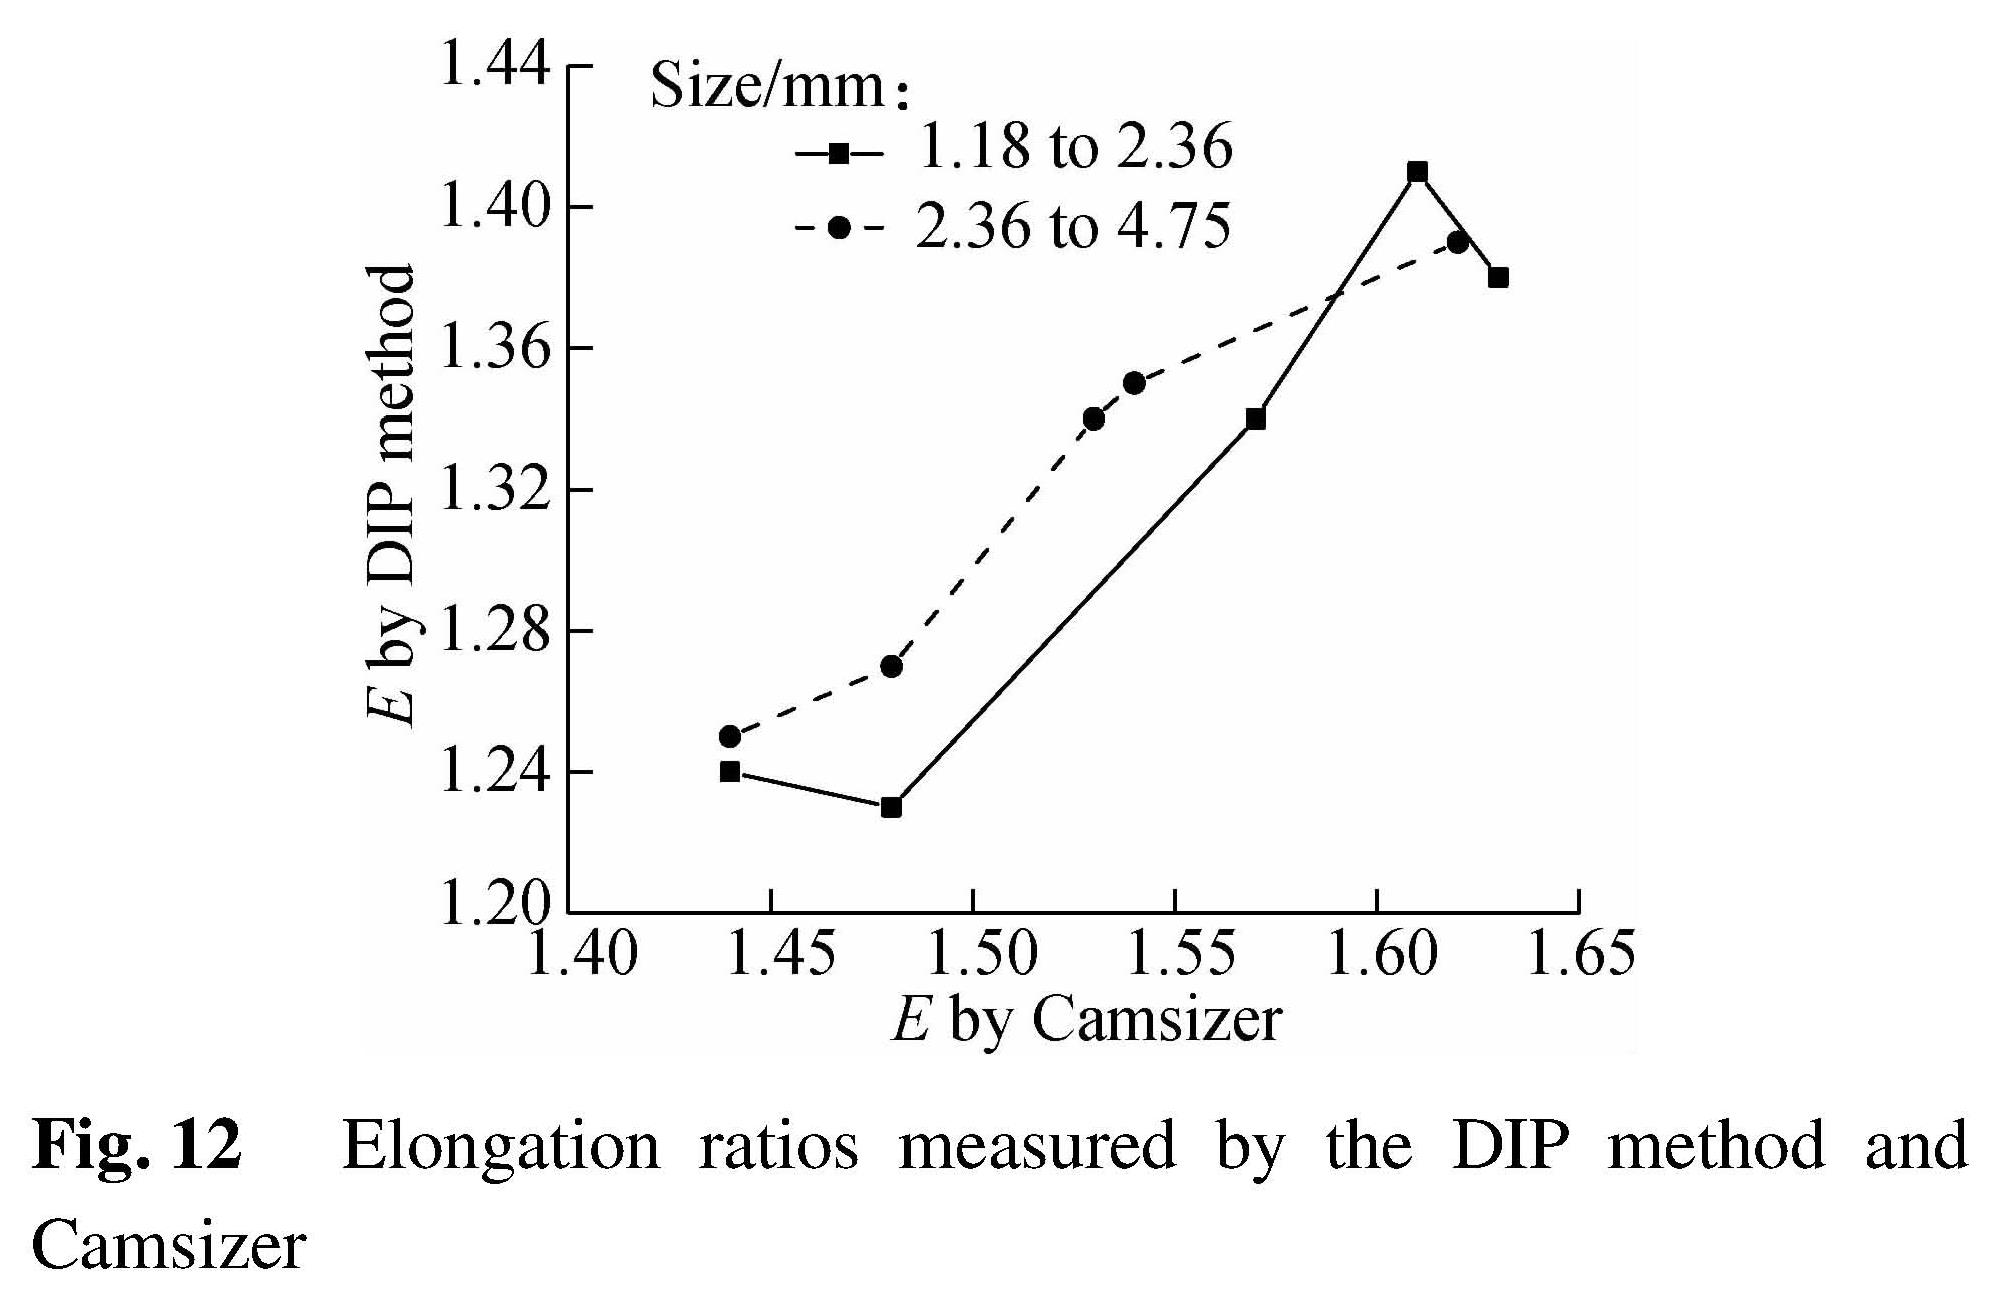
Fig.12 Elongation ratios measured by the DIP method and Camsizer
2.3.2 Roundness module
The roundness histogram and cumulative distribution curve of RS_2.36 are shown in Fig.13. It is found that Ravg of RS_2.36 is 0.79, and RSD is 0.05. As shown in Tab.4, we observe that Ravg of RS is higher than that of all kinds of MSs expect for MS1_1.18.
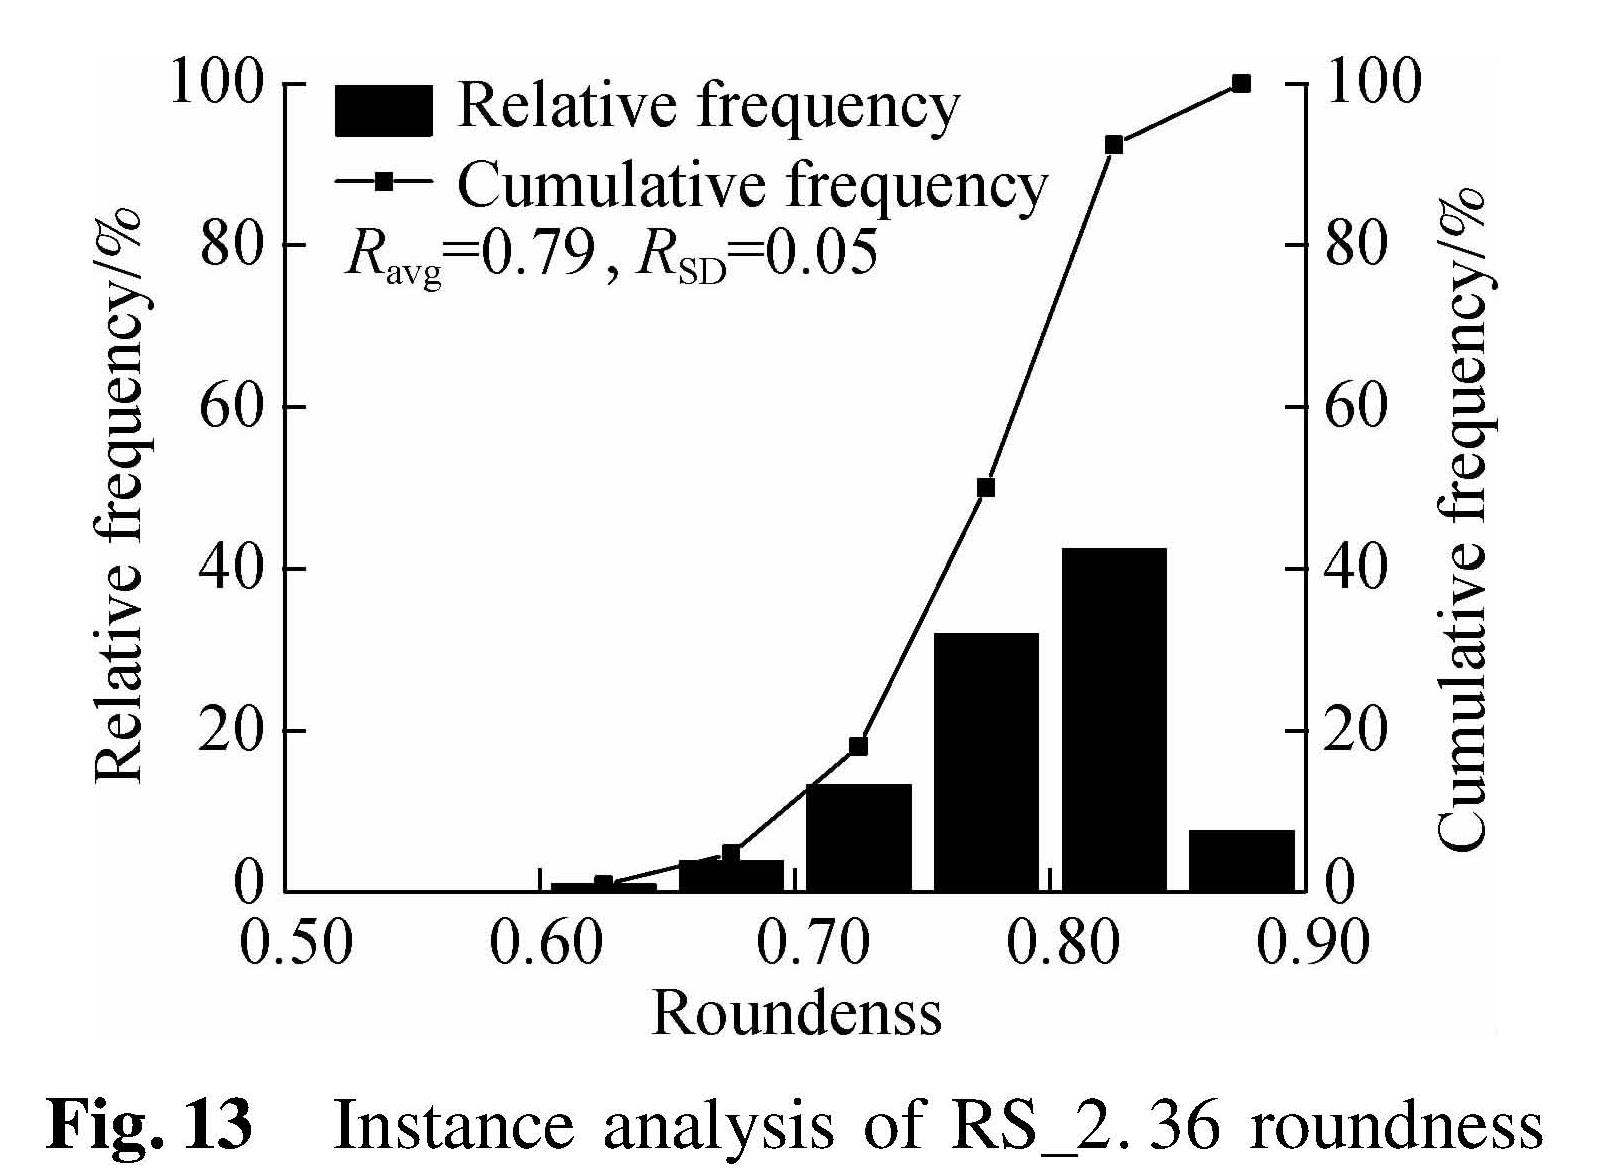
Fig.13 Instance analysis of RS_2.36 roundness
2.4 Results analysis
The challenges of sand shape measurement are direct thickness determination[17-18] and the statistical analysis of the results[26-28]. In the present study, we investigated the method for the direct determination of length, width and thickness to describe the sand particle form. Furthermore, the area and perimeter of particle projection were measured to describe the sand particle angularity. The accuracy test shows that the DIP method is accurate for aspect ratios and roundness measurement. The sample size test proves that the measured particle number affects the sand shape characterization, and 350 sand particles should be measured by the DIP method to represent the overall shape property of sand. The results of instance analysis indicate that the DIP method is able to evaluate sand shape and distinguish sand shape differences. In particular, the flatness ratio F of sand particles is first measured by the DIP method. The comparison of elongation ratio results by the DIP method and Camsizer shows that the DIP method is as good as a commercial instrument. This study demonstrates that the DIP method is able to measure the thickness of sand particles directly.
2.4.1 Accuracy analysisAs shown in Tab.2, we find that the results of aspect ratios and roundness measured by the DIP method are in agreement with those measured by the Vernier caliper. The measurement accuracy of the DIP method provides a foundation for sand particle shape characterization.
2.4.2 Statistical analysisIn this study, the direct determination of thickness was achieved by the DIP method first. In Section 2.3.2, it presents details about length, width and thickness determination by the DIP method, and then, E and F are calculated according to Eq.(1)and Eq.(2)to describe the elongation and flatness of sand particles. Moreover, we observe that aspect ratios(see Fig.9)and roundness characterization results(see Fig.10)by the DIP method are affected by the measured particle number. This is caused by the non-uniform sand particle shape. One particle shape cannot represent its overall shape property. Besides, we find that when the particle number reaches 350, the relative error of aspect ratios is lower than 1.5%, and the relative error of roundness is lower than 1%. Hence, it is concluded that the shape results of 350 particles measured by the DIP method are able to represent the overall shape property of sand. In other words, the shape results of 350 particles measured by the DIP method are statistically significant.
2.4.3 Practicality analysisThe instance analysis of the sand particle shape measurement by the DIP method was conducted to examine whether the DIP method is practical. As shown in Tab.4, it is found that Eavg of RS is lower than that of MS expect for MS1_1.18, and the findings of Eavg of sand agree with those reported by previous research[2,10,14], which indicate that MS is generally more elongated than RS. Also, we observe that E measured by the DIP method agrees with Camsizer(see Fig.12), which indicates that the DIP method is as good as commercial instruments in terms of the sand elongation measurement, but the commercial software has limitations in direct thickness measurement. In addition, it is found that Favg of RS is lower than that of all kinds of MS, which indicates that MS is flatter than RS. Moreover, the data of Ravg implies that RS has a smooth surface and MS is more angular, which is consistent with previous research[2,10,14]. Thus, it can be concluded that the DIP method is able to distinguish sand shape differences in terms of aspect ratios and roundness, and it is suitable for sand shape characterization. As shown in Fig.14, it is found that the packing density decreases with the increase in the aspect ratio except MS4_2.36, which may be due to the fact that MS4_2.36 has a larger size than the others. Combined with the fact that concrete property is affected by the aggregate packing density[10-16], it implies that sand particle shape characterization by the DIP method has important significance for designing concrete proportion and understanding concrete properties.
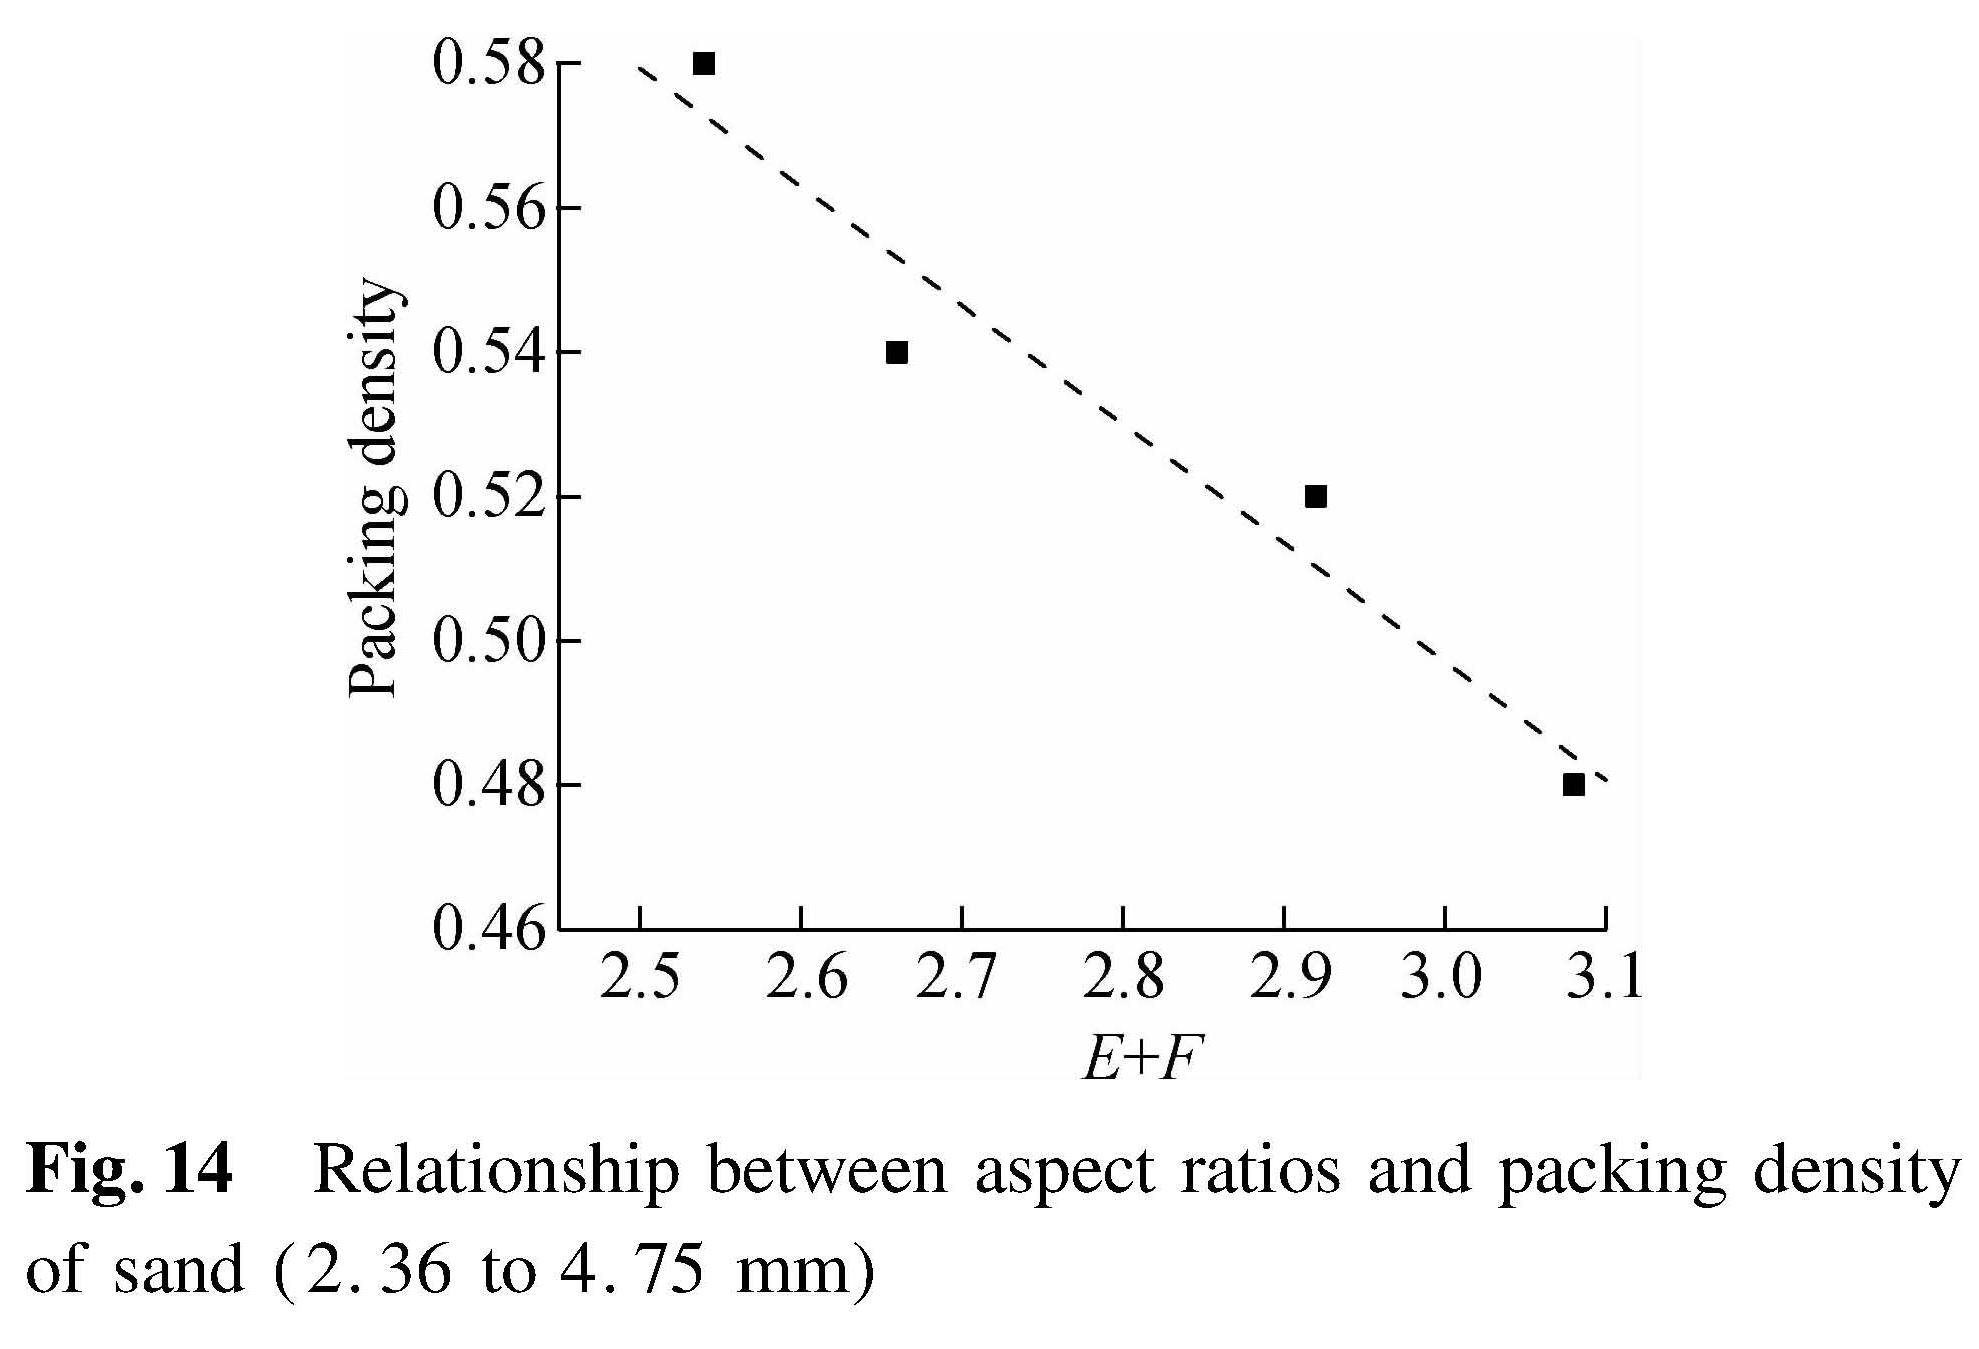
Fig.14 Relationship between aspect ratios and packing density of sand(2.36 to 4.75 mm)
3 Conclusions
1)The DIP method firstly achieves sand thickness direct measurement, which succeeds in describing sand particle flatness.
2)The DIP method is accurate in geometrical shape characterization in terms of aspect ratios and roundness shape indices.
3)The results of sand shape measured by the DIP method are able to represent its overall shape property, which is statistically significant.
4)The DIP method is practical in sand shape characterization, and the measurement results can quantitatively distinguish shape differences in sand.
- [1] Ji T, Chen C Y, Zhuang Y Z, et al. A mix proportion design method of manufactured sand concrete based on minimum paste theory[J].Construction and Building Materials, 2013, 44: 422-426. DOI:10.1016/j.conbuildmat.2013.02.074.
- [2] Shen W G, Liu Y, Wang Z W, et al. Influence of manufactured sand's characteristics on its concrete performance[J].Construction and Building Materials, 2018, 172: 574-583. DOI:10.1016/j.conbuildmat.2018.03.139.
- [3] Lim S K, Tan C S, Chen K P, et al. Effect of different sand grading on strength properties of cement grout[J].Construction and Building Materials, 2013, 38: 348-355. DOI:10.1016/j.conbuildmat.2012.08.030.
- [4] Weng Y W, Li M Y, Tan M J, et al. Design 3D printing cementitious materials via Fuller Thompson theory and Marson-Percy model[J].Construction and Building Materials, 2018, 163: 600-610. DOI:10.1016/j.conbuildmat.2017.12.112.
- [5] Zhang J B, An X H, Nie D. Effect of fine aggregate characteristics on the thresholds of self-compacting paste rheological properties[J].Construction and Building Materials, 2016, 116: 355-365. DOI:10.1016/j.conbuildmat.2016.04.069.
- [6] Vardhan K, Siddique R, Goyal S. Influence of marble waste as partial replacement of fine aggregates on strength and drying shrinkage of concrete[J].Construction and Building Materials, 2019, 228: 116730. DOI:10.1016/j.conbuildmat.2019.116730.
- [7] He Z, Cai R J, Chen E, et al. The investigation of early hydration and pore structure for limestone powder wastes blended cement pastes[J].Construction and Building Materials, 2019, 229: 116923. DOI:10.1016/j.conbuildmat.2019.116923.
- [8] Bakis A. Increasing the durability and freeze-thaw strength of concrete paving stones produced from ahlat stone powder and marble powder by special curing method[J].Advances in Materials Science and Engineering, 2019, 2019: 1-14. DOI:10.1155/2019/3593710.
- [9] Kpniak M, Woyciechowski P, ukowski P, et al. The durability of concrete modified by waste limestone powder in the chemically aggressive environment[J].Materials, 2019, 12(10): 1693. DOI:10.3390/ma12101693.
- [10] Huang Y M, Wang L H. Effect of particle shape of limestone manufactured sand and natural sand on concrete[J].Procedia Engineering, 2017, 210: 87-92. DOI:10.1016/j.proeng.2017.11.052.
- [11] Shen W G, Yang Z G, Cao L H, et al. Characterization of manufactured sand: Particle shape, surface texture and behavior in concrete[J].Construction and Building Materials, 2016, 114: 595-601. DOI:10.1016/j.conbuildmat.2016.03.201.
- [12] Westerholm M, Lagerblad B, Silfwerbrand J, et al. Influence of fine aggregate characteristics on the rheological properties of mortars[J].Cement and Concrete Composites, 2008, 30(4): 274-282. DOI:10.1016/j.cemconcomp.2007.08.008.
- [13] Zhou X W, Liu J Z, Liu G Y, et al. Study of the effect of manufactured sand particle shape on mortar rheological property[J]. China Concrete and Cement Products, 2020(5): 1-5. DOI:10.19761/j.1000-4637.2020.05.001.05.(in Chinese)
- [14] Gonçalves J P, Tavares L M, Toledo Filho R D, et al. Comparison of natural and manufactured fine aggregates in cement mortars[J].Cement and Concrete Research, 2007, 37(6): 924-932. DOI:10.1016/j.cemconres.2007.03.009.
- [15] Li B X, Ke G J, Zhou M K. Influence of manufactured sand characteristics on strength and abrasion resistance of pavement cement concrete[J].Construction and Building Materials, 2011, 25(10): 3849-3853. DOI:10.1016/j.conbuildmat.2011.04.004.
- [16] Aragão F T S, Pazos A R G, Motta L M G D, et al. Effects of morphological characteristics of aggregate particles on the mechanical behavior of bituminous paving mixtures[J].Construction and Building Materials, 2016, 123: 444-453. DOI:10.1016/j.conbuildmat.2016.07.013.
- [17] Masad E, Olcott D, White T, et al. Correlation of fine aggregate imaging shape indices with asphalt mixture performance[J].Transportation Research Record: Journal of the Transportation Research Board, 2001, 1757(1): 148-156. DOI:10.3141/1757-17.
- [18] Masad E, Al-Rousan T, Bathina M, et al. Analysis of aggregate shape characteristics and its relationship to hot mix asphalt performance[J].Road Materials and Pavement Design, 2007, 8(2): 317-350. DOI:10.1080/14680629.2007.9690077.
- [19] Chandan C, Sivakumar K, Masad E, et al. Application of imaging techniques to geometry analysis of aggregate particles[J].Journal of Computing in Civil Engineering, 2004, 18(1): 75-82. DOI:10.1061/(asce)0887-3801(2004)18:1(75).
- [20] Masad E, Button J W, Papagiannakis T. Fine-aggregate angularity: Automated image analysis approach[J].Transportation Research Record, 2000, 1721: 66-72. DOI:10.3141/1721-08.
- [21] Masad E, Button J W. Unified imaging approach for measuring aggregate angularity and texture[J].Computer-Aided Civil and Infrastructure Engineering, 2000, 15(4): 273-280. DOI:10.1111/0885-9507.00191.
- [22] Brzezicki J M, Kasperkiewicz J. Automatic image analysis in evaluation of aggregate shape[J].Journal of Computing in Civil Engineering, 1999, 13(2): 123-128. DOI:10.1061/(asce)0887-3801(1999)13:2(123).
- [23] Moaveni M, Wang S N, Hart J M, et al. Evaluation of aggregate size and shape by means of segmentation techniques and aggregate image processing algorithms[J].Transportation Research Record: Journal of the Transportation Research Board, 2013, 2335(1): 50-59. DOI:10.3141/2335-06.
- [24] Fletcher T, Chandan C D, Masad E, et al. Aggregate imaging system for characterizing the shape of fine and coarse aggregates[J].Transportation Research Record: Journal of the Transportation Research Board, 2003, 1832(1): 67-77. DOI:10.3141/1832-09.
- [25] Zhang D, Huang X M, Zhao Y L. Investigation of the shape, size, angularity and surface texture properties of coarse aggregates[J].Construction and Building Materials, 2012, 34: 330-336. DOI:10.1016/j.conbuildmat.2012.02.096.
- [26] Estephane P, Garboczi E J, Bullard J W, et al. Three-dimensional shape characterization of fine sands and the influence of particle shape on the packing and workability of mortars[J].Cement and Concrete Composites, 2019, 97: 125-142. DOI:10.1016/j.cemconcomp.2018.12.018.
- [27] Lyu K, Garboczi E J, She W, et al. The effect of rough vs. smooth aggregate surfaces on the characteristics of the interfacial transition zone[J].Cement and Concrete Composites, 2019, 99: 49-61. DOI:10.1016/j.cemconcomp.2019.03.001.
- [28] Erdoˇ/gan S T, Forster A M, Stutzman P E, et al. Particle-based characterization of Ottawa sand: Shape, size, mineralogy, and elastic moduli[J].Cement and Concrete Composites, 2017, 83: 36-44. DOI:10.1016/j.cemconcomp.2017.07.003.
- [29] Erdogan S T, Quiroga P N, Fowler D W, et al. Three-dimensional shape analysis of coarse aggregates: New techniques for and preliminary results on several different coarse aggregates and reference rocks[J].Cement and Concrete Research, 2006, 36(9): 1619-1627. DOI:10.1016/j.cemconres.2006.04.003.
- [30] Garboczi E J, Cheok G S, Stone W C. Using LADAR to characterize the 3-D shape of aggregates: Preliminary results[J].Cement and Concrete Research, 2006, 36(6): 1072-1075. DOI:10.1016/j.cemconres.2006.03.017.
- [31] Grigoriu M, Garboczi E, Kafali C. Spherical harmonic-based random fields for aggregates used in concrete[J].Powder Technology, 2006, 166(3): 123-138. DOI:10.1016/j.powtec.2006.03.026.
- [32] Bullard J W, Garboczi E J. Defining shape measures for 3D star-shaped particles: Sphericity, roundness, and dimensions[J].Powder Technology, 2013, 249: 241-252. DOI:10.1016/j.powtec.2013.08.015.
- [33] Jia X D, Garboczi E J. Advances in shape measurement in the digital world[J].Particuology, 2016, 26: 19-31. DOI:10.1016/j.partic.2015.12.005.
- [34] Cepuritis R, Garboczi E J, Jacobsen S. Three dimensional shape analysis of concrete aggregate fines produced by VSI crushing[J].Powder Technology, 2017, 308: 410-421. DOI:10.1016/j.powtec.2016.12.020.
- [35] Cepuritis R, Garboczi E J, Jacobsen S, et al. Comparison of 2-D and 3-D shape analysis of concrete aggregate fines from VSI crushing[J].Powder Technology, 2017, 309: 110-125. DOI:10.1016/j.powtec.2016.12.037.