Zhang Jin,Yan Yan,and Tang Qiuyu.Hub location of air cargo company in air alliance[J].Journal of Southeast University(English Edition) ,2020,36(03):341-348.[doi:10.3969/j.issn.1003-7985.2020.03.013]

基于航空联盟环境节约运输里程的特点,研究了航空货运网络的中转点选址问题.首先引入航线联营选择概率模型,确定不同航段上的联营自营或联营外包的概率; 然后根据选址中心法则,以总成本最小化为目标,建立转运点选址模型,并采用改进的免疫混沌遗传算法求解模型; 最后将建立的模型和算法应用在S航空公司案例中进行了实证分析.结果表明:改进的算法较免疫遗传算法有较强的收敛性,且效果更好; 航空公司在枢纽点数量增多时,枢纽点固定成本增大,但运输成本降低; 枢纽成本的折扣系数越大、航段上飞机固定成本越大、自营成本分摊系数越大,则网络总成本越大; 航空公司选择联盟可降低运营成本,因此航空公司应考虑加入联盟.
Based on the characteristics of the air alliance environment saving transport mileage, the hub location problem of the air cargo network was studied. First, the air alliance selection probability model was introduced to determine the alliance self-operation or outsourcing probability in different segments. Then, according to the location center rule, with the goal of minimizing the total cost, the hub location model was built. The improved immune chaos genetic algorithm was used to solve this model. The results show that the improved algorithm has stronger convergence and better effect than the immune genetic algorithm. When the number of hubs increases, the fixed cost increases, but the transportation cost decreases. The greater the discount factor, the fixed cost, and the self operating cost sharing coefficient, the higher the total network cost. The airline which joins the air alliance can greatly reduce the operating cost of airlines. Therefore, airlines should consider joining the alliance.
With the transformation of economic growth mode and the upgrading of the industrial structure in China, air transport increases cargo transport volume, accelerates the construction of aviation infrastructures, and increases the level of hub airports. Although China's aviation logistics has developed rapidly, it is still in the progression stage and has many shortcomings. Firstly, the scale is small, and the transport capacity is low. Secondly, the logistics enterprises have narrow business scope, mostly still engaged in a single air cargo or freight forwarding and so on. Air cargo volume and timelines have brought new requirements to the development of aviation division.
At present, most scholars focused on the evolution analysis of air cargo and air network [1-2], the location of air hub[3-5], and the optimization of air route networks. Most scholars adopted two methods in the location problem related to this paper. One is the index evaluation method, such as AHP, fuzzy clustering, fuzzy language and other multi-attribute decision-making methods. The other is to establish the location model by the gravity method, center method and linear integer programming. Campbell[6] first proposed to define decision variables based on the path between the starting and ending points. Based on this, a mixed integer programming model for the central hub problem was established, which increased the constraints of variables, simplified the model of the algorithm, reduced the difficulty of solving, and laid the foundation for the construction of a simple algorithm. Since then, most scholars' research has been based on the idea of Campbell. Yang et al.[3] constructed a bilevel programming model to minimize the total transportation cost, and determined the location of the aviation hub and the assignment path of the flight segment. Mohri et al.[7] built a hub location model based on the capacity envelope function, and constructed a new adaptive large neighborhood search algorithm(ALN)to solve practical problems. da Graça Costa et al.[8] established a single hub location model with capacity constraints for hub nodes, and proposed a two-level standard method for solving the model. From the aspect of aviation alliance, the current research mainly focused on the impact on aviation users and airlines, the choice of alliance cooperation mode, the cost-benefit sharing of alliance, the analysis of alliance networks and the construction of alliance networks. Airlines participating in the alliance can reduce costs by sharing facilities, equipment and personnel. At present, there are few studies on the aviation network and hub location of aviation alliance. Wen et al.[9] set up an interactive route network multi-objective model based on the code sharing of aviation alliance, taking into account the factors of flight frequency and cost.
Alliances can create a competitive advantage, reduce costs, and expand the network reach for cargo carriers. Three global alliance clusters emerged, with founding partners located in the major geographic regions, and often already involved in bilateral partnerships with other founders. This study examines how global airline alliances form, with their related expansion of the network reach, resulting in an increase in the profitability for the founding members[10-11]. In this paper, the selection probability of aviation alliance is determined by analyzing the revenue and cost under the competition of aviation alliance.
Hub carriers tend to charge higher fares to their passengers at their hubs. Using the fare data at the Hong Kong International Airport,this paper aims at empirically examining the factors affecting the hub premium for both economy and business class markets. The random effect models are employed in the analysis[12]. A new practical airline green hub location model with hub capacity decision is presented based on airport capacity envelope functions[7]. Therefore, this paper presents a solution to the problem of hub location based on capacity and quantity constraints.
In this paper, the hub location problem of the air cargo network is studied in the air alliance environment. According to the relevant influence of different airlines in the alliance environment, the choice of self-operation or outsourcing of airlines in different routes is analyzed, and the equilibrium probability function of alliance selection is determined. According to the location center rule and direct demand, the model of hub location is established. Considering the chaotic mapping, an improved immune chaotic genetic algorithm(ICGA)is designed to solve the localization problem.
1 Hub Points Location Problem with DescriptionsThe location problem of air logistics nodes can be described as the location and demand of known OD points of freight demand, as shown in Fig.1(a). In order to minimize the cost, the location of q transit points is selected among the P alternative points in M demand points of the aviation network, as shown in Fig.1(b).
Figs.1(a)and(b)illustrate our notation. The demand point is denoted by i,j∈[1,2,…,M]. The demand from origination to destination is represented as Dij. The distance from origination to destination is represented as dij. When there is a transfer point from origination to destination, the distance of the transfer point from origination to destination is dikj=dik+dkj. In the formula, k is the transfer point belonging to [1,2,…,q]; m is the alternative point of the transfer point belonging to [1,2,…,N].
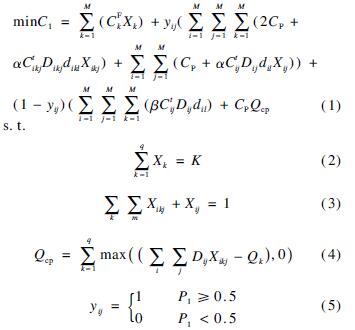
The unit transportation cost is Ctij without transshipment. Ctikj represents the unit transport cost of the transfer point from origination to destination, and θ is the transshipment cost coefficient, so Ctikj=θ1Ctik+θ3Ctkj≈θ(Ctik+Ctkj). CW denotes the unit penalty cost for unattended transportation. CP represents the fixed cost of an airline when it operates on its own, including the cost of loading and unloading operations. cp denotes the penalty costs of the transshipment points exceeding the capacity constraints. Qcp indicates the number of shipments that exceed the capacity limit at the transfer point. CFk denotes the fixed cost required for the construction of transshipment point k. If an airline joins an air alliance, CFk=δ1CFk, and δ1∈(0,1). Xk denotes the probability of point k as transshipment point, which obeys the 0-1 distribution. Xikj denotes the probability of the demand of the transfer point from origination to destination, which follows the 0-1 distribution. Xij denotes the probability of the direct demand from origination to destination, which obeys the 0-1 distribution. Px indicates the probability that other cooperative alliance companies will choose to be self-operating. t represents the coefficient of return. α represents the cost allocation factor of the airline alliance when it operates on its own, and 0<α<1. β represents the cost allocation factor of airline alliance outsourcing,and β>1. Q represents the maximum load of the aircraft. Qk represents the maximum takeoff and landing capacity of an airline at a transfer point. The objective function of the location model is to minimize the sum of the fixed cost of the selected transfer airport and the total freight transportation cost, handling cost and penalty cost that exceed the maximum capacity of the transfer point. The total freight transportation cost and handling cost are related to the operation of the alliance business. When the alliance operates on its own, airlines are required. The operators choose the hub to minimize the business cost. When outsourcing, the airline does not need to consider the transport of the cargo volume in its own air network. Decision variables yij are self-operation for segment selection, and obey the 0-1 distribution. k is the location of transfer points.
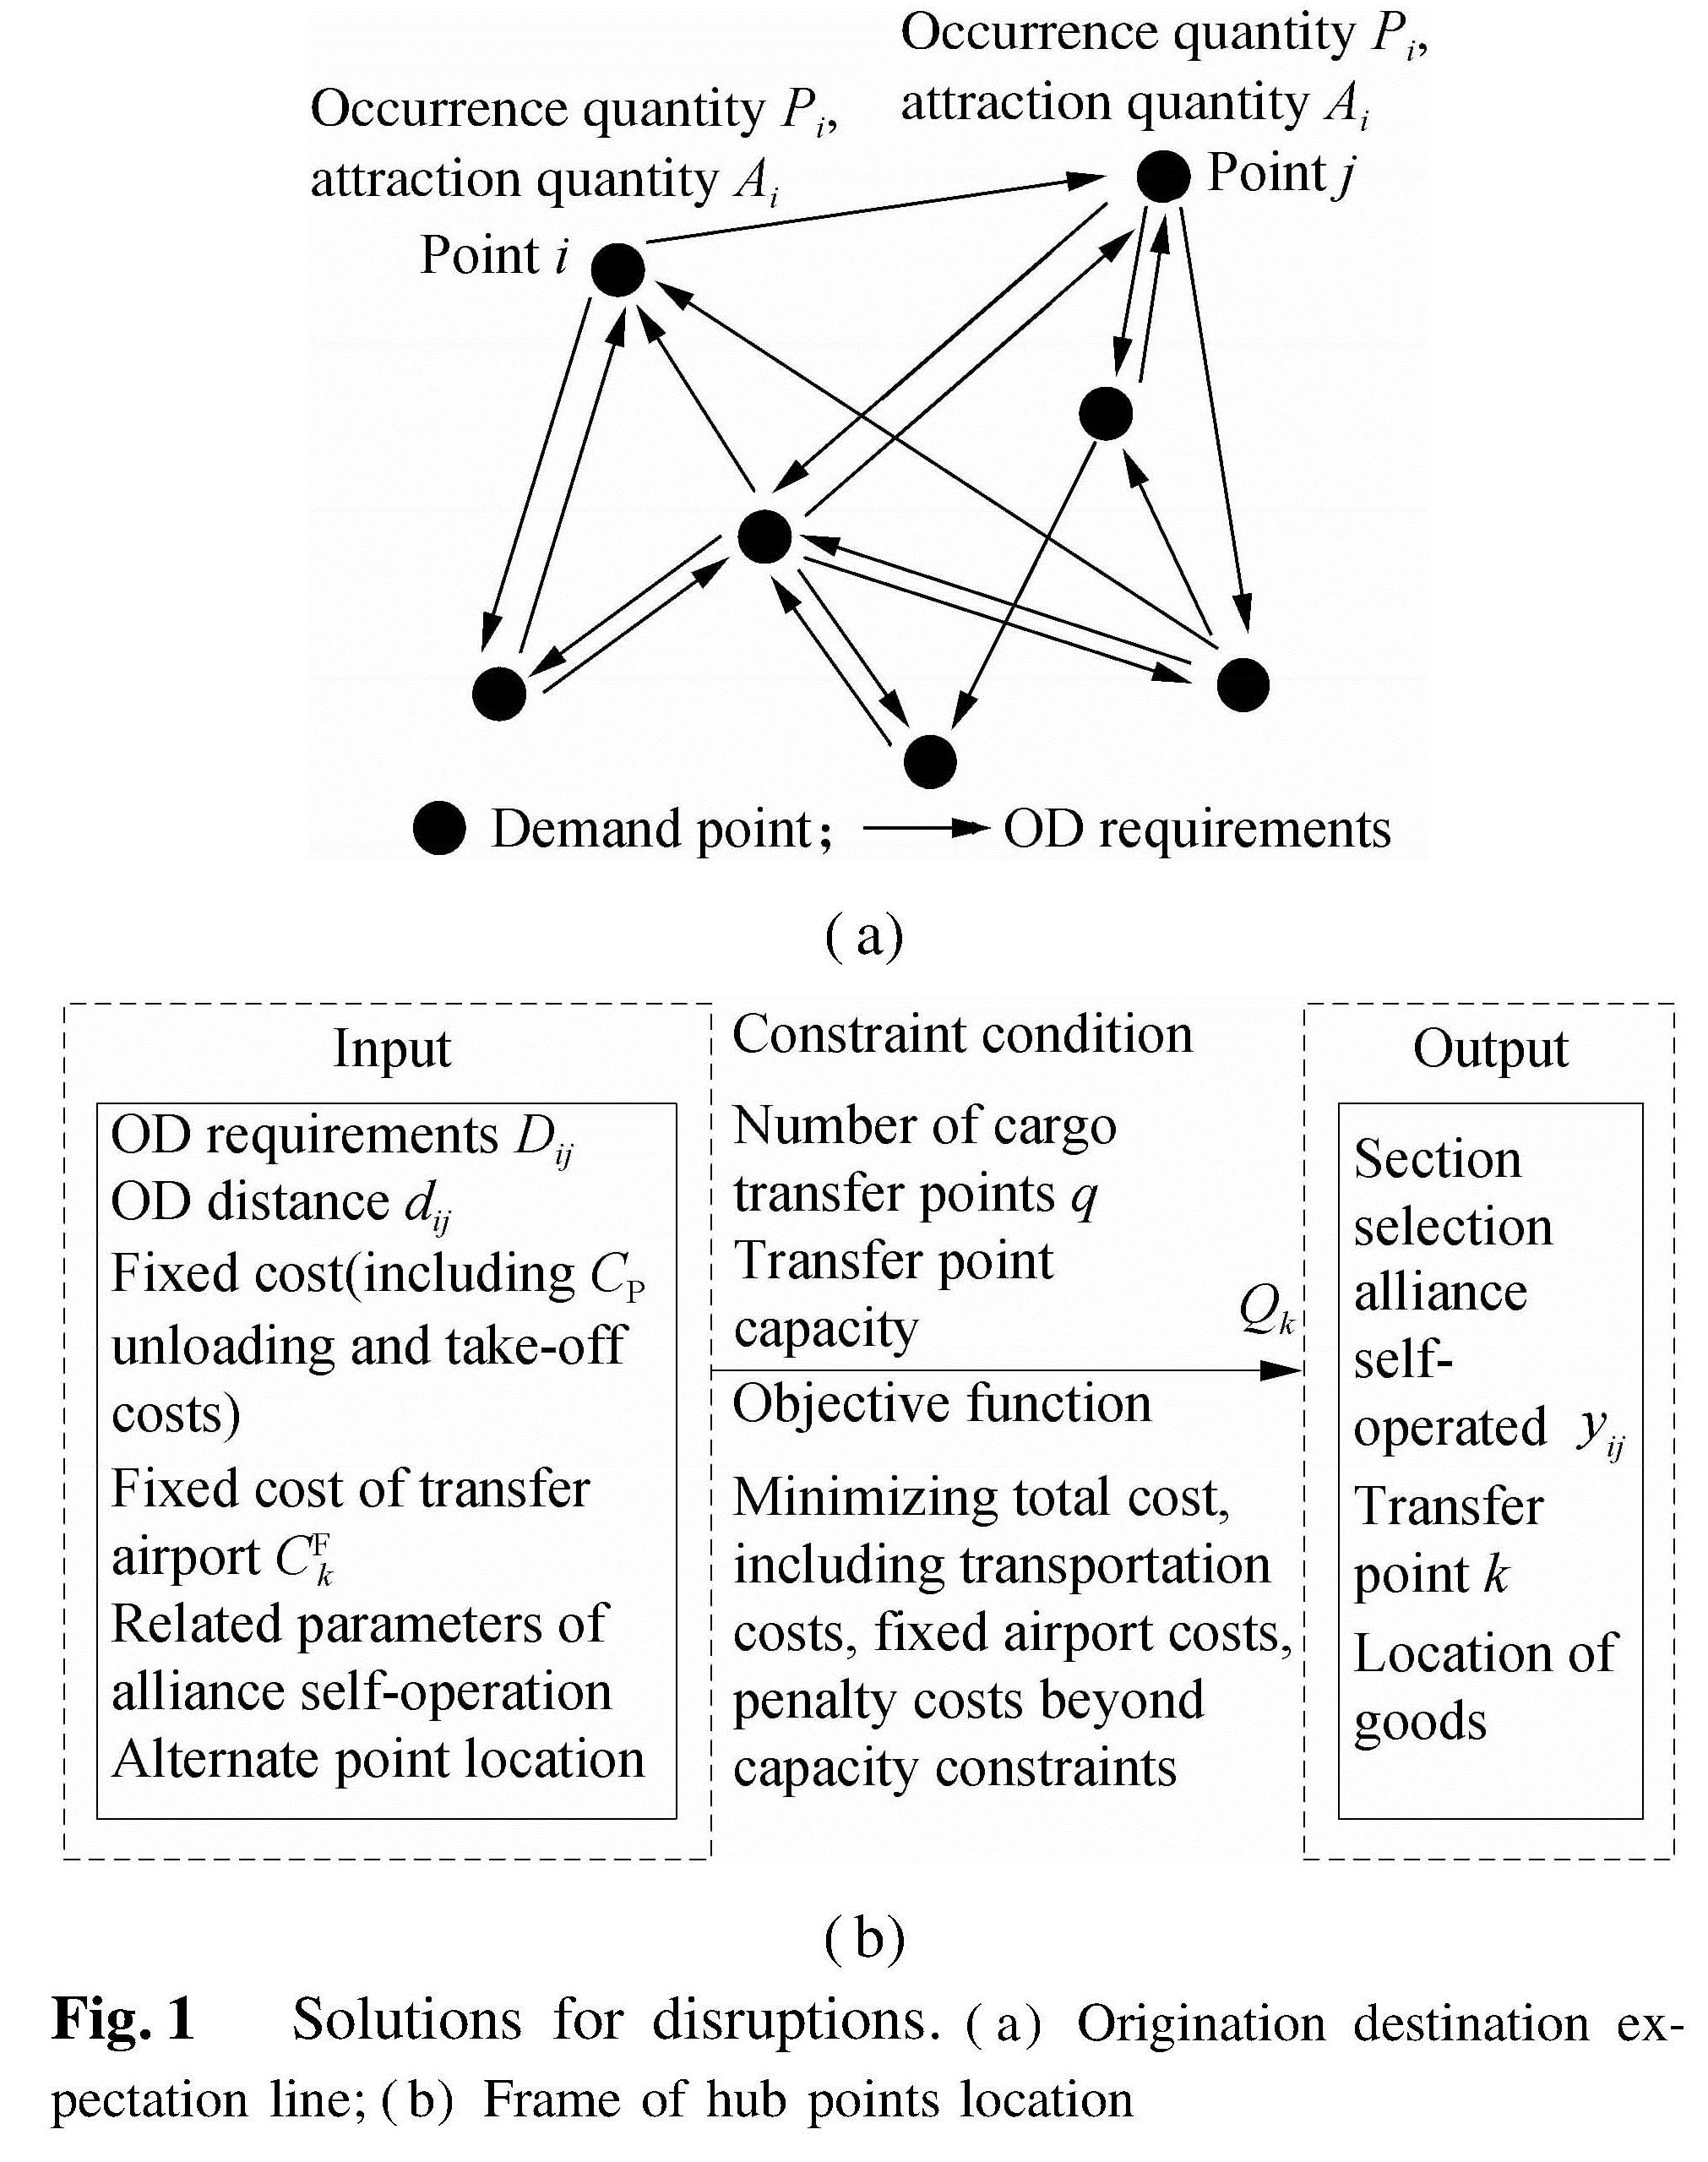
Fig.1 Solutions for disruptions.(a)Origination destination expectation line;(b)Frame of hub points location
We emphasize our assumption that the information is pertinent to air transport. Goods can only be transshipped once at most, since previous studies[7] have shown that two transshipments are almost non-existent. It did not consider the queuing problem of aircraft landing and time waiting costs in the transshipment process to simplify the model without considering the influence of time. The unit transportation cost of each section is the same during the course of transportation. Cargo between any two air nodes can only be transported along a route with the lowest transport cost.
Therefore, according to the hub points location problem, a hub location model is established. The hub location problem can be stated as a central location model problem with side constraints and capacity constraints. The hub location problem(HLP)can be modeled as follows:
Xk={0,1}(6)
Xij={0,1}(7)
Xikj={0,1}(8)
Eq.(2)indicates that the number of transfer points is limited. Eq.(3)denotes that goods between two air nodes can only be completed along one transport route. Eq.(4)indicates that the number of shipments that exceed the capacity limit at the transfer point is limited. 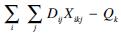 indicates that there is capacity difference between the actual freight volume and specified capacity of transfer point k. Eq.(5)denotes whether alliance is self-operating or not. When the probability of self-selection is greater than 0.5, it will adopt an alliance self-operation, else it will adopt alliance outsource operation. Eqs.(6)to(8)are referred to as the deciding variables. Eq.(6)denotes that the point is a transfer center when the value is 1, else it is not a transfer center when the value is 0. Eqs.(7)and(8)denote the unique path from the demand origination point to the destination point.
When the location model of the aviation hub is established, we need to depict the probability of alliance selection. Airlines choose to join the alliance, and the probability of operation choice on different routes is related to their freight volume and operation choice of other cooperative airlines.
When an airline chooses to self-operate its own alliance, its income is R1=Px[tdDij-(CP+CtdDij)]+(1-Px)[tdDij-(CP+αCtdDij)].When airlines choose outsourcing, the revenue is R2=Px[A4+tdDij-(βCtdDij)]+(1-Px)A8. Among them, A4 and A8 are the loss values when the airline business is abnormal.
Then, the probability that the airline chooses alliance self-operation is P1=(R1)/(R1+R2), and the probability of outsourcing is P2=(R2)/(R1+R2).
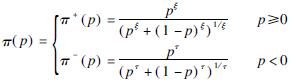
According to the risk aversion problem studied by Rieger et al.[13], the proposed risk aversion prospect theory improves the loss effect.
The degree of risk loss is described by the weight function.
 (9)
(9)
Using the improved value-at-risk function, the risk loss is depicted.
 (10)
(10)
Therefore, the prospect theory model based on the value of risk loss is proposed.
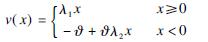
V=∑v(x)π(p)(11)
If the decision maker is more sensitive to losses, then  is greater than 1, else it is less than or equal to 1. λ1 and λ2 denote the degree of concavity and convexity of the value function in gains and losses, 0<λ1,λ2<1. p is the probability. ξ and τ represent the degree of weight change, which also reflect the different attitudes of decision-makers towards returns and risks.
Therefore, A4=(- +
+ λ2CWdDij)(((D1ij+Dij-Q)/Dij)τ)/(((D1ij+Dij-Q)/Dτij+(1-((D1ij+D2-Q)/Dij)τ)1/τ), A8=-
 +
+ λ2CWdDij. Here, D1ij represents the freight volume from the one demand point to another demand point of other cooperative airlines.
The problem to be solved in this section is to determine the point of the transit of goods based on a number of alternative points. Combining the immune algorithm, the genetic algorithm can effectively overcome the premature phenomenon. As the object of this study is large-scale population, it adopts the improved ICGA to effectively improve the calculation efficiency and optimization ability, which can obtain the optimal solution of the problem with a relatively high probability. The immune genetic algorithm(IGA)is an improved genetic algorithm, which improves the selection operation of the genetic algorithm according to the theory of somatic cell and immune network, so as to maintain the diversity of population and improve the global optimization ability of the algorithm. By adding the immune memory function to the algorithm, the convergence speed of the algorithm is improved. The IGA regards antigen as an objective function, antibody as the feasible solution of the problem, and affinity between antibody and antigen as the fitness of the feasible solution. The IGA introduces the concept of antibody concentration, and describes it with the information entropy to express the number of similar feasible solutions in the population. The IGA integrity method is based on the affinity between antibody and antigen and the concentration of the antibody. The antibody with high affinity and low concentration has a high selection rate, which can inhibit the antibody with high concentration in the population and maintain its diversity. Similar to the genetic algorithm, the combination of the immune algorithm and genetic algorithm is also suitable for solving nonlinear and NP hard problems. However, compared with the genetic algorithm, the IGA has higher efficiency and better results. The improved algorithm process steps are as follows.
Step 1 Encoding form and parameter initialization
In this paper, the decision variable is the location of transfer points, so the algorithms use the integer chromosome coding. The number K represents that there are only K transfer points in Fig.2. The gene of every chromosome indicates that which airport is selected as a transfer point. Four transfer points need to be selected. If the number of genes is [1,2,4,10], it represents that the transfer point is the airport of nodes 1,2,4,10.
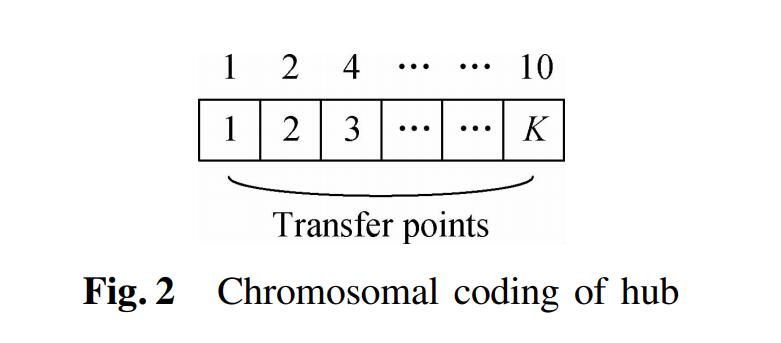
Fig.2 Chromosomal coding of hub
Step 2 Generation of the initial antibody group
It generates M individuals randomly and picks up m individuals to form an initial group from the memory bank, where m is the number of individuals in the memory bank.
Step 3 Solving diversity assessment
According to Eq.(1), the total cost representing the fitness value of the antibody and antigen is calculated. The fitness value A is the lowest total cost of selecting transfer points, including the transportation cost and construction cost of transfer points and so on. Based on the transportation distance and transportation cost, Eq.(3)and Ctikj=θ1Ctik+θ3Ctkj≈θ(Ctik+Ctkj)are introduced into the calculation of fitness value to lay the foundation for optimization. In this process, the capacity of the transfer point can be calculated and determined, and the cost of exceeding the capacity constraint can be calculated according to Eq.(4). According to the probability of the airline choosing self-operation or outsourcing, the value of yij in Eq.(5)is determined.
The antibody concentration C is the proportion of similar antibodies in the M population. The pre-set threshold is that C=1/(M) S, T=0.7. Here, S=1 when S>T, S=0 when S<T.
In the population, the expected reproductive probability P of each individual is composed of the affinity between antibody and antigen and the concentration of the antibody. P=ps(A)/(∑A)+(1-ps)(C)/(∑C), where ps is a constant that represents the diversity evaluation parameter. The higher the fitness value of an individual, the greater the reproductive probability. The higher the antibody concentration, the smaller the reproductive probability.
Step 4 Forming a parental group
The initial population is arranged in a descending order according to the expected probability P. Then, the parent group from the former M individuals is formed, and is stored in the memory bank from the former m individuals.
Step 5 Immune manipulation
A random number in [0,1] interval is generated. If the random number is less than or equal to the cumulative probability of the individual and greater than the cumulative probability of the individual 1, the individual is selected for the offspring population.
According to the crossover probability pc, the crossover operation is carried out by the single point crossover method. It inherits the excellent characteristics of the father generation to the offspring, thus forming new excellent individuals.
Step 6 Chaotic renewal strategy
The chaos mechanism is used to improve the mutation operator, and chaos mapping is used to realize chaotic mutation. Using the hybrid chaos algorithm, the antibody v is mapped into space [0,1] and used as the initial value of chaos of x1. According to the initial position of x1 and organizational variable factors of r, gbest(1)is found and designated as gbest(1)and gbest(0). Through pre-selection operation, the best target function position of gbest(k)can be found from the current location of xk and the previous best position of gbest(k-1).The position of gbest(k)is determined by f(gbest(k))=min(f(x1(k)),f(x2(k)),…,f(xN(k))). The result gbest(k)is found through the discrete reorganization operation and local search around gbest(k)and xk. According to the formula yi(k+1)=yi(k)1+n and xid(k+1)=(xid(k)+(7.5)/(ψd)vi)
exp((1-exp(-ayi(k+1)))(3-ψd(xid(k)+(7.5)/(ψd)vi)))+(7.5)/(ψd)vi+(gbestd(k)-xid(k))exp(-2ayi(k+1)+b), update location and organizational variables. In order to reduce the possibility of leaving the search area during the search process, let xid(k+1)=min(ωd/2,max(-ωd/2,xid(k+1)). Map xid(k)to the solution space, complete the chaotic mutation process and obtain the mutated antibody v'.
Step 7 Generating new populations
After immunization and variation, a new population is obtained. Then, the individual with memory is extracted from the memory bank to form a new generation of population and go to step 3.
Step 8 If the maximum number of iterations is not reached, go to step 3; otherwise, output the optimal solution and terminate the algorithm.
3 Computational Examples3.1 Basic conditions and parameter settingsWhen S Airlines are in operation, the profit coefficient t=2.5, self-operating sharing coefficient α=0.6, outsourcing sharing coefficient β=1.6. The construction cost CFk of the transfer point obeys a uniform distribution that is U(20 000, 40 000). The transfer point construction discount coefficient δ1=0.8. The unit transportation cost every ton and 100 km Ct=330 yuan. The transshipment cost coefficient θ=0.8. The transfer point number q=6. The maximum weight of the aircraft is Q=30 t. The fixed cost on the aircraft section is CP=25 000 yuan, including the depreciation, loading and unloading fees, landing fees, and so on. The unit cost of loss without a carrier every ton and 100 km CW=100 yuan. The limited capacity of the transshipment point Qk=400 t. The penalty cost exceeding the capacity limit for the transshipment point cp=40 000 yuan. The optional collection of freight network hub points is an aggregate including Shenzhen, Guangzhou, Wuhan, Chengdu, Shenyang, Beijing, Zhengzhou, Hangzhou, Xi'an, and Shanghai. It is assumed that the probability of other cooperative Airlines choosing their own business follows a uniform distribution U(0,1)and the freight volume follows a uniform distribution U(0,20). This paper takes the air cargo volume on a certain day in 2018 of 38 cities of the S cargo carrier as an example. We selected the OD matrix partial data of air cargo volume, as shown in Tab.1.
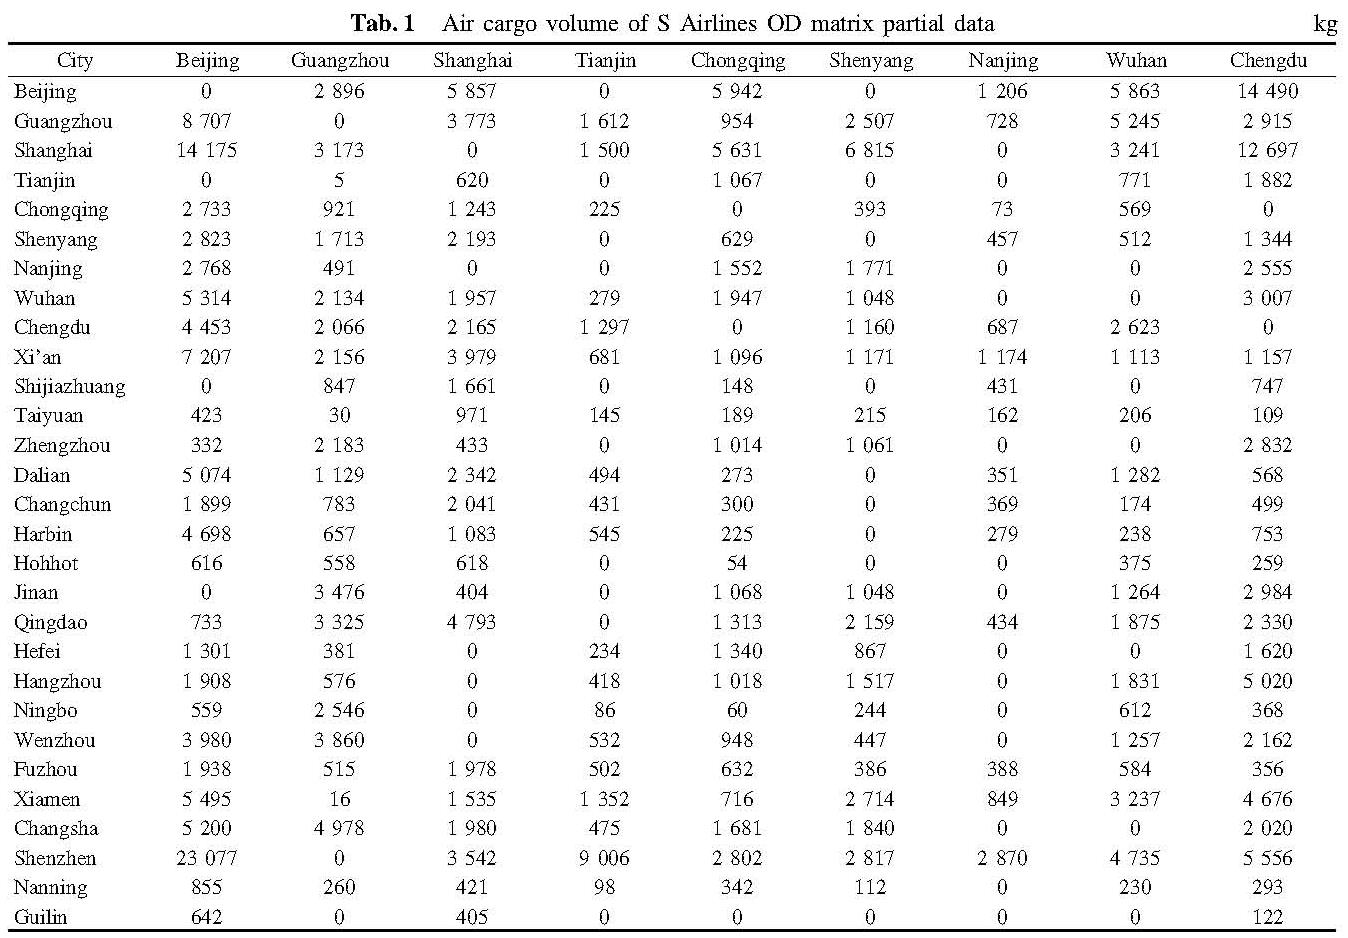
Tab.1 Air cargo volume of S Airlines OD matrix partial data kg
3.2 Calculation results
We used MATLAB R2016b software to run the improved ICGA on Inter Core i7-8550U CPU @ 1.80 GHz, 8.00 GB memory computer. The specific parameters of the algorithm are as follows: The population size N=50; memory capacity is overbest Γ=10; crossover probability pc=0.5; mutation probability pm=0.4; the maximum iteration number G=100; diversity evaluation ps=0.95.
The convergence of the algorithm is shown in Fig.3. In the 36th generation, the algorithm converges, which indicates that the degree of convergence of the improved algorithm is strong. The result shows that the number of hub locations is(2,4,5,6,7,8), so the hub locations are Guangzhou, Chengdu, Shenyang, Beijing, Zhengzhou and Hangzhou. At the same time, the total cost is 701 768 yuan.
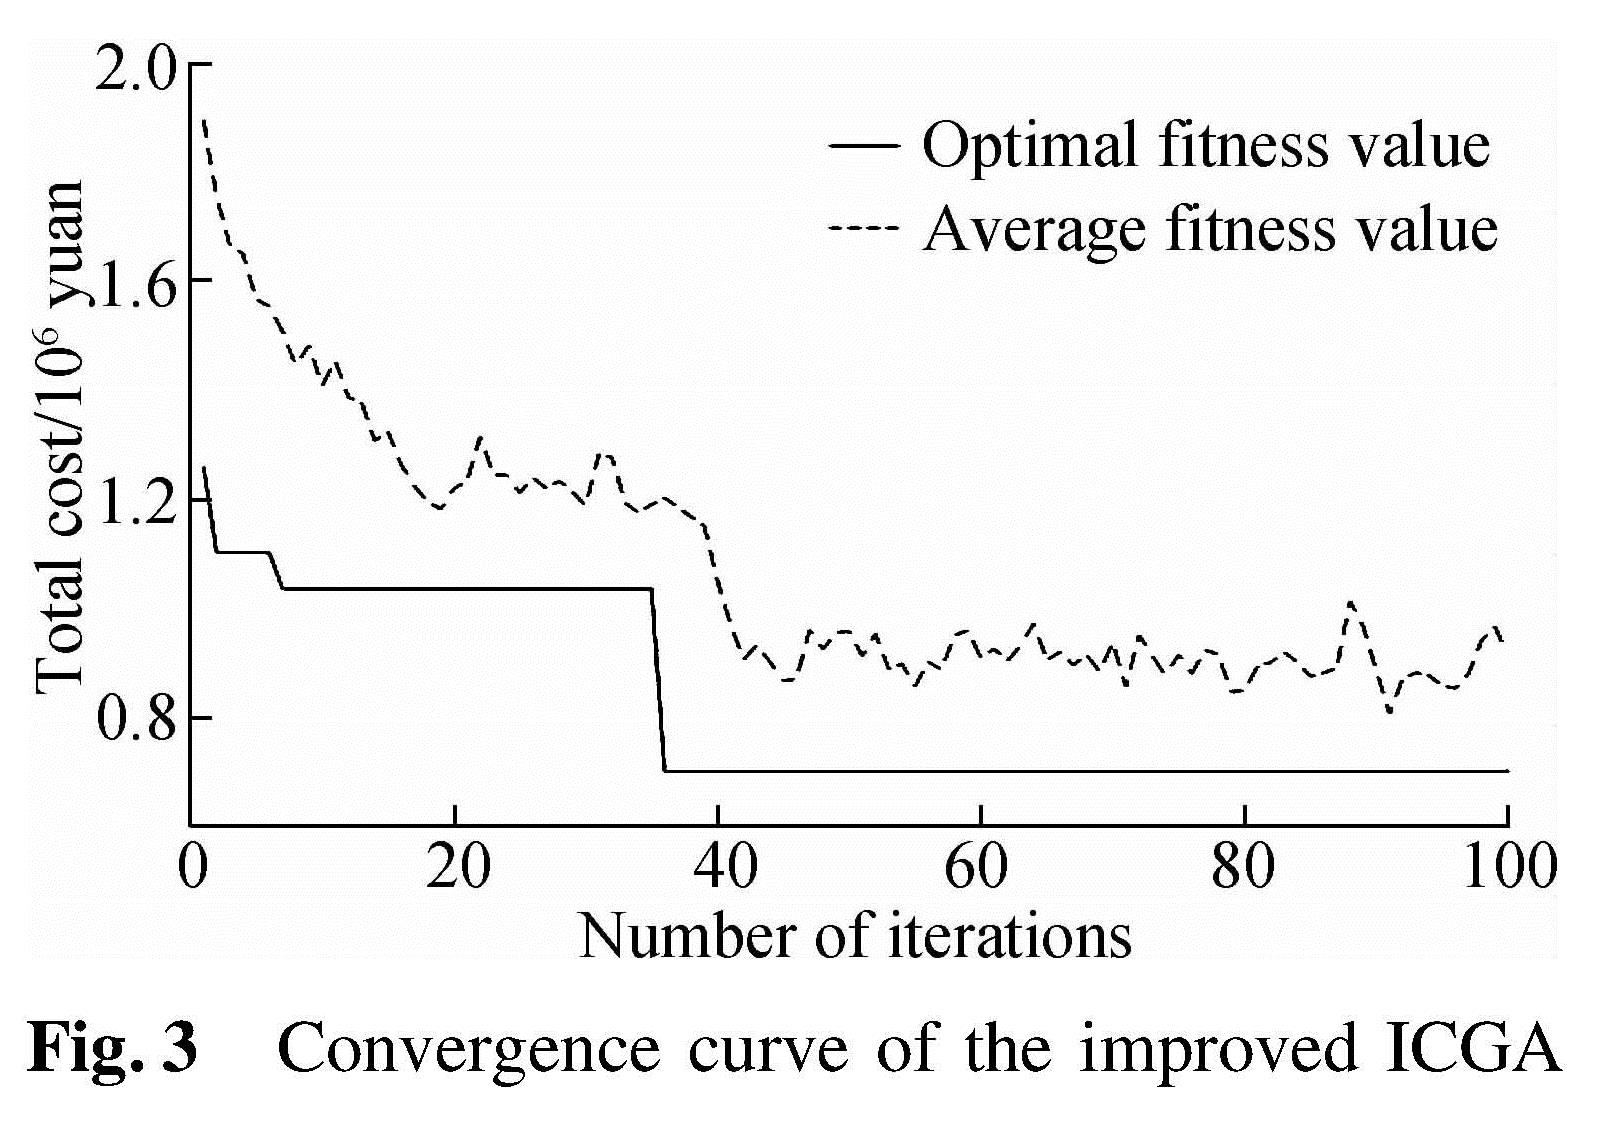
Fig.3 Convergence curve of the improved ICGA
3.3 Algorithmic comparison
In this paper, the ICGA is improved. Compared with the IGA, it has two main advantages. One is stronger iterative convergence and the other is a better fitness value. The algorithm comparison results are shown in Fig.4.
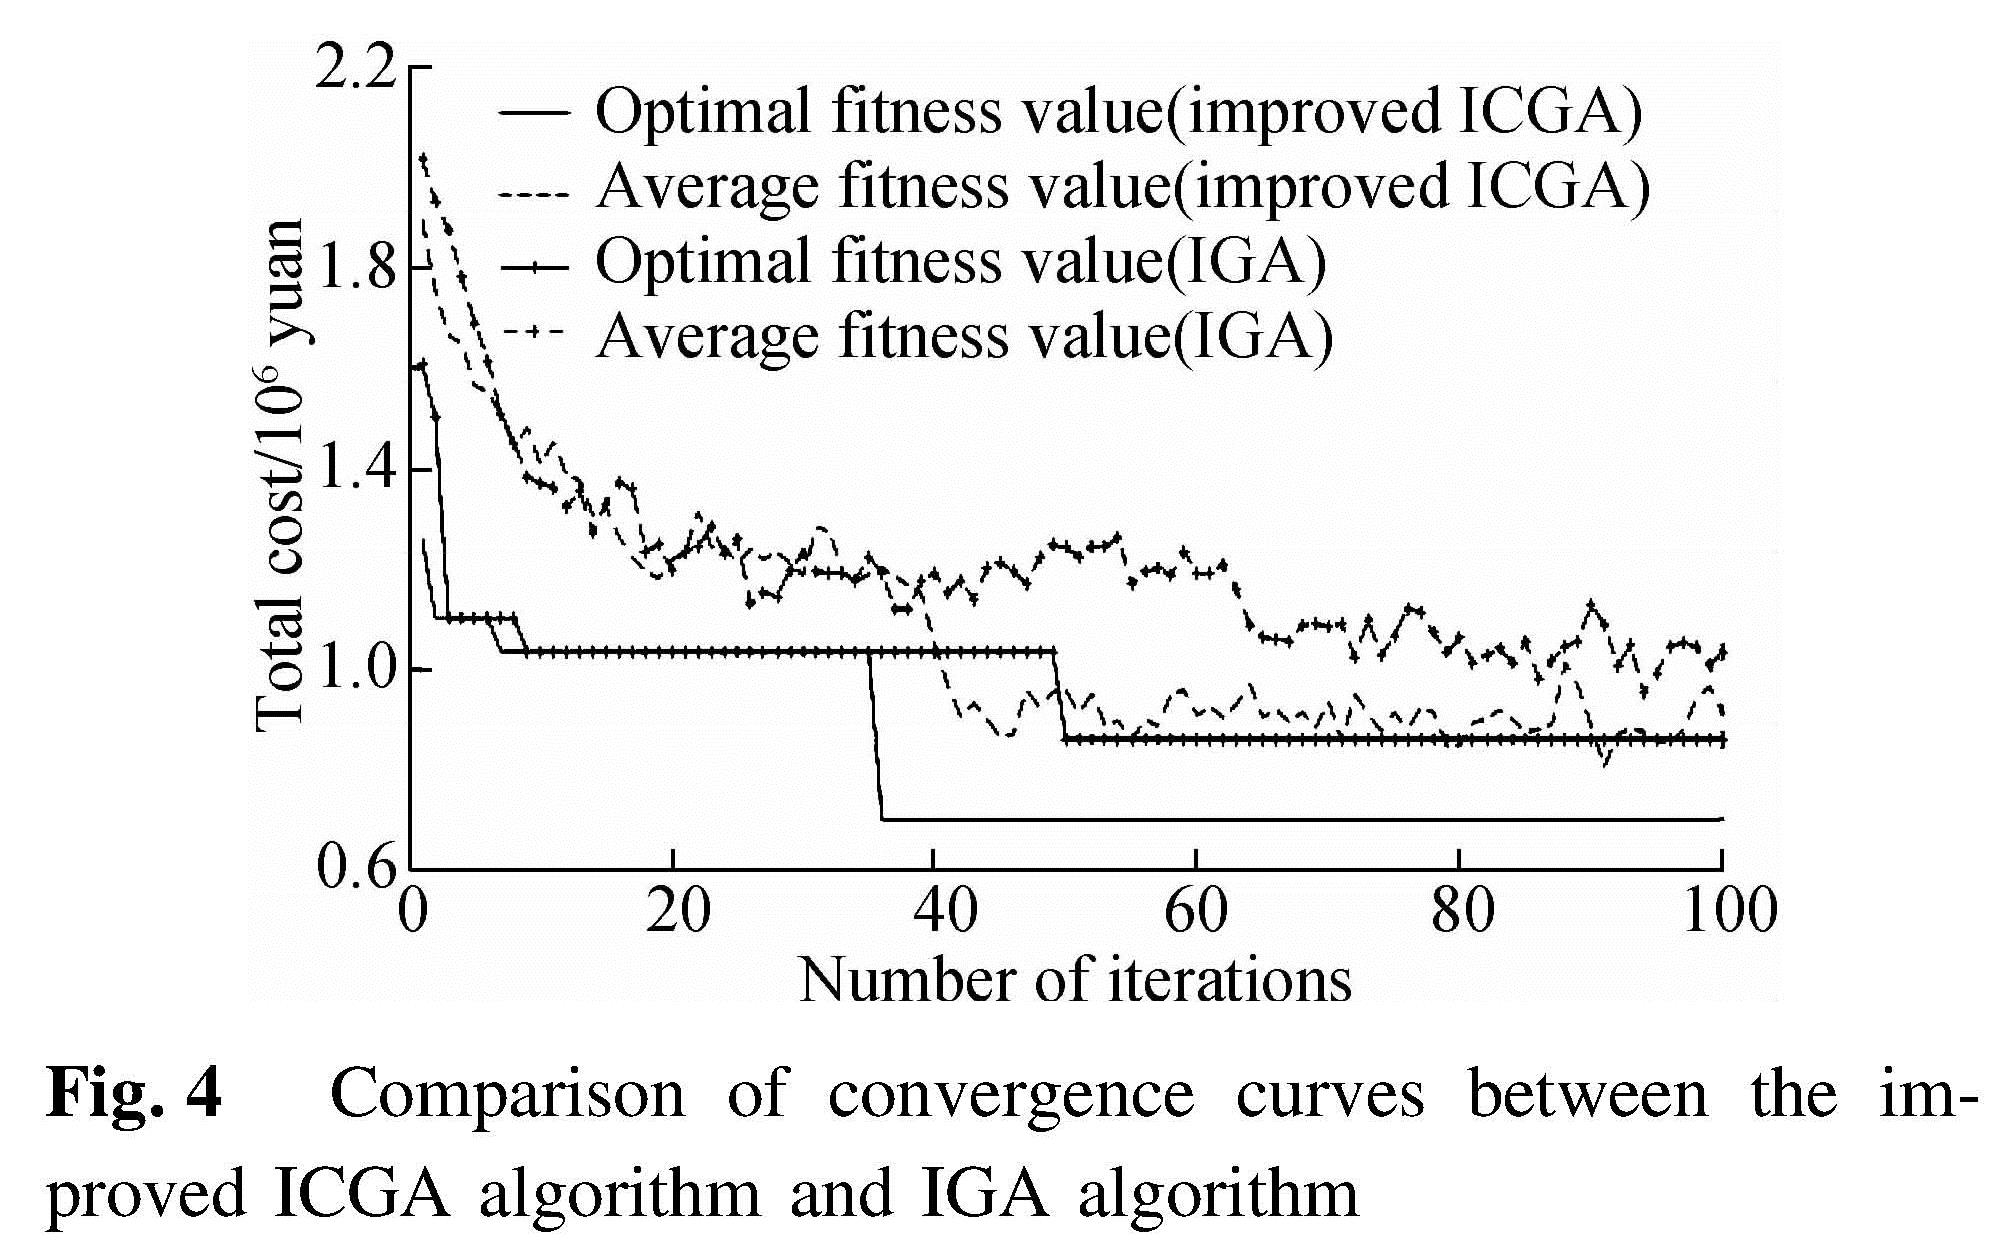
Fig.4 Comparison of convergence curves between the improved ICGA algorithm and IGA algorithm
Comparing the improved algorithm with ICGA, IGA and CPLEX, it can be found that the improved algorithm in this paper has a faster calculation speed, and the difference between the calculation results and the solution is smaller, as shown in Tab.2. Therefore, in large-scale operations, the algorithm designed in this paper has certain applicability.
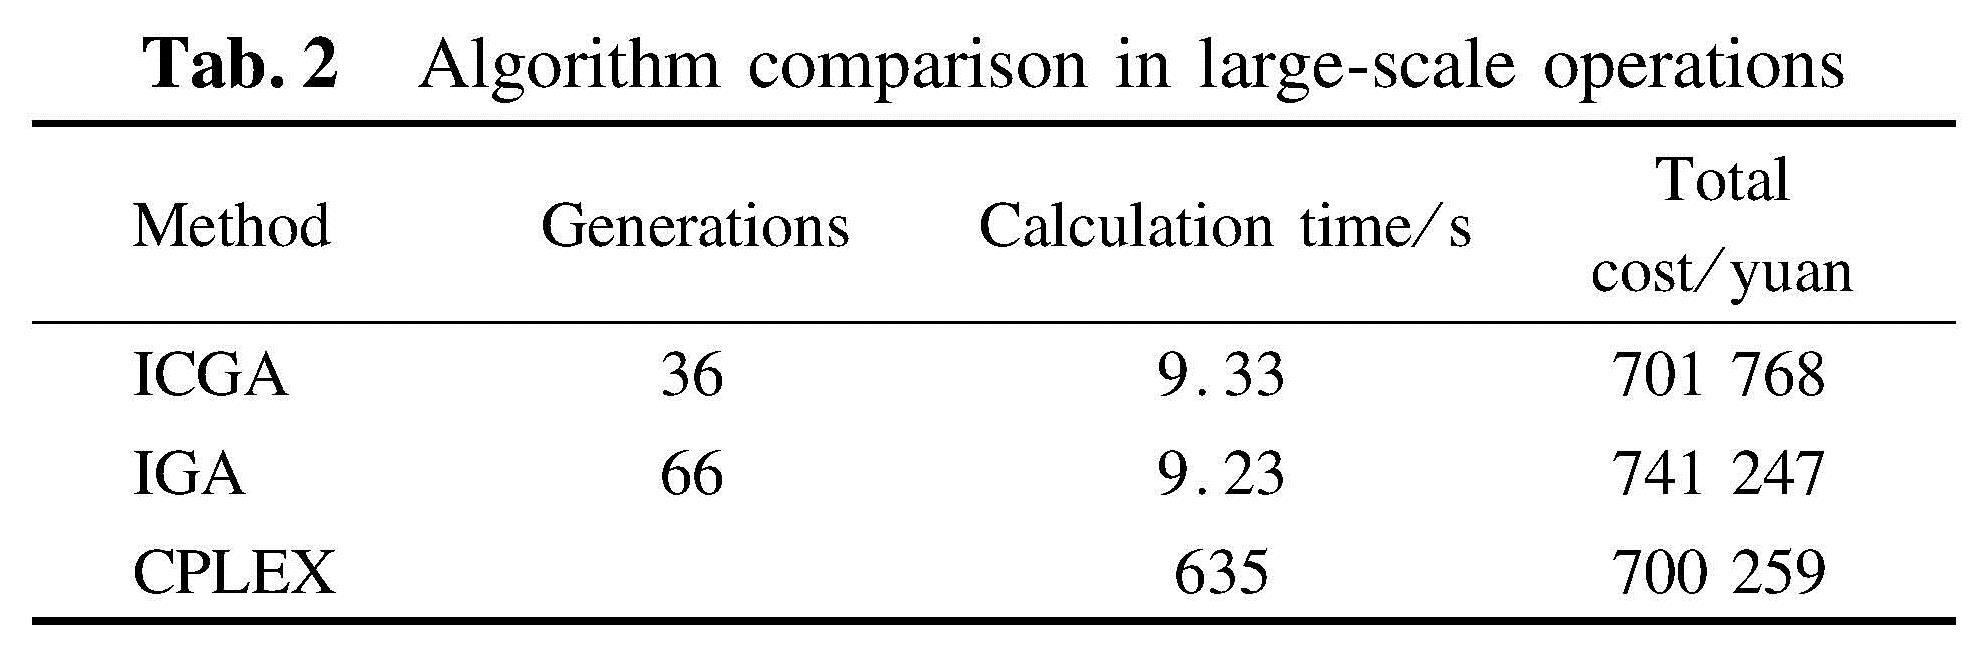
Tab.2 Algorithm comparison in large-scale operations
In Tab.3, the data of 38 cases is divided into 5 groups:(1,6,11,16,21,26,31,36),(2,7,12,17,22,27,32,37),(3,8,13,18,23,28,33,38),(4,9,14,19,24,29,34), and(5,10,15,20,25,30,35). The comparison between the calculation results and speeds of different algorithms in small-scale examples is shown in Tab.3. The solver solution in small-scale examples is obviously superior to the heuristic algorithm in terms of calculation speed, and the results are similar in terms of calculation results.
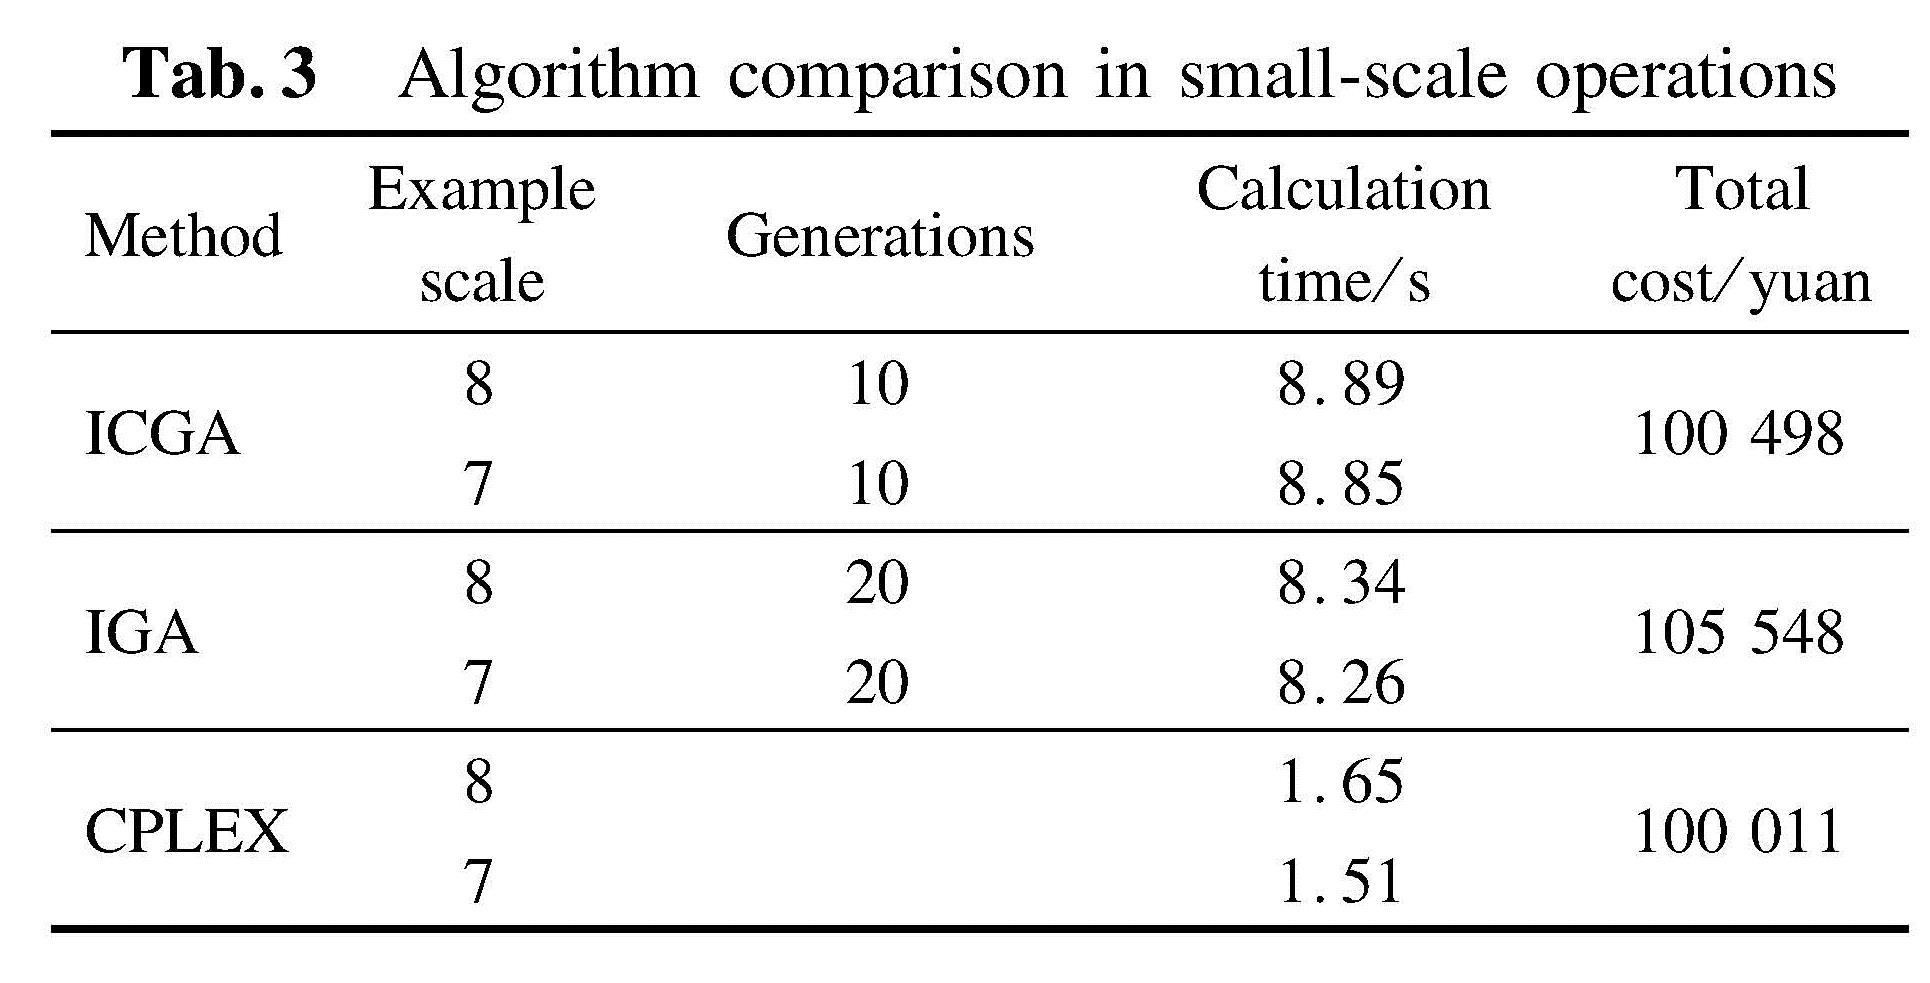
Tab.3 Algorithm comparison in small-scale operations
3.4 Sensitivity analysis3.4.1 Transshipment cost coefficient θ
When the coefficient of transshipment cost θ becomes smaller, the cost of transshipment chosen on behalf of airlines will become smaller. At this time, the cost affected by different transshipment coefficients θ={0.7,0.8,0.9} is shown in Fig.5. As a result, when the coefficient of transshipment cost θ increases, the total cost also increases. Therefore, the smaller the coefficient of transshipment cost θ, the more frequent the transshipment of alliances, and the location of the transfer point remains unchanged.
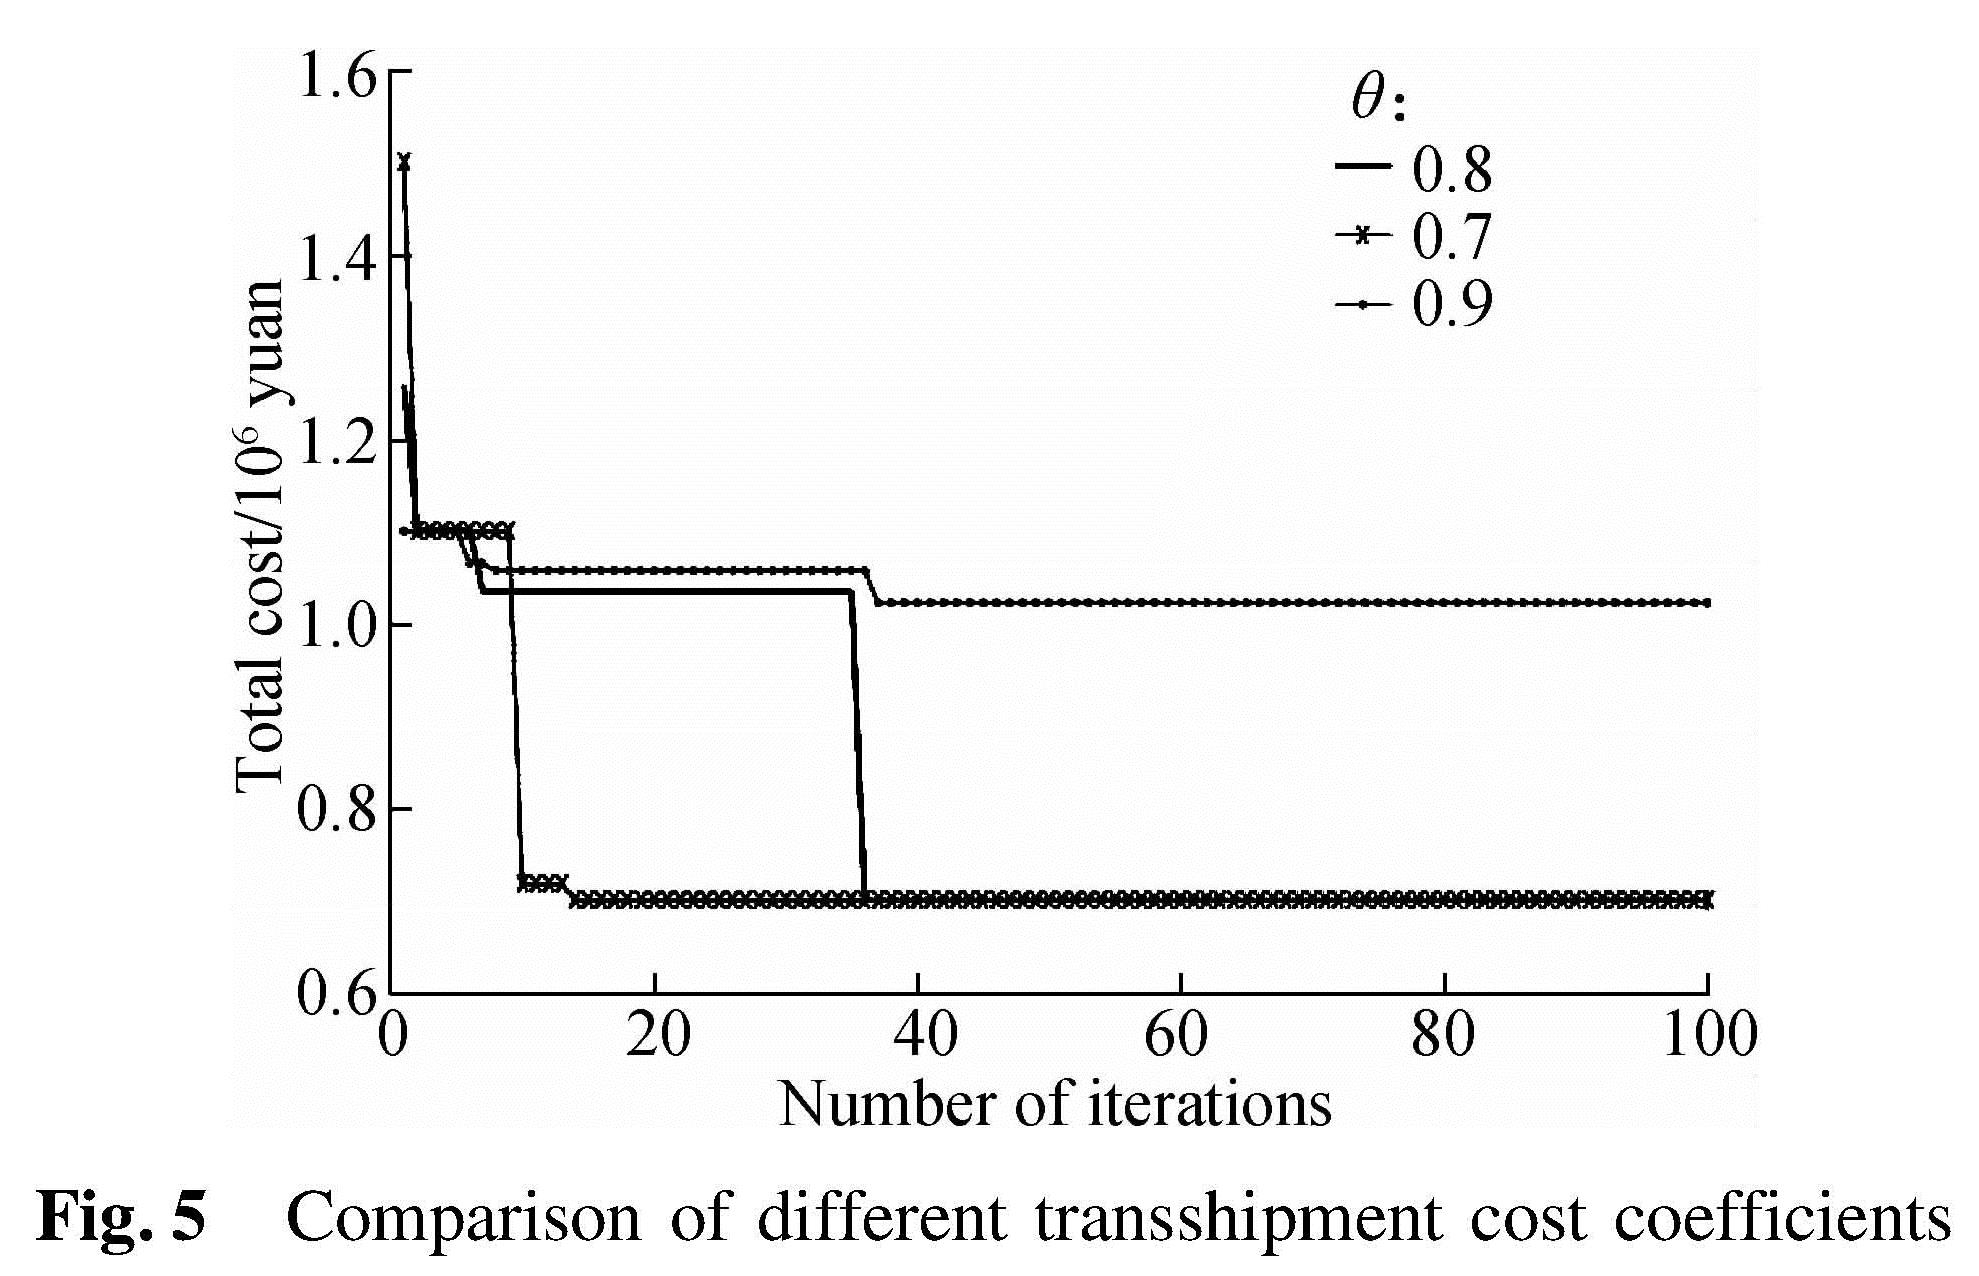
Fig.5 Comparison of different transshipment cost coefficients
3.4.2 Number of transfer points q
Under the constraints of different numbers of transfer points, the results of the transshipment location of the airline freight network are shown in Tab.4. When q=6, the total cost is the lowest. Therefore, the optimal number of hub locations for S Airlines is 6. At the same time the total cost is 701 768 yuan. It shows that when the number of transfer points increases, the fixed cost of transfer points increases, but the variable cost including the transportation cost decreases with the increase in transfer points. The total cost decreases when the number of transfer points is increased.
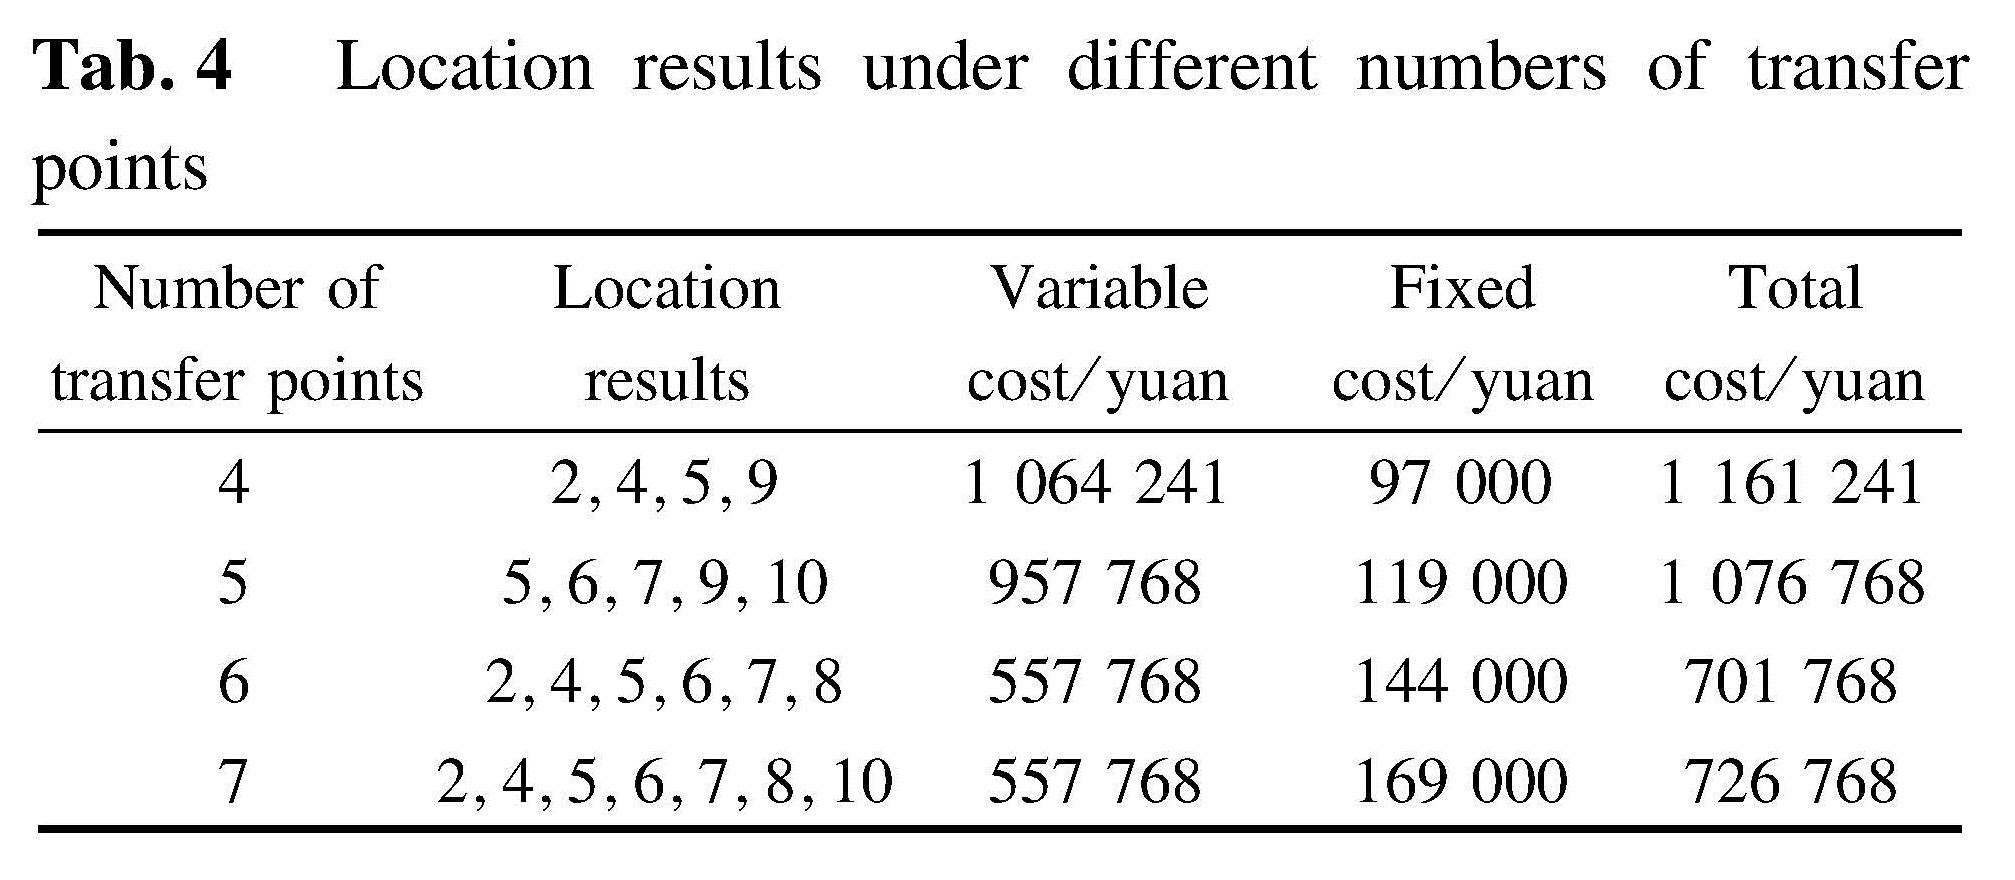
Tab.4 Location results under different numbers of transfer points
3.4.3 Fixed cost on aircraft section CP
When the fixed cost of different segments of an aircraft changes, it affects the total cost of self-operation of the segment.The impact of fixed cost Cp={10 000,15 000,20 000,25 000,30 000} on the total cost is analyzed as shown in Fig.6. It can be seen that with the increase in the fixed cost in the flight segment, the total cost of the network increases.
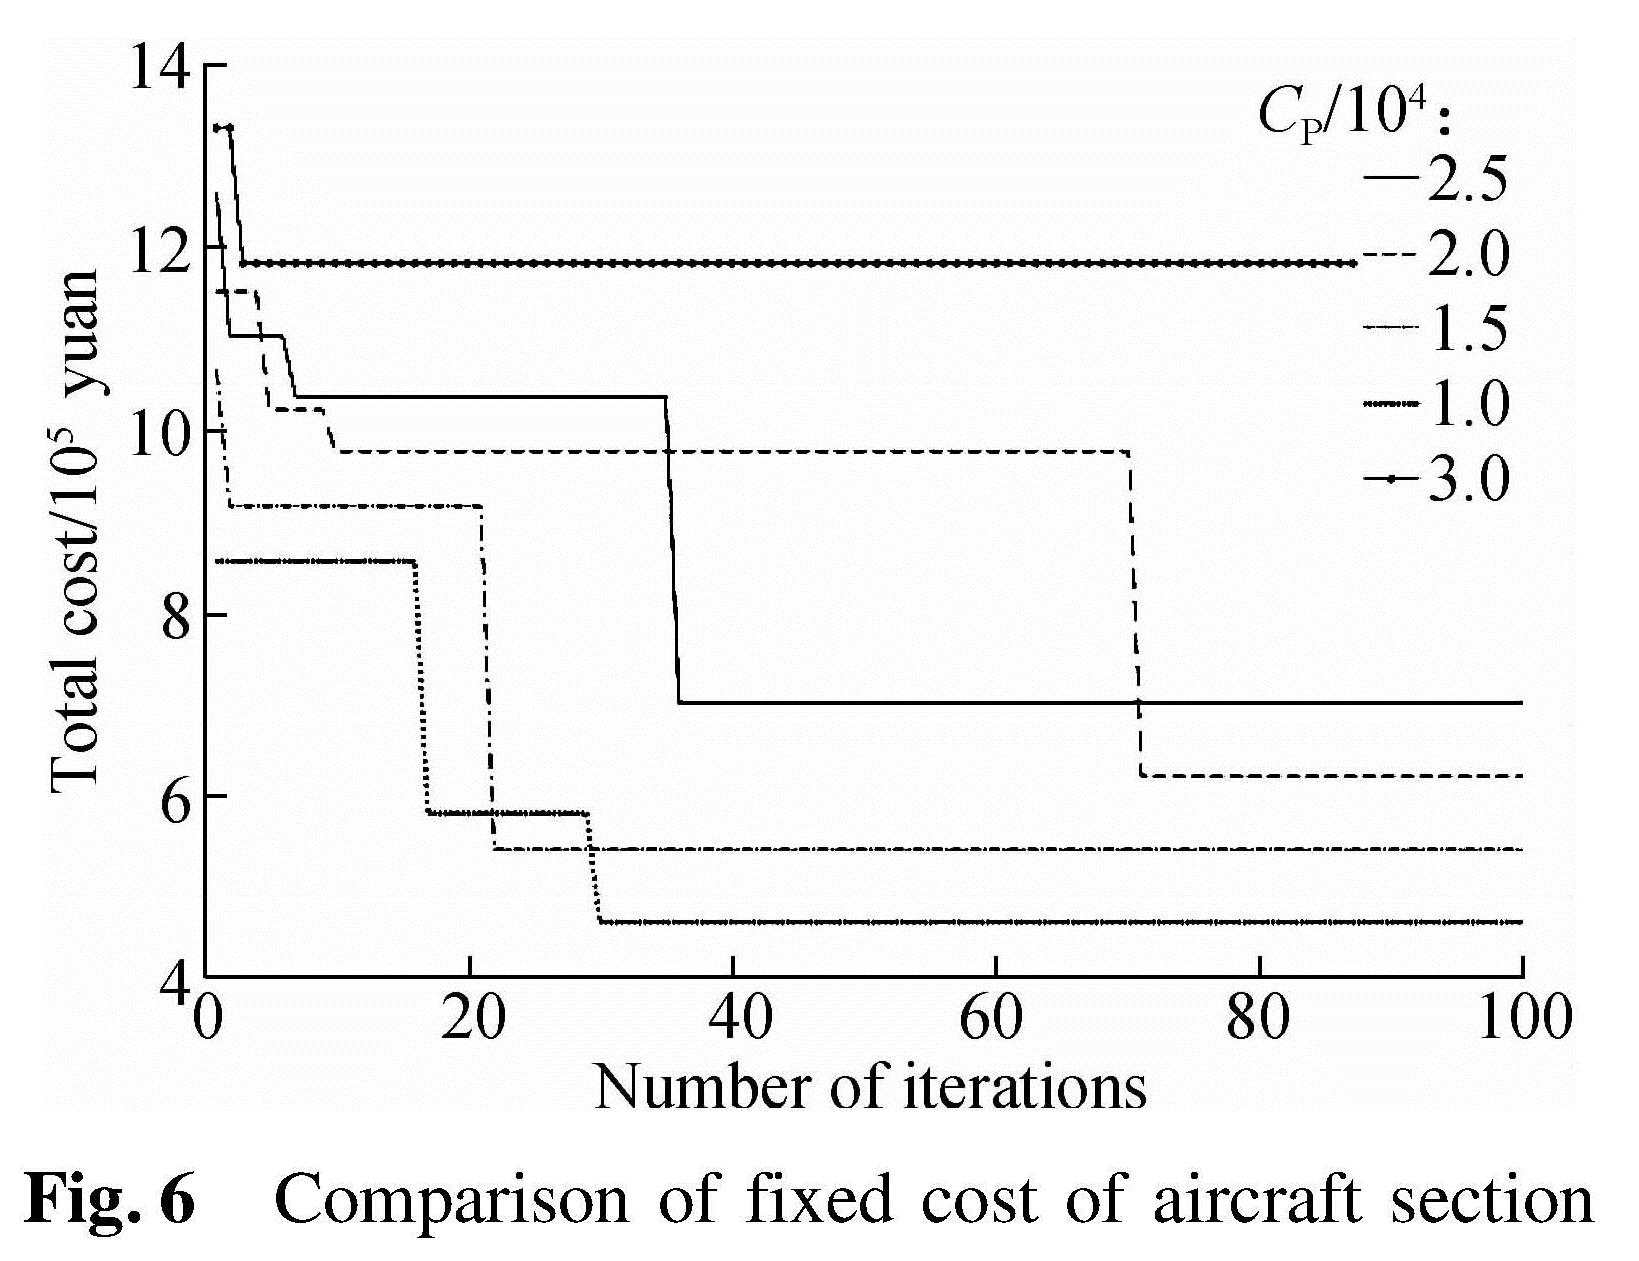
Fig.6 Comparison of fixed cost of aircraft section
3.4.4 Cost-sharing coefficient α and β
When the coefficients of alliance self-operation and alliance outsourcing change, the decision-making of S Airlines will also change.The optimal results with different values of α and β are shown in Fig.7. It is found that the larger the cost of self-operation α, the smaller the probability of S Airlines choosing self-operation, the higher the total cost; the smaller the cost of outsourcing β, the smaller the probability of S Airlines choosing self-operation, the higher the total cost.
3.4.5 Decision on whether S Airlines join an airline alliance or notAira lliance can increase the efficiency of a airline company due to the shortage of airlines and the small volume. When S Airlines do not join the air alliance, the total cost is obviously higher than that of joining it, as shown in Fig.8. The transportation cost of an aviation alliance is one third of self-operating aviation. However, the fixed cost of aviation alliance is similar to that of self-operating aviation. Therefore, the airline alliance is conducive to reducing the cost of enterprises. The S Airlines relying on the alliance can significantly reduce the cost.
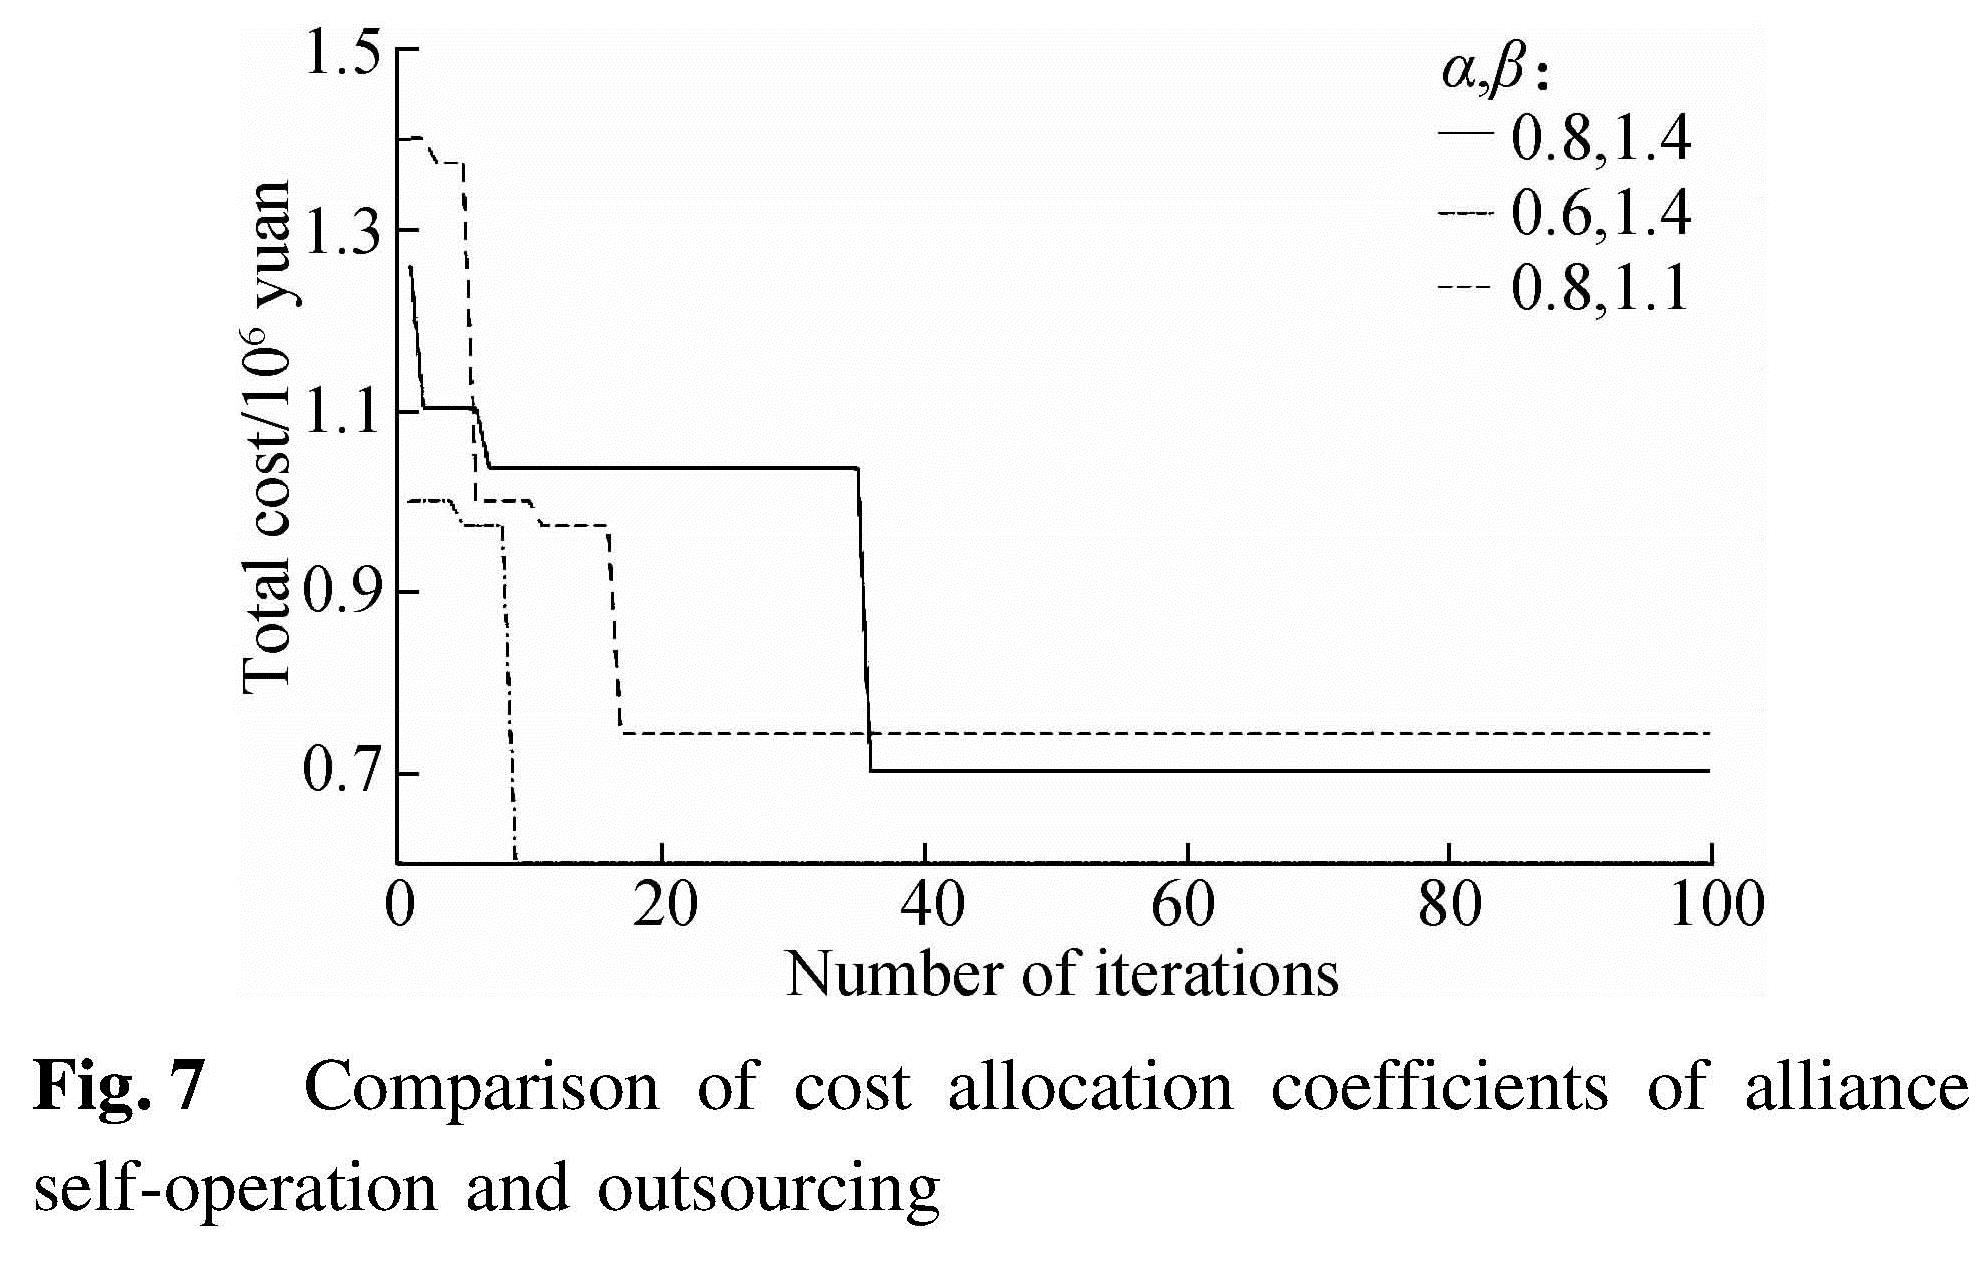
Fig.7 Comparison of cost allocation coefficients of alliance self-operation and outsourcing
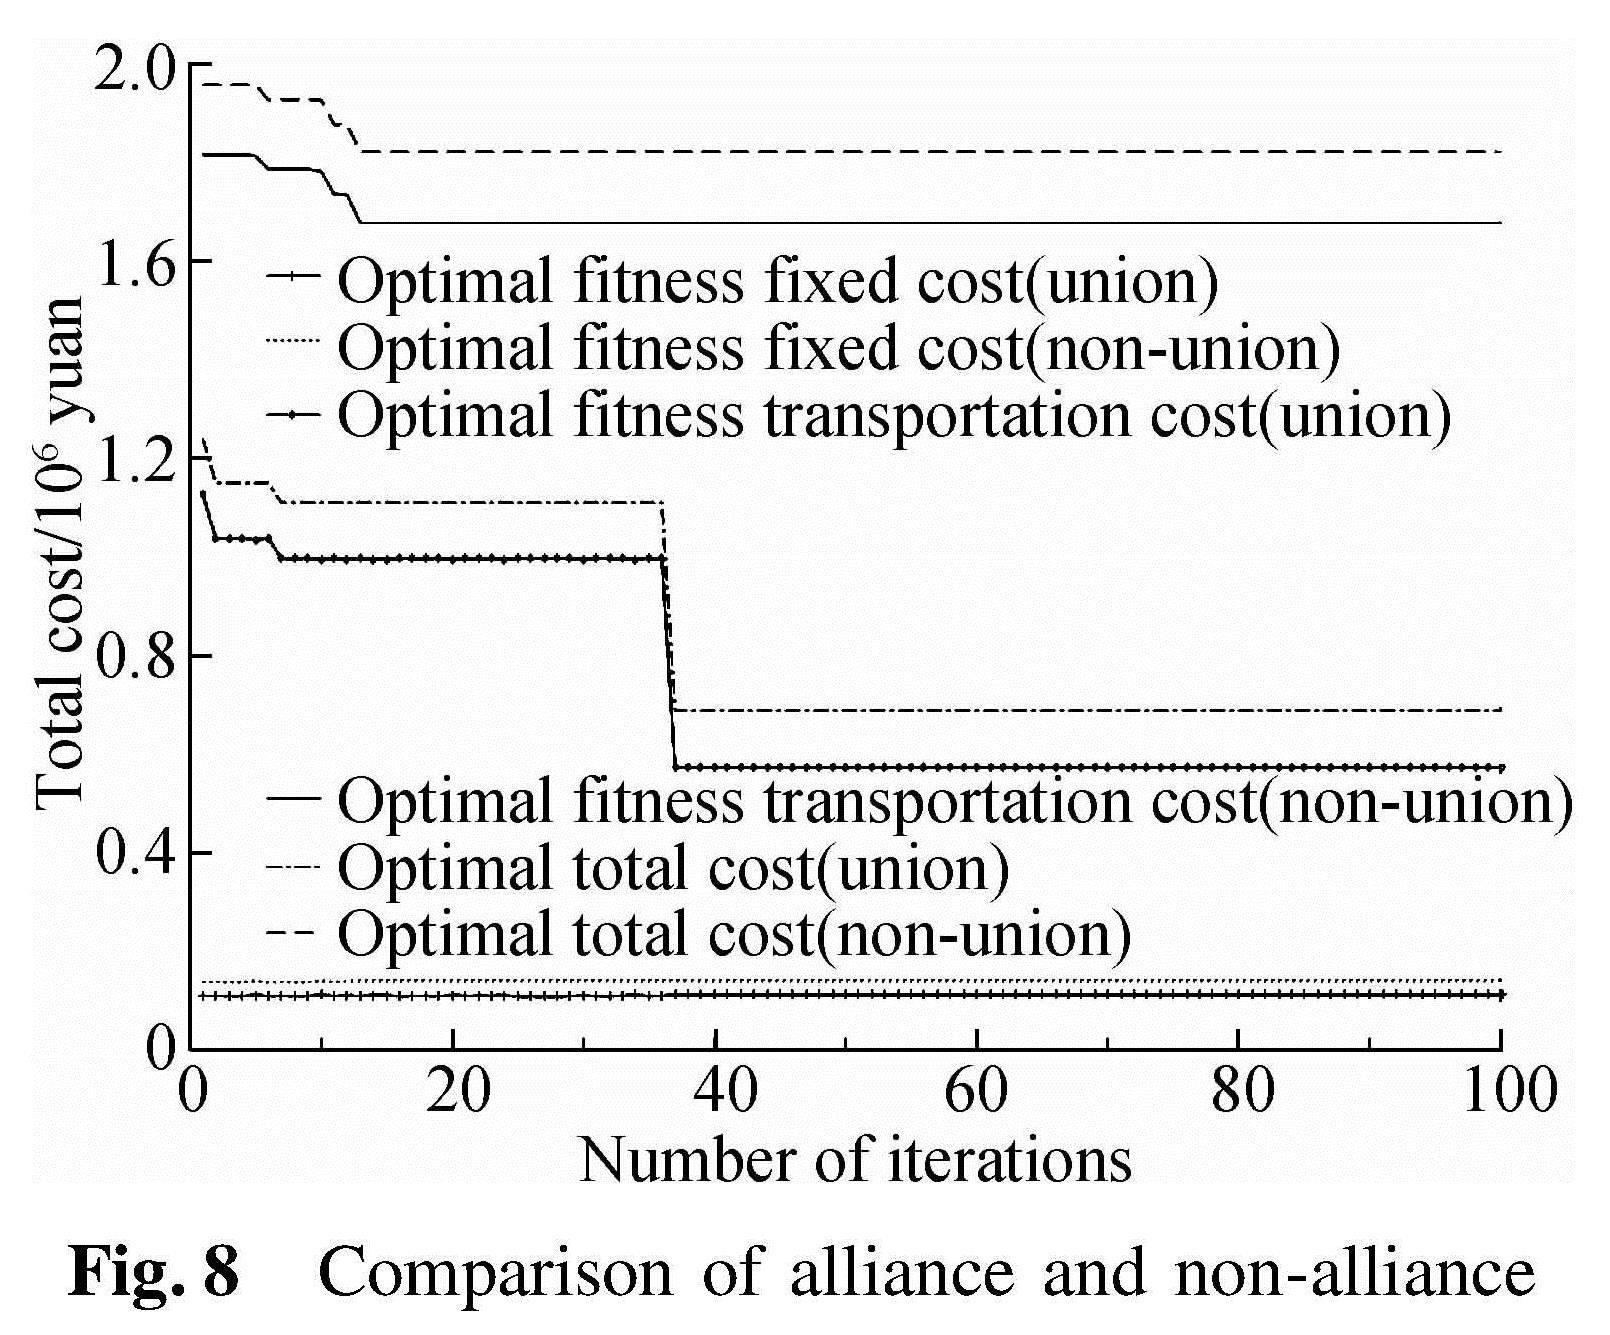
Fig.8 Comparison of alliance and non-alliance
4 Conclusions
1)The probability model of alliance selection that explicitly considers the wishes of policy makers is proposed. The probability of alliance self-operation or outsourcing on different segments are determined.
2)The improved ICGA increases the calculation efficiency and optimization ability, which can be used to solve large-scale nonlinear optimization problems. In the small-scale analysis, there is a certain gap between the calculation result and speed of the improved ICGA and the accurate algorithm.
3)The total cost is the lowest when the optimal number of hub location is 6. The guidance provides a basis for entrepreneurs' decision-making. Decision makers can dentify better airline segment adopting self-operations. However, there is still a gap between the guidance of the improved algorithm and that of the precise algorithm.
4)The cost of airlines joining an airline alliance can be greatly reduced. Therefore, airlines should choose to join the alliance to reduce their own costs. If a company chooses to join the alliance, it needs to consider the influence of the alliance mechanism.
- [1] Mo H H, Wang J, Huang J. Evolutionary configuration of hub airport network in China: A k-core network model experience[J]. Tropical Geography, 2018, 38(5): 599-605. DOI:10.13284/j.cnki.rddl.003073.(in Chinese)
- [2] Mo H H, Hu H Q, Wang J. Air cargo carriers development and network evolution: A case study of China[J]. Geographical Research, 2017, 36(8): 1503-1514.DOI: 10.11821/dlyj201708009.(in Chinese)
- [3] Yang Z Z, Yu S N, Chen G. Optimzation of mixed air cargo transportation network[J]. Journal of Traffic and Transportation Engineering, 2016, 16(1): 103-114. DOI:10.19818/j.cnki.1671-1637.2016.01.013.(in Chinese)
- [4] Campbell J F, O'Kelly M E. Twenty-five years of hub location research[J].Transportation Science, 2012, 46(2): 153-169. DOI:10.1287/trsc.1120.0410.
- [5] Farahani R Z, Hekmatfar M, Arabani A B, et al. Hub location problems: A review of models, classification, solution techniques, and applications[J].Computers & Industrial Engineering, 2013, 64(4): 1096-1109. DOI:10.1016/j.cie.2013.01.012.
- [6] Campbell J F. Integer programming formulations of discrete hub location problems[J].European Journal of Operational Research, 1994, 72(2): 387-405. DOI:10.1016/0377-2217(94)90318-2.
- [7] Mohri S S, Karimi H, Kordani A A, et al. Airline hub-and-spoke network design based on airport capacity envelope curve: A practical view[J].Computers & Industrial Engineering, 2018, 125: 375-393. DOI:10.1016/j.cie.2018.09.010.
- [8] da Graça Costa M, Captivo M E, Clímaco J. Capacitated single allocation hub location problem: A bi-criteria approach[J].Computers & Operations Research, 2008, 35(11): 3671-3695. DOI:10.1016/j.cor.2007.04.005.
- [9] Wen Y H, Hsu C I. Interactive multiobjective programming in airline network design for international airline code-share alliance[J].European Journal of Operational Research, 2006, 174(1): 404-426. DOI:10.1016/j.ejor.2005.02.040.
- [10] Douglas I, Tan D. Global airline alliances and profitability: A difference-in-difference analysis[J].Transportation Research Part A: Policy and Practice, 2017, 103: 432-443. DOI:10.1016/j.tra.2017.05.024.
- [11] Yu M M, Chen L H, Chiang H. The effects of alliances and size on airlines' dynamic operational performance[J].Transportation Research Part A: Policy and Practice, 2017, 106: 197-214. DOI:10.1016/j.tra.2017.09.015.
- [12] Yuen A C L, Lei Z, Chow C K W, et al. Could market power explain hub premiums?[J].Journal of Air Transport Management, 2017, 64: 55-59. DOI:10.1016/j.jairtraman.2017.06.024.